Data analytics and business intelligence: Tasmania Question Answer
Added on 2022-10-06
12 Pages1506 Words6 Views
1
Data analytics and business intelligence: Tasmania
Name:
Institution:
Data analytics and business intelligence: Tasmania
Name:
Institution:

2
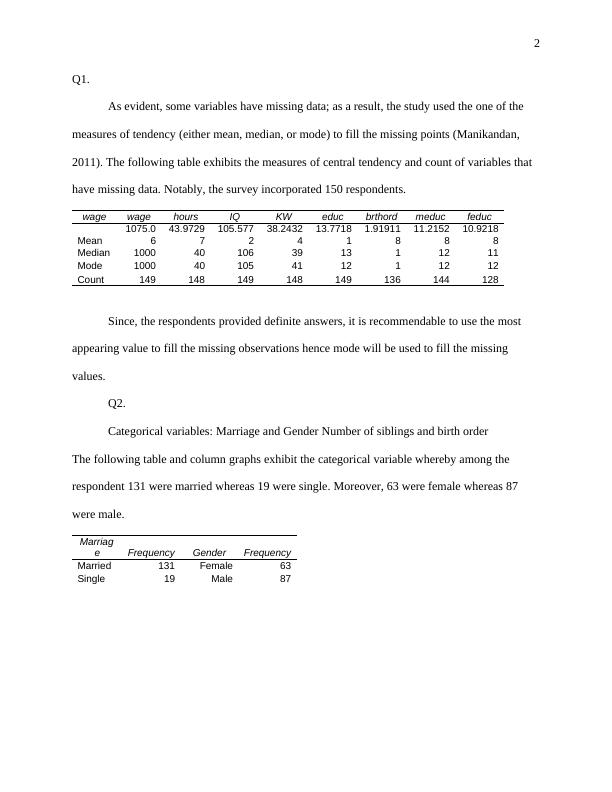
Q1.
As evident, some variables have missing data; as a result, the study used the one of the
measures of tendency (either mean, median, or mode) to fill the missing points (Manikandan,
2011). The following table exhibits the measures of central tendency and count of variables that
have missing data. Notably, the survey incorporated 150 respondents.
wage wage hours IQ KW educ brthord meduc feduc
Mean
1075.0
6
43.9729
7
105.577
2
38.2432
4
13.7718
1
1.91911
8
11.2152
8
10.9218
8
Median 1000 40 106 39 13 1 12 11
Mode 1000 40 105 41 12 1 12 12
Count 149 148 149 148 149 136 144 128
Since, the respondents provided definite answers, it is recommendable to use the most
appearing value to fill the missing observations hence mode will be used to fill the missing
values.
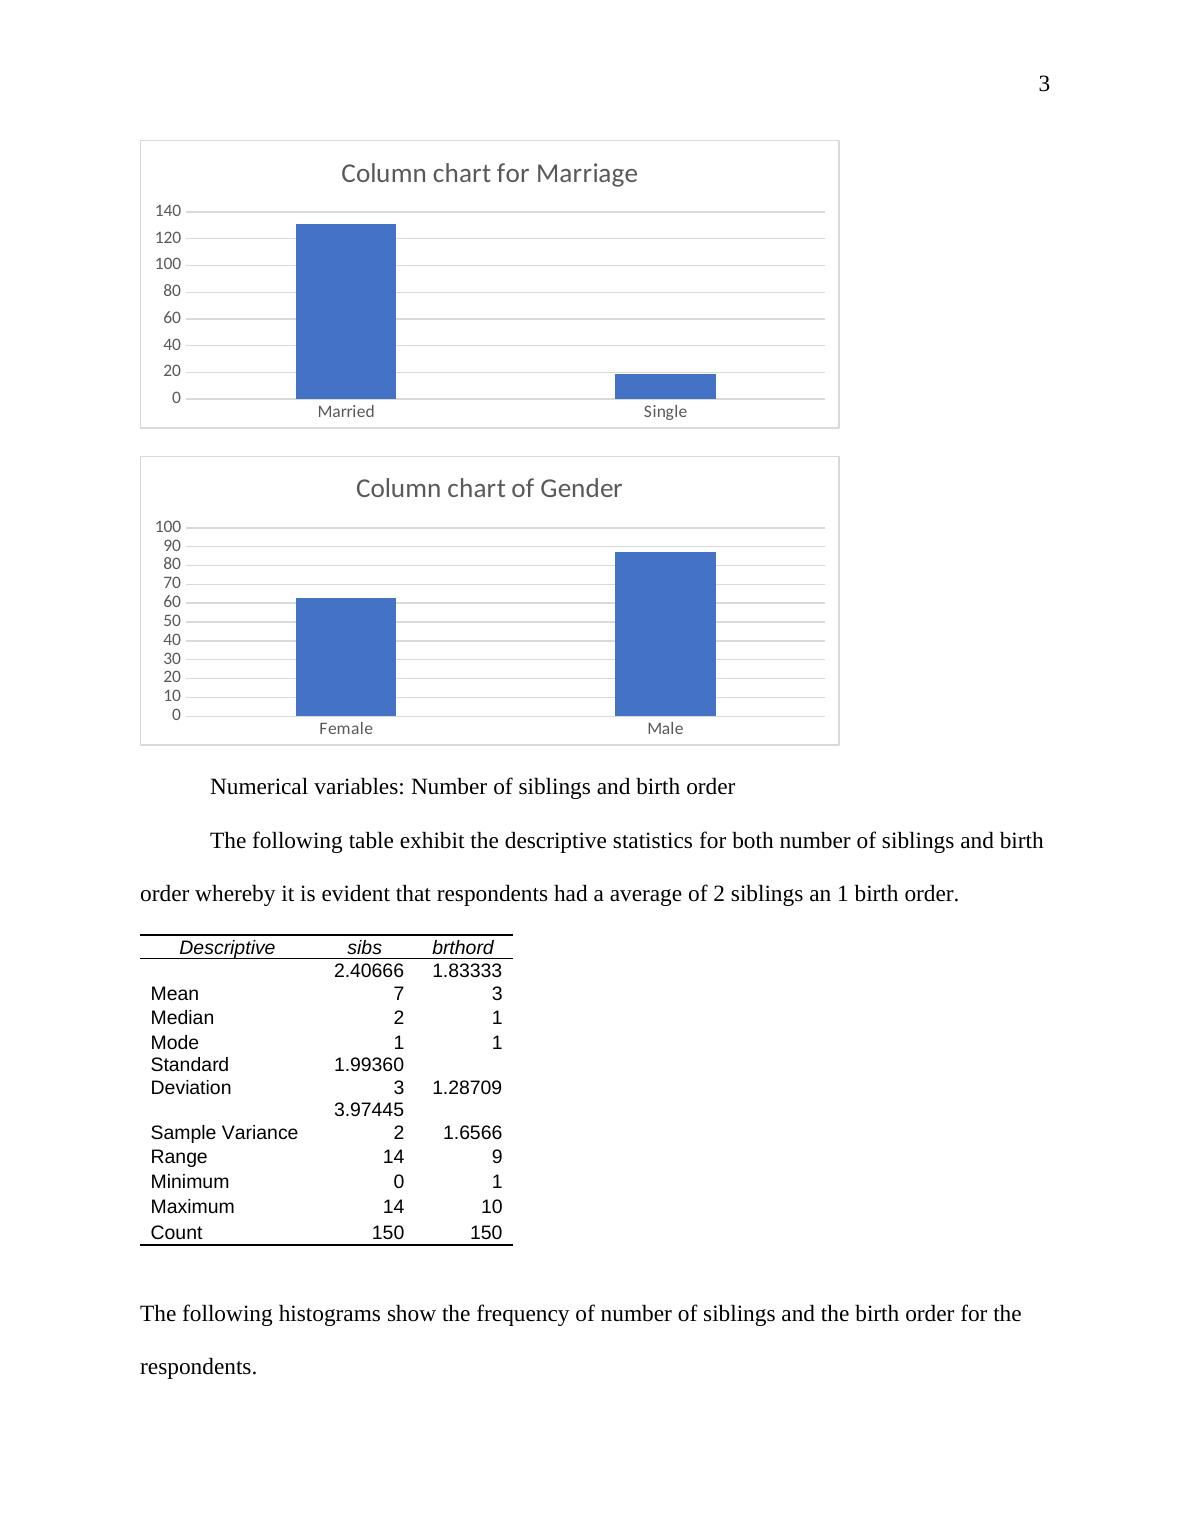
Q2.
Categorical variables: Marriage and Gender Number of siblings and birth order
The following table and column graphs exhibit the categorical variable whereby among the
respondent 131 were married whereas 19 were single. Moreover, 63 were female whereas 87
were male.
Marriag
e Frequency Gender Frequency
Married 131 Female 63
Single 19 Male 87
Q1.
As evident, some variables have missing data; as a result, the study used the one of the
measures of tendency (either mean, median, or mode) to fill the missing points (Manikandan,
2011). The following table exhibits the measures of central tendency and count of variables that
have missing data. Notably, the survey incorporated 150 respondents.
wage wage hours IQ KW educ brthord meduc feduc
Mean
1075.0
6
43.9729
7
105.577
2
38.2432
4
13.7718
1
1.91911
8
11.2152
8
10.9218
8
Median 1000 40 106 39 13 1 12 11
Mode 1000 40 105 41 12 1 12 12
Count 149 148 149 148 149 136 144 128
Since, the respondents provided definite answers, it is recommendable to use the most
appearing value to fill the missing observations hence mode will be used to fill the missing
values.
Q2.
Categorical variables: Marriage and Gender Number of siblings and birth order
The following table and column graphs exhibit the categorical variable whereby among the
respondent 131 were married whereas 19 were single. Moreover, 63 were female whereas 87
were male.
Marriag
e Frequency Gender Frequency
Married 131 Female 63
Single 19 Male 87
3
Married Single
0
20
40
60
80
100
120
140
Column chart for Marriage
Female Male
0
20
40
60
80
100
Column chart of Gender
Numerical variables: Number of siblings and birth order
The following table exhibit the descriptive statistics for both number of siblings and birth
order whereby it is evident that respondents had a average of 2 siblings an 1 birth order.
Descriptive sibs brthord
Mean
2.40666
7
1.83333
3
Median 2 1
Mode 1 1
Standard
Deviation
1.99360
3 1.28709
Sample Variance
3.97445
2 1.6566
Range 14 9
Minimum 0 1
Maximum 14 10
Count 150 150
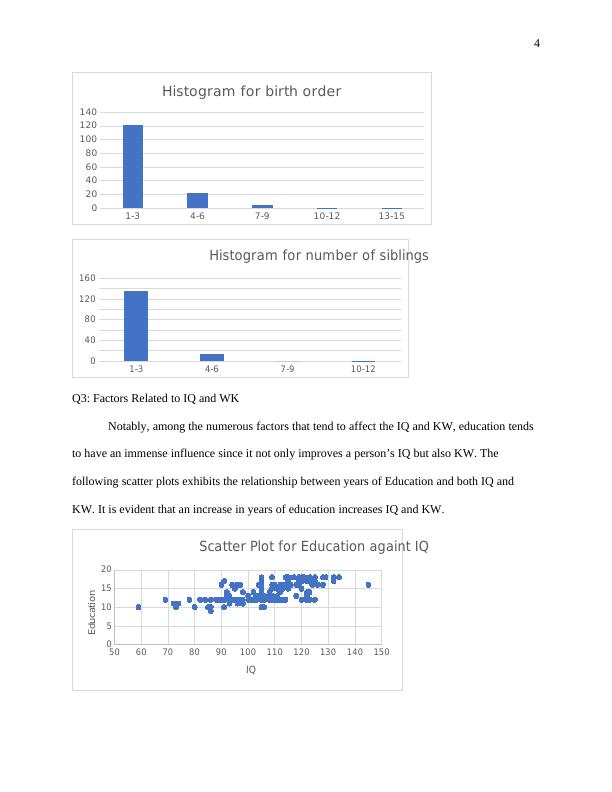
The following histograms show the frequency of number of siblings and the birth order for the
respondents.
Married Single
0
20
40
60
80
100
120
140
Column chart for Marriage
Female Male
0
20
40
60
80
100
Column chart of Gender
Numerical variables: Number of siblings and birth order
The following table exhibit the descriptive statistics for both number of siblings and birth
order whereby it is evident that respondents had a average of 2 siblings an 1 birth order.
Descriptive sibs brthord
Mean
2.40666
7
1.83333
3
Median 2 1
Mode 1 1
Standard
Deviation
1.99360
3 1.28709
Sample Variance
3.97445
2 1.6566
Range 14 9
Minimum 0 1
Maximum 14 10
Count 150 150
The following histograms show the frequency of number of siblings and the birth order for the
respondents.
4
1-3 4-6 7-9 10-12 13-15
0
20
40
60
80
100
120
140
Histogram for birth order
1-3 4-6 7-9 10-12
0
40
80
120
160
Histogram for number of siblings
Q3: Factors Related to IQ and WK
Notably, among the numerous factors that tend to affect the IQ and KW, education tends
to have an immense influence since it not only improves a person’s IQ but also KW. The
following scatter plots exhibits the relationship between years of Education and both IQ and
KW. It is evident that an increase in years of education increases IQ and KW.
50 60 70 80 90 100 110 120 130 140 150
0
5
10
15
20
Scatter Plot for Education againt IQ
IQ
Education
End of preview
Want to access all the pages? Upload your documents or become a member.