Techniques for Data Driven Decision Making Report for ABC Ltd
VerifiedAdded on 2023/06/10
|10
|2872
|451
Report
AI Summary
This report identifies data analytics strategies for ABC Ltd to improve organizational decision-making. It begins with an overview of big data, including examples of how ABC Ltd can gather it, the 4 V's of big data, and the differences between structured, unstructured, and semi-structured data. The report then demonstrates how to use Excel functions to calculate descriptive statistics and discusses Pearson’s correlation matrix using SPSS to interpret relationships between variables. Finally, it clarifies the meaning of data, its perception considering information, and the application of regression in business. The analysis aims to equip ABC Ltd with the insights needed for data-driven decision-making, covering customer experience, workflow streamlining, customer segmentation, sales forecasting, and financial performance evaluation. Desklib provides access to a wealth of similar solved assignments and study resources.
Identify the drivers
and strategies for data
analytics
and strategies for data
analytics
Paraphrase This Document
Need a fresh take? Get an instant paraphrase of this document with our AI Paraphraser
Contents
Introduction................................................................................................................................3
SCENARIO 1.............................................................................................................................3
What is big data and give examples of how ABC Ltd can gather big data?..........................3
What are the 4 V’s of big data?..............................................................................................3
What is structured data, unstructured data, and semi structured data with examples? (If
possible, your examples should be linked to retail sector).....................................................4
How can data analytics be used to improve decision making in ABC Ltd?..........................5
SCENARIO 2.............................................................................................................................5
Calculate using Excel functions various descriptive statistics...............................................5
SCENARIO 3.............................................................................................................................6
Discussion related to Pearson’s correlation matrix using SPSS, following an interpretation
related to the relationships formed between variables...........................................................6
SCENARIO 4.............................................................................................................................8
What does 'Data' mean and how could it be perceived considering information, as well as a
full clarification of Regression and the way things are applied in business..........................8
CONCLUSION..........................................................................................................................9
REFERNCES...........................................................................................................................10
Books and Journal................................................................................................................10

Introduction
Data is the raw information that stakeholders collect in order to analyse it and aid
them in the company's decision-making process. Data on many issues gives consumers with
insights and improves the company's credibility through improved management over time.
Decision-making is an important feature that organisations employ to run and act efficiently
in the marketplace. Four possibilities based on data analytics are highlighted in the following
study. In the first scenario, a broad overview of big data is given, followed by an example of
its use in the instance of ABC ltd. The second case demonstrates how to evaluate huge data
using Excel and its functionalities. The final case demonstrates how to use SPSS to determine
the link between several variables. The paper concludes with a discussion of the role of
information in decision-making.
SCENARIO 1
What is big data and give examples of how ABC Ltd can gather big data?
Big Data is the combination and is a type of structure similar structure and
unstructured data which is collected by the company and that can be mined for the
information and that is used in machine learning project as well as for the predictive
modeling and other advanced analytics applications. It is a kind of metrological approach that
helps the organization to collect the data and evaluate the massive Amount of the particular
data from the variety of the sources so that they can capture a complete and appropriate
picture of an company operation in order to derive insights and make critical business
decision. In order to gather a big data it is very important for the ABC organization to
conduct and focusing on the online marketing analytics because it helps them to collect the
effective data and also conduct loyalty programs in cards because loyalty programs are a
popular practices for the retailers in order to build brand loyalty and brand image. Apart from
this the organization are also required to focusing on the social media activity and
communicate with their customer directly and tracking their information indirectly in order to
maintain their connections and enhance their relationship with their consumers.
What are the 4 V’s of big data?
There are four V’s of big data and that is volume, velocity, variety and veracity.
Volume: It should come as no surprise that Big Data has a big volume. Every day, people
generate 2.3 trillion gigabytes of data, according to estimates. And it's only going to get
⊘ This is a preview!⊘
Do you want full access?
Subscribe today to unlock all pages.
Trusted by 1+ million students worldwide
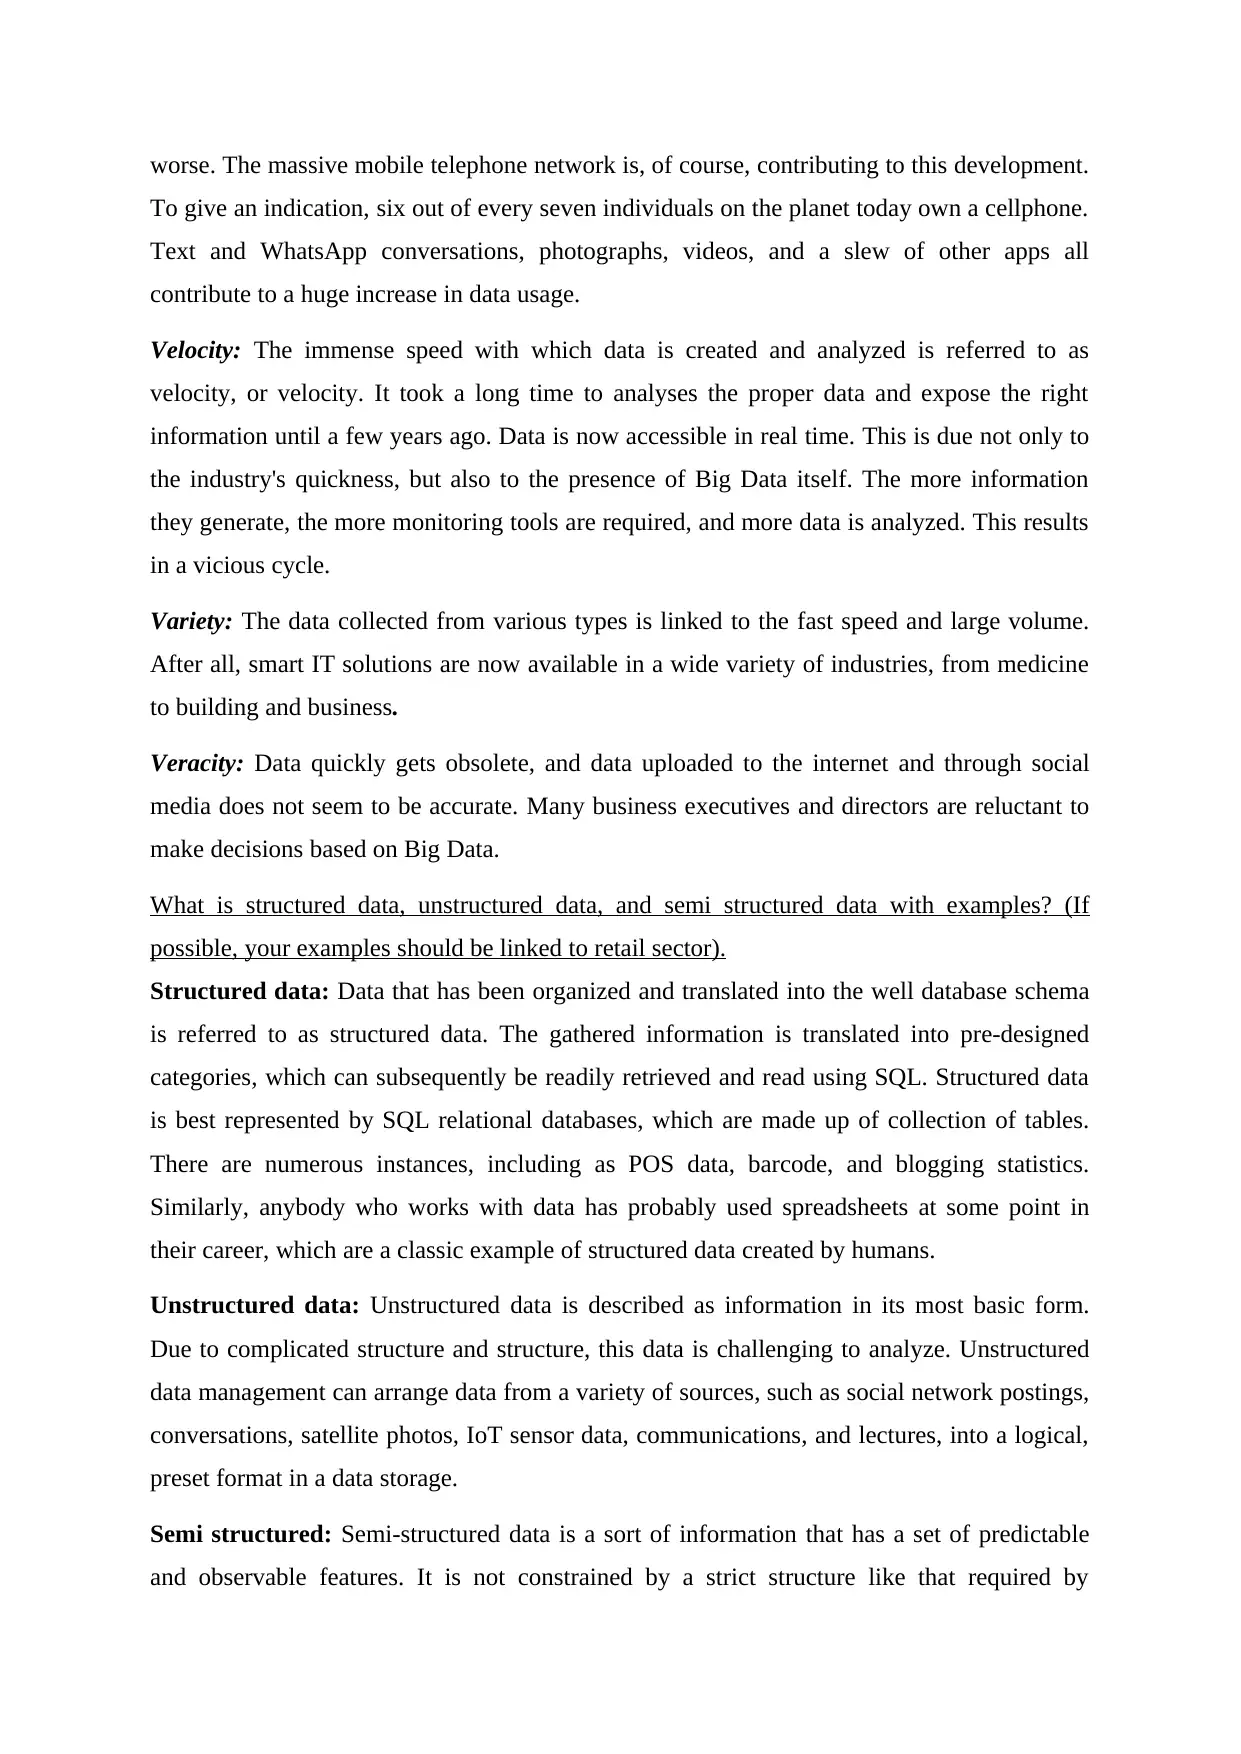
worse. The massive mobile telephone network is, of course, contributing to this development.
To give an indication, six out of every seven individuals on the planet today own a cellphone.
Text and WhatsApp conversations, photographs, videos, and a slew of other apps all
contribute to a huge increase in data usage.
Velocity: The immense speed with which data is created and analyzed is referred to as
velocity, or velocity. It took a long time to analyses the proper data and expose the right
information until a few years ago. Data is now accessible in real time. This is due not only to
the industry's quickness, but also to the presence of Big Data itself. The more information
they generate, the more monitoring tools are required, and more data is analyzed. This results
in a vicious cycle.
Variety: The data collected from various types is linked to the fast speed and large volume.
After all, smart IT solutions are now available in a wide variety of industries, from medicine
to building and business.
Veracity: Data quickly gets obsolete, and data uploaded to the internet and through social
media does not seem to be accurate. Many business executives and directors are reluctant to
make decisions based on Big Data.
What is structured data, unstructured data, and semi structured data with examples? (If
possible, your examples should be linked to retail sector).
Structured data: Data that has been organized and translated into the well database schema
is referred to as structured data. The gathered information is translated into pre-designed
categories, which can subsequently be readily retrieved and read using SQL. Structured data
is best represented by SQL relational databases, which are made up of collection of tables.
There are numerous instances, including as POS data, barcode, and blogging statistics.
Similarly, anybody who works with data has probably used spreadsheets at some point in
their career, which are a classic example of structured data created by humans.
Unstructured data: Unstructured data is described as information in its most basic form.
Due to complicated structure and structure, this data is challenging to analyze. Unstructured
data management can arrange data from a variety of sources, such as social network postings,
conversations, satellite photos, IoT sensor data, communications, and lectures, into a logical,
preset format in a data storage.
Semi structured: Semi-structured data is a sort of information that has a set of predictable
and observable features. It is not constrained by a strict structure like that required by
Paraphrase This Document
Need a fresh take? Get an instant paraphrase of this document with our AI Paraphraser
relational database systems. Semi-structured number is provided organizational qualities such
as information or semantically tags to make it more manageable, but it still has some
unpredictability and irregularity.
How can data analytics be used to improve decision making in ABC Ltd?
Data analytics help the organization to enhance the customer experience and also
helps them to streamline workflows and also improve productivity. Apart from this its
support organization to conduct and do customer segmentation and sales forecasting so that
the organization can easily target their relevant customers and health organization to evaluate
the financial performance of the organization in order to access the complete financial truth.
SCENARIO 2
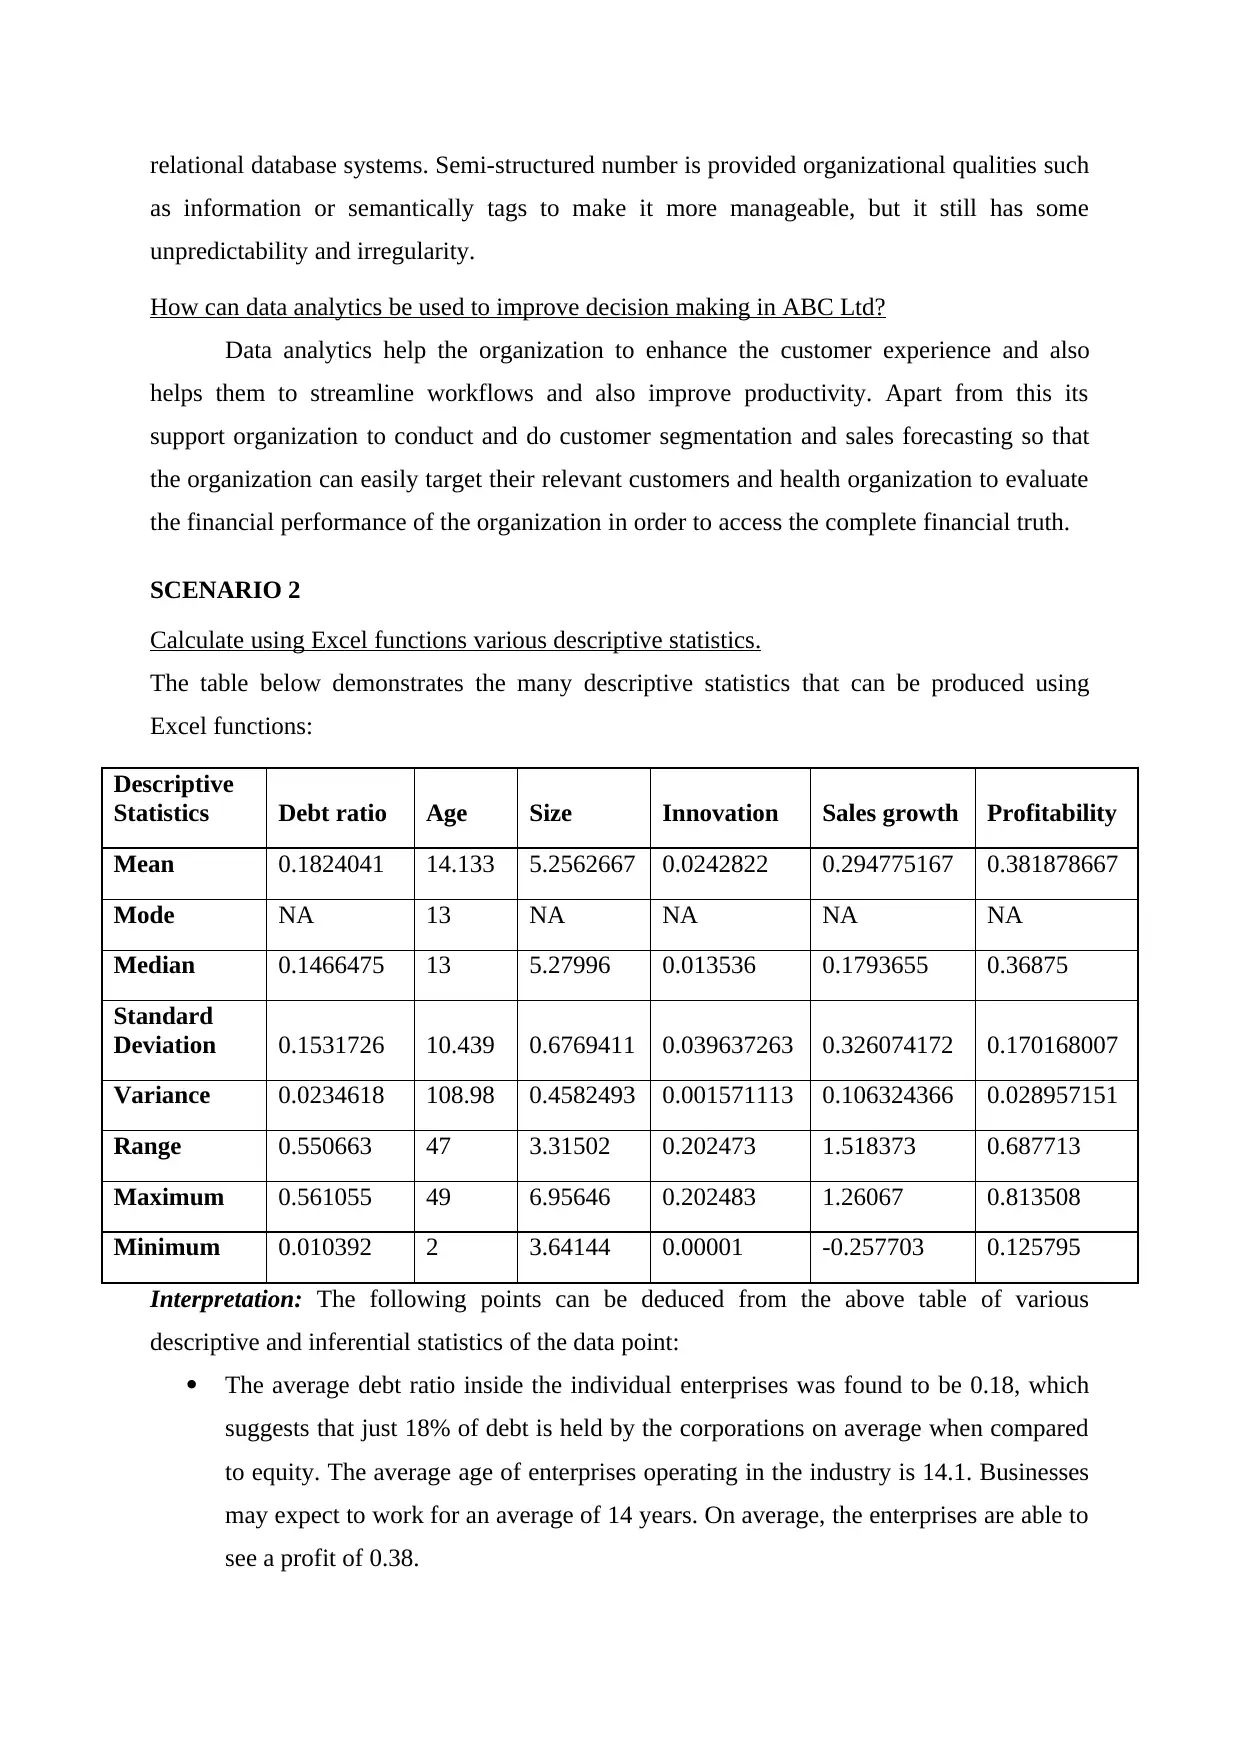
Calculate using Excel functions various descriptive statistics.
The table below demonstrates the many descriptive statistics that can be produced using
Excel functions:
Descriptive
Statistics Debt ratio Age Size Innovation Sales growth Profitability
Mean 0.1824041 14.133 5.2562667 0.0242822 0.294775167 0.381878667
Mode NA 13 NA NA NA NA
Median 0.1466475 13 5.27996 0.013536 0.1793655 0.36875
Standard
Deviation 0.1531726 10.439 0.6769411 0.039637263 0.326074172 0.170168007
Variance 0.0234618 108.98 0.4582493 0.001571113 0.106324366 0.028957151
Range 0.550663 47 3.31502 0.202473 1.518373 0.687713
Maximum 0.561055 49 6.95646 0.202483 1.26067 0.813508
Minimum 0.010392 2 3.64144 0.00001 -0.257703 0.125795
Interpretation: The following points can be deduced from the above table of various
descriptive and inferential statistics of the data point:
The average debt ratio inside the individual enterprises was found to be 0.18, which
suggests that just 18% of debt is held by the corporations on average when compared
to equity. The average age of enterprises operating in the industry is 14.1. Businesses
may expect to work for an average of 14 years. On average, the enterprises are able to
see a profit of 0.38.
as information or semantically tags to make it more manageable, but it still has some
unpredictability and irregularity.
How can data analytics be used to improve decision making in ABC Ltd?
Data analytics help the organization to enhance the customer experience and also
helps them to streamline workflows and also improve productivity. Apart from this its
support organization to conduct and do customer segmentation and sales forecasting so that
the organization can easily target their relevant customers and health organization to evaluate
the financial performance of the organization in order to access the complete financial truth.
SCENARIO 2
Calculate using Excel functions various descriptive statistics.
The table below demonstrates the many descriptive statistics that can be produced using
Excel functions:
Descriptive
Statistics Debt ratio Age Size Innovation Sales growth Profitability
Mean 0.1824041 14.133 5.2562667 0.0242822 0.294775167 0.381878667
Mode NA 13 NA NA NA NA
Median 0.1466475 13 5.27996 0.013536 0.1793655 0.36875
Standard
Deviation 0.1531726 10.439 0.6769411 0.039637263 0.326074172 0.170168007
Variance 0.0234618 108.98 0.4582493 0.001571113 0.106324366 0.028957151
Range 0.550663 47 3.31502 0.202473 1.518373 0.687713
Maximum 0.561055 49 6.95646 0.202483 1.26067 0.813508
Minimum 0.010392 2 3.64144 0.00001 -0.257703 0.125795
Interpretation: The following points can be deduced from the above table of various
descriptive and inferential statistics of the data point:
The average debt ratio inside the individual enterprises was found to be 0.18, which
suggests that just 18% of debt is held by the corporations on average when compared
to equity. The average age of enterprises operating in the industry is 14.1. Businesses
may expect to work for an average of 14 years. On average, the enterprises are able to
see a profit of 0.38.
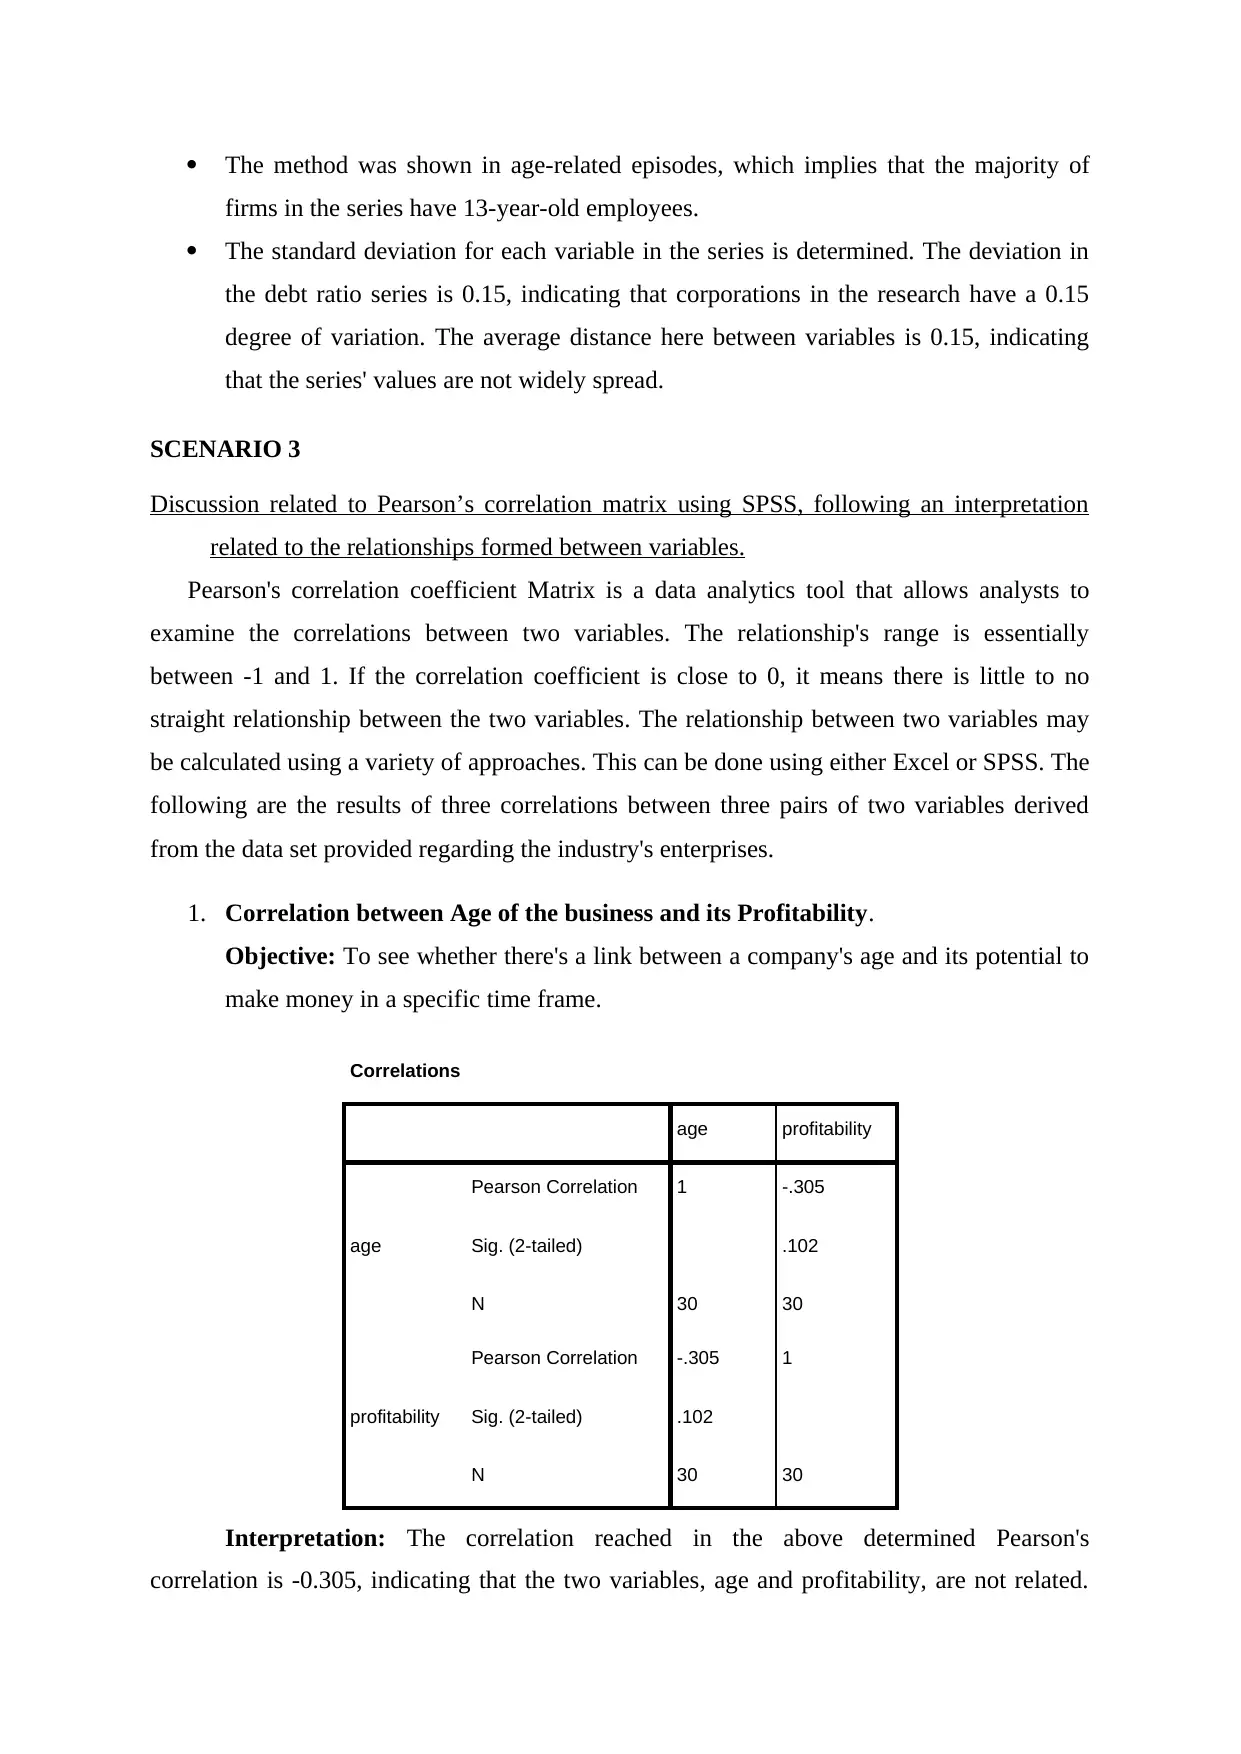
The method was shown in age-related episodes, which implies that the majority of
firms in the series have 13-year-old employees.
The standard deviation for each variable in the series is determined. The deviation in
the debt ratio series is 0.15, indicating that corporations in the research have a 0.15
degree of variation. The average distance here between variables is 0.15, indicating
that the series' values are not widely spread.
SCENARIO 3
Discussion related to Pearson’s correlation matrix using SPSS, following an interpretation
related to the relationships formed between variables.
Pearson's correlation coefficient Matrix is a data analytics tool that allows analysts to
examine the correlations between two variables. The relationship's range is essentially
between -1 and 1. If the correlation coefficient is close to 0, it means there is little to no
straight relationship between the two variables. The relationship between two variables may
be calculated using a variety of approaches. This can be done using either Excel or SPSS. The
following are the results of three correlations between three pairs of two variables derived
from the data set provided regarding the industry's enterprises.
1. Correlation between Age of the business and its Profitability.
Objective: To see whether there's a link between a company's age and its potential to
make money in a specific time frame.
Correlations
age profitability
age
Pearson Correlation 1 -.305
Sig. (2-tailed) .102
N 30 30
profitability
Pearson Correlation -.305 1
Sig. (2-tailed) .102
N 30 30
Interpretation: The correlation reached in the above determined Pearson's
correlation is -0.305, indicating that the two variables, age and profitability, are not related.
⊘ This is a preview!⊘
Do you want full access?
Subscribe today to unlock all pages.
Trusted by 1+ million students worldwide
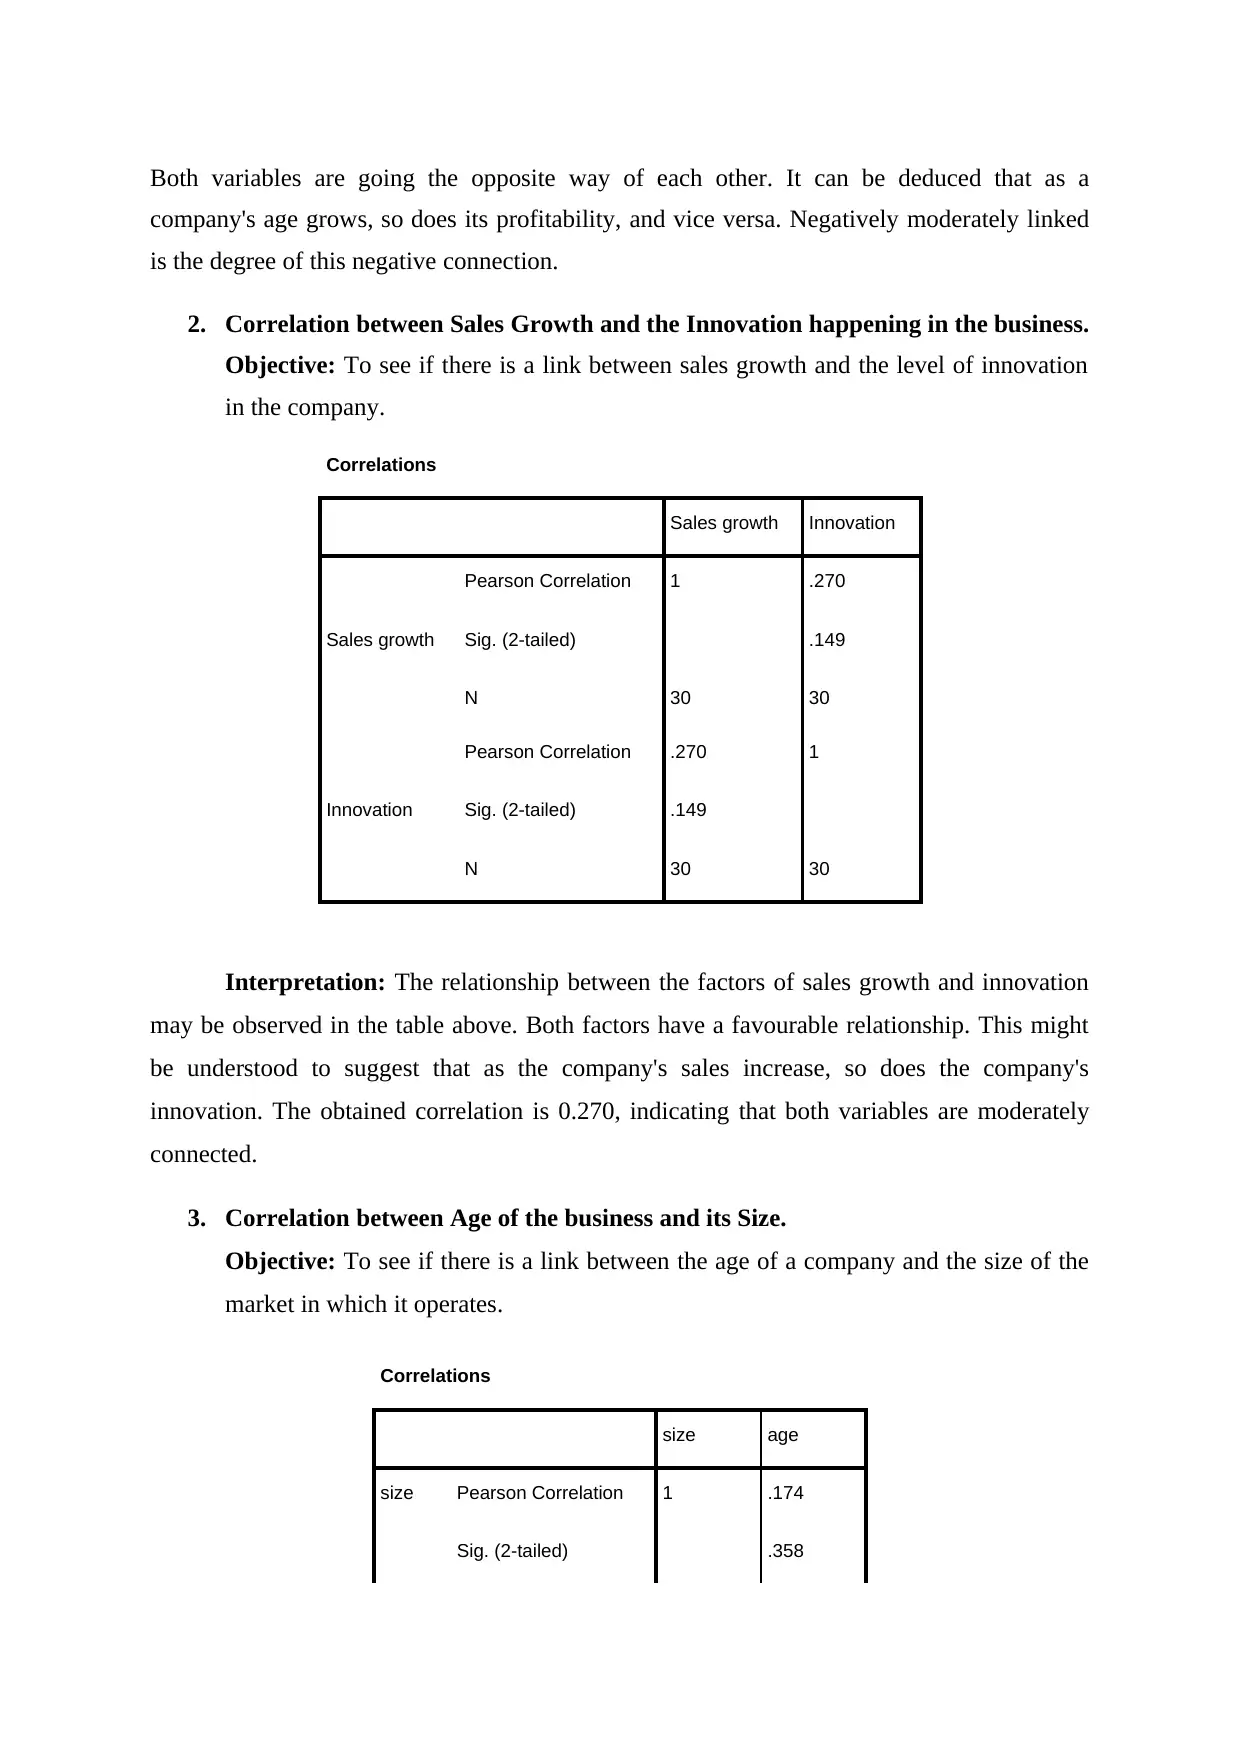
Both variables are going the opposite way of each other. It can be deduced that as a
company's age grows, so does its profitability, and vice versa. Negatively moderately linked
is the degree of this negative connection.
2. Correlation between Sales Growth and the Innovation happening in the business.
Objective: To see if there is a link between sales growth and the level of innovation
in the company.
Correlations
Sales growth Innovation
Sales growth
Pearson Correlation 1 .270
Sig. (2-tailed) .149
N 30 30
Innovation
Pearson Correlation .270 1
Sig. (2-tailed) .149
N 30 30
Interpretation: The relationship between the factors of sales growth and innovation
may be observed in the table above. Both factors have a favourable relationship. This might
be understood to suggest that as the company's sales increase, so does the company's
innovation. The obtained correlation is 0.270, indicating that both variables are moderately
connected.
3. Correlation between Age of the business and its Size.
Objective: To see if there is a link between the age of a company and the size of the
market in which it operates.
Correlations
size age
size Pearson Correlation 1 .174
Sig. (2-tailed) .358
Paraphrase This Document
Need a fresh take? Get an instant paraphrase of this document with our AI Paraphraser
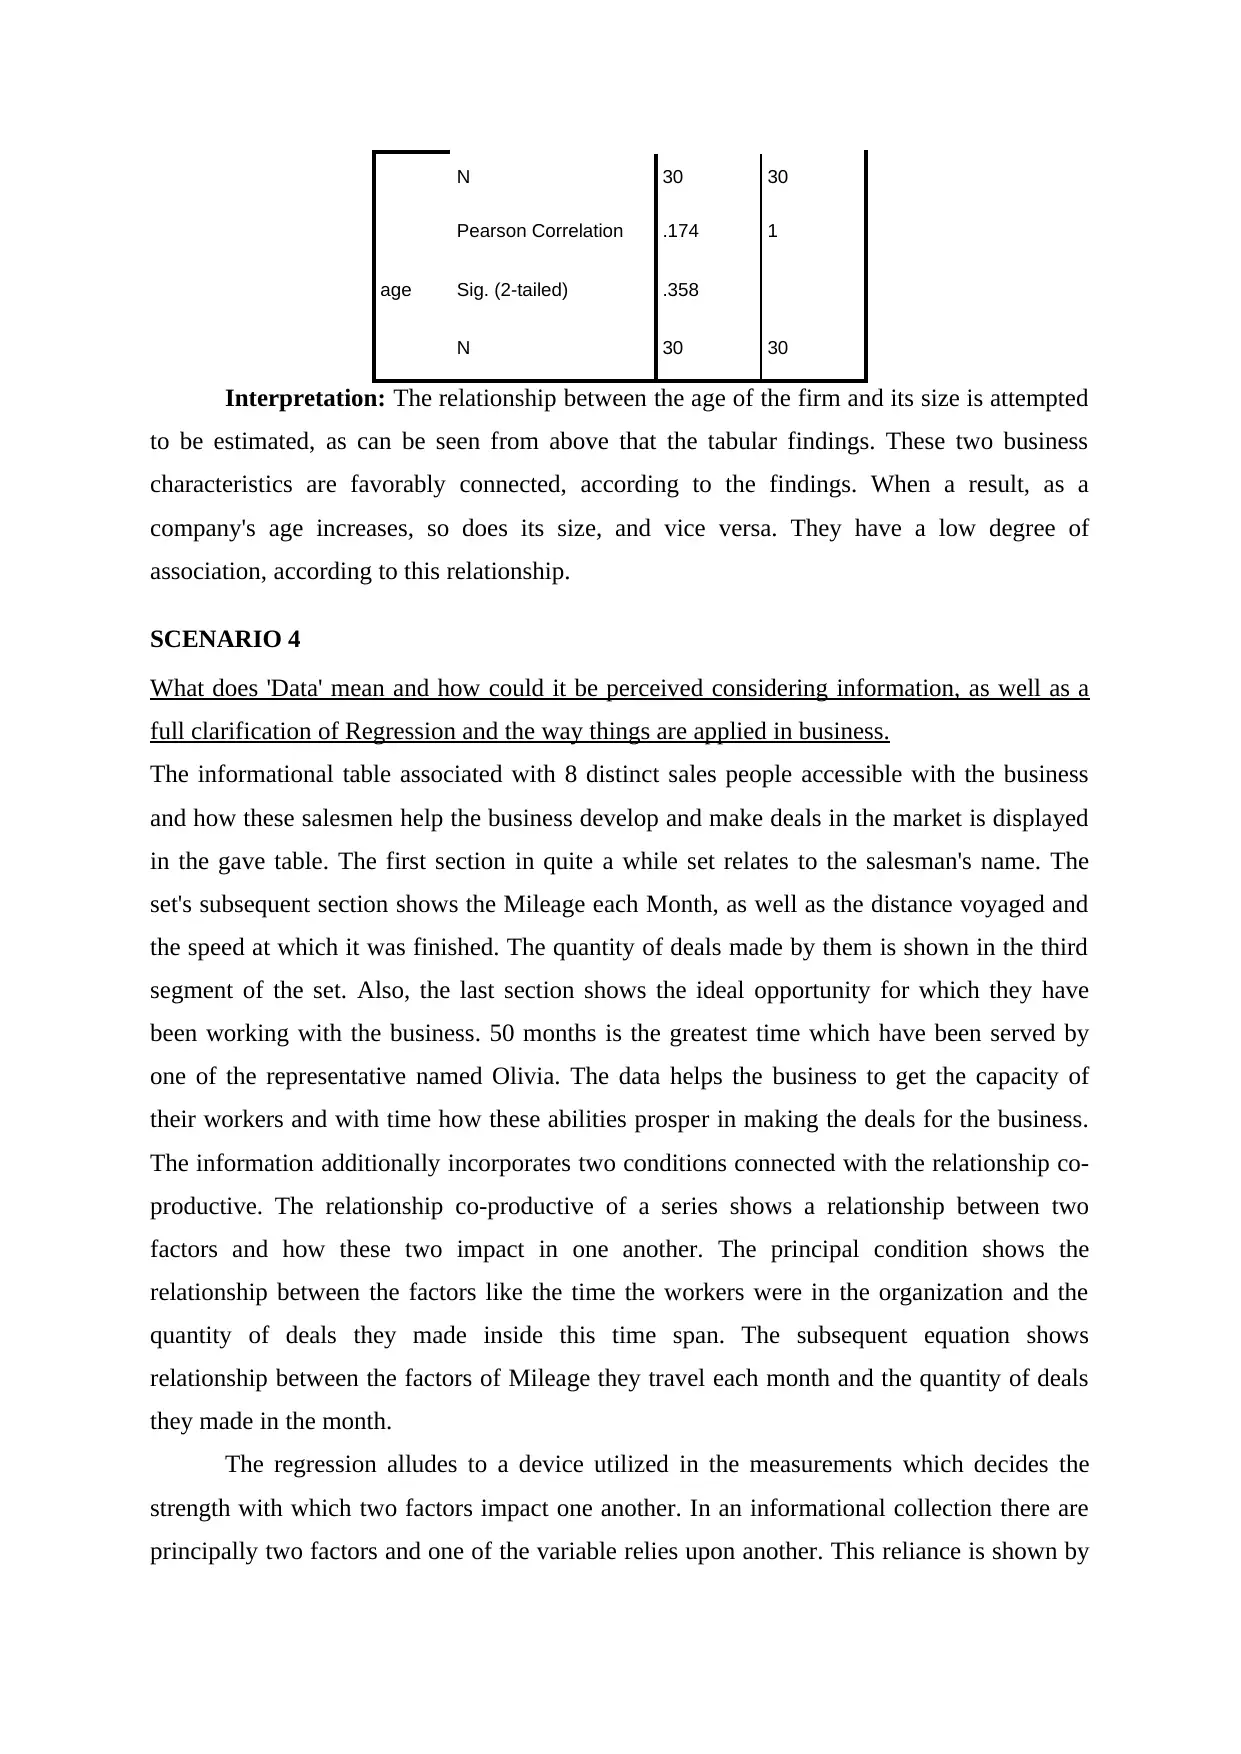
N 30 30
age
Pearson Correlation .174 1
Sig. (2-tailed) .358
N 30 30
Interpretation: The relationship between the age of the firm and its size is attempted
to be estimated, as can be seen from above that the tabular findings. These two business
characteristics are favorably connected, according to the findings. When a result, as a
company's age increases, so does its size, and vice versa. They have a low degree of
association, according to this relationship.
SCENARIO 4
What does 'Data' mean and how could it be perceived considering information, as well as a
full clarification of Regression and the way things are applied in business.
The informational table associated with 8 distinct sales people accessible with the business
and how these salesmen help the business develop and make deals in the market is displayed
in the gave table. The first section in quite a while set relates to the salesman's name. The
set's subsequent section shows the Mileage each Month, as well as the distance voyaged and
the speed at which it was finished. The quantity of deals made by them is shown in the third
segment of the set. Also, the last section shows the ideal opportunity for which they have
been working with the business. 50 months is the greatest time which have been served by
one of the representative named Olivia. The data helps the business to get the capacity of
their workers and with time how these abilities prosper in making the deals for the business.
The information additionally incorporates two conditions connected with the relationship co-
productive. The relationship co-productive of a series shows a relationship between two
factors and how these two impact in one another. The principal condition shows the
relationship between the factors like the time the workers were in the organization and the
quantity of deals they made inside this time span. The subsequent equation shows
relationship between the factors of Mileage they travel each month and the quantity of deals
they made in the month.
The regression alludes to a device utilized in the measurements which decides the
strength with which two factors impact one another. In an informational collection there are
principally two factors and one of the variable relies upon another. This reliance is shown by
the regression analysis. The business involves regression as a significant instrument to check
how one variable decides other and how this connection can be changed to gain ground in the
business. It is basically utilized by the organizations for two purposes. These two object are,
anticipating and improvement. It helps the essential supervisors of the business to anticipate
the forthcoming future of the business and its items and exceptionally improve the
assembling and conveying processes of the business.
CONCLUSION
According to the above-mentioned survey, big data and its interpretation are critical
aspects of every organisation. This analysis is used by the company to analyse its own and
other firms' operations and build new plans. The importance of comprehending the idea of
big data cannot be overstated. The four v's of big data define what data is considered big data
and what data isn't. Regression analysis can also assist a company in forecasting and
optimising its operations.
⊘ This is a preview!⊘
Do you want full access?
Subscribe today to unlock all pages.
Trusted by 1+ million students worldwide
REFERNCES
Books and Journal
De Jesus, A. and Mendonça, S., 2018. Lost in transition? Drivers and barriers in the eco-
innovation road to the circular economy. Ecological economics, 145, pp.75-89.
Berger, M.F. and Mardis, E.R., 2018. The emerging clinical relevance of genomics in cancer
medicine. Nature Reviews Clinical Oncology, 15(6), pp.353-365.
Sharma, R., Kamble, S.S., Gunasekaran, A., Kumar, V. and Kumar, A., 2020. A systematic
literature review on machine learning applications for sustainable agriculture supply
chain performance. Computers & Operations Research, 119, p.104926.
Anshari, M., Almunawar, M.N., Lim, S.A. and Al-Mudimigh, A., 2019. Customer
relationship management and big data enabled: Personalization & customization of
services. Applied Computing and Informatics, 15(2), pp.94-101.
De Francesco, E.M., Sotgia, F. and Lisanti, M.P., 2018. Cancer stem cells (CSCs): metabolic
strategies for their identification and eradication. Biochemical Journal, 475(9), pp.1611-
1634.
Lim, C., Kim, K.J. and Maglio, P.P., 2018. Smart cities with big data: Reference models,
challenges, and considerations. Cities, 82, pp.86-99.
Gregory, G.D., Ngo, L.V. and Karavdic, M., 2019. Developing e-commerce marketing
capabilities and efficiencies for enhanced performance in business-to-business export
ventures. Industrial Marketing Management, 78, pp.146-157.
Butler, A., Hoffman, P., Smibert, P., Papalexi, E. and Satija, R., 2018. Integrating single-cell
transcriptomic data across different conditions, technologies, and species. Nature
biotechnology, 36(5), pp.411-420.
Bressanelli, G., Adrodegari, F., Perona, M. and Saccani, N., 2018. Exploring how usage-
focused business models enable circular economy through digital
technologies. Sustainability, 10(3), p.639.
1 out of 10
Related Documents

Your All-in-One AI-Powered Toolkit for Academic Success.
+13062052269
info@desklib.com
Available 24*7 on WhatsApp / Email
![[object Object]](/_next/static/media/star-bottom.7253800d.svg)
Unlock your academic potential
Copyright © 2020–2026 A2Z Services. All Rights Reserved. Developed and managed by ZUCOL.