MG4002 Data Analysis Report: Child Qualities, Family, and Work
VerifiedAdded on 2021/06/18
|15
|3502
|134
Report
AI Summary
This report presents a data analysis conducted using SPSS to investigate the relationships between child qualities (specifically, feeling of responsibility) and two independent variables: family importance and work importance. The study employed both Pearson and Spearman correlation coefficients to assess the statistical significance of these relationships. Frequency distributions were examined for each variable to understand the data's characteristics. The analysis revealed that there was insufficient evidence to conclude a statistically significant relationship between child qualities and either family importance or work importance. Consequently, the linear regression model was deemed inappropriate for predicting the dependent variable, and the report suggests the use of a binary logistic regression model due to the dichotomous nature of the dependent variable. The report includes detailed SPSS outputs and discusses the implications of the findings.

Data Analytics
MG4002
MG4002
Paraphrase This Document
Need a fresh take? Get an instant paraphrase of this document with our AI Paraphraser
Table of Contents
Abstract................................................................................................................................3
Introduction..........................................................................................................................3
Conceptual Framework........................................................................................................4
Methodology........................................................................................................................5
Data Analysis and Results....................................................................................................4
Discussion and Conclusions.................................................................................................5
References............................................................................................................................5
2 | P a g e
Data Analytics
MG4002
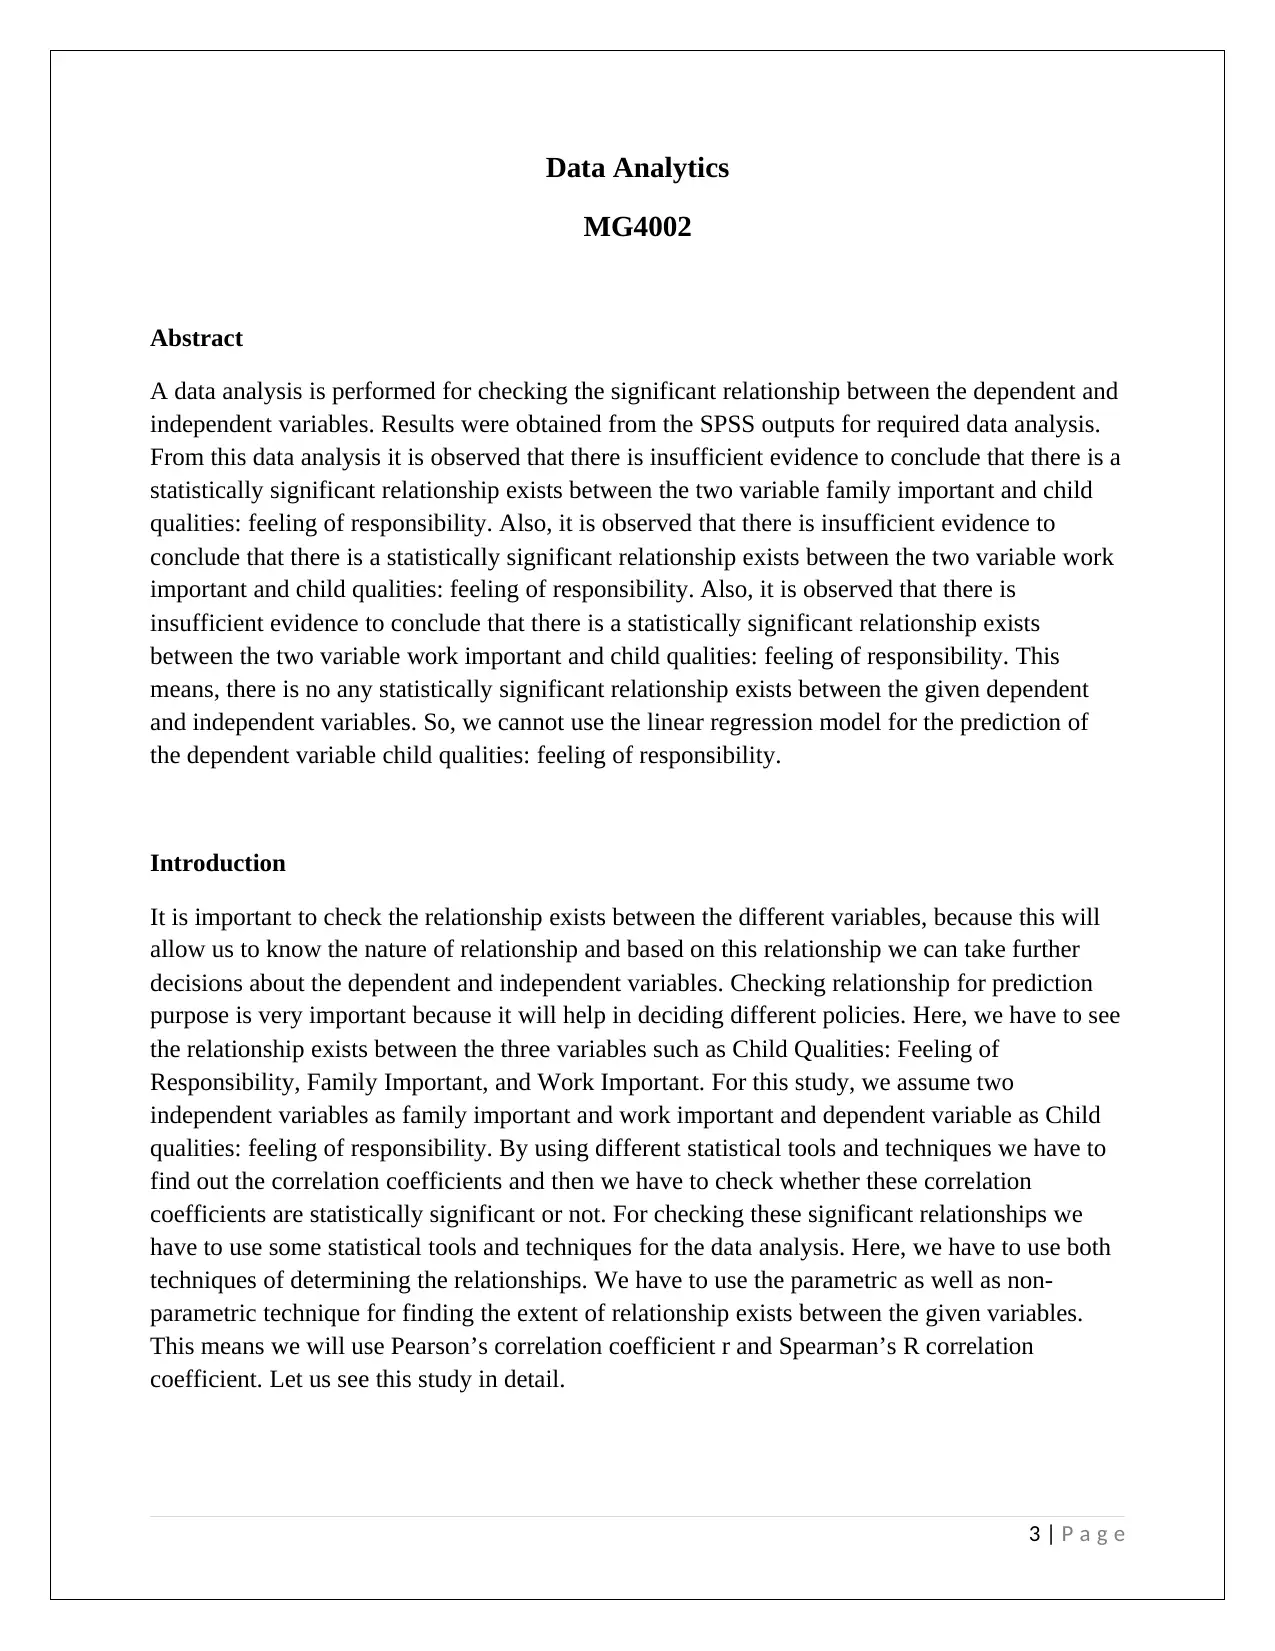
Abstract
A data analysis is performed for checking the significant relationship between the dependent and
independent variables. Results were obtained from the SPSS outputs for required data analysis.
From this data analysis it is observed that there is insufficient evidence to conclude that there is a
statistically significant relationship exists between the two variable family important and child
qualities: feeling of responsibility. Also, it is observed that there is insufficient evidence to
conclude that there is a statistically significant relationship exists between the two variable work
important and child qualities: feeling of responsibility. Also, it is observed that there is
insufficient evidence to conclude that there is a statistically significant relationship exists
between the two variable work important and child qualities: feeling of responsibility. This
means, there is no any statistically significant relationship exists between the given dependent
and independent variables. So, we cannot use the linear regression model for the prediction of
the dependent variable child qualities: feeling of responsibility.
Introduction
It is important to check the relationship exists between the different variables, because this will
allow us to know the nature of relationship and based on this relationship we can take further
decisions about the dependent and independent variables. Checking relationship for prediction
purpose is very important because it will help in deciding different policies. Here, we have to see
the relationship exists between the three variables such as Child Qualities: Feeling of
Responsibility, Family Important, and Work Important. For this study, we assume two
independent variables as family important and work important and dependent variable as Child
qualities: feeling of responsibility. By using different statistical tools and techniques we have to
find out the correlation coefficients and then we have to check whether these correlation
coefficients are statistically significant or not. For checking these significant relationships we
have to use some statistical tools and techniques for the data analysis. Here, we have to use both
techniques of determining the relationships. We have to use the parametric as well as non-
parametric technique for finding the extent of relationship exists between the given variables.
This means we will use Pearson’s correlation coefficient r and Spearman’s R correlation
coefficient. Let us see this study in detail.
3 | P a g e
MG4002
Abstract
A data analysis is performed for checking the significant relationship between the dependent and
independent variables. Results were obtained from the SPSS outputs for required data analysis.
From this data analysis it is observed that there is insufficient evidence to conclude that there is a
statistically significant relationship exists between the two variable family important and child
qualities: feeling of responsibility. Also, it is observed that there is insufficient evidence to
conclude that there is a statistically significant relationship exists between the two variable work
important and child qualities: feeling of responsibility. Also, it is observed that there is
insufficient evidence to conclude that there is a statistically significant relationship exists
between the two variable work important and child qualities: feeling of responsibility. This
means, there is no any statistically significant relationship exists between the given dependent
and independent variables. So, we cannot use the linear regression model for the prediction of
the dependent variable child qualities: feeling of responsibility.
Introduction
It is important to check the relationship exists between the different variables, because this will
allow us to know the nature of relationship and based on this relationship we can take further
decisions about the dependent and independent variables. Checking relationship for prediction
purpose is very important because it will help in deciding different policies. Here, we have to see
the relationship exists between the three variables such as Child Qualities: Feeling of
Responsibility, Family Important, and Work Important. For this study, we assume two
independent variables as family important and work important and dependent variable as Child
qualities: feeling of responsibility. By using different statistical tools and techniques we have to
find out the correlation coefficients and then we have to check whether these correlation
coefficients are statistically significant or not. For checking these significant relationships we
have to use some statistical tools and techniques for the data analysis. Here, we have to use both
techniques of determining the relationships. We have to use the parametric as well as non-
parametric technique for finding the extent of relationship exists between the given variables.
This means we will use Pearson’s correlation coefficient r and Spearman’s R correlation
coefficient. Let us see this study in detail.
3 | P a g e
⊘ This is a preview!⊘
Do you want full access?
Subscribe today to unlock all pages.
Trusted by 1+ million students worldwide
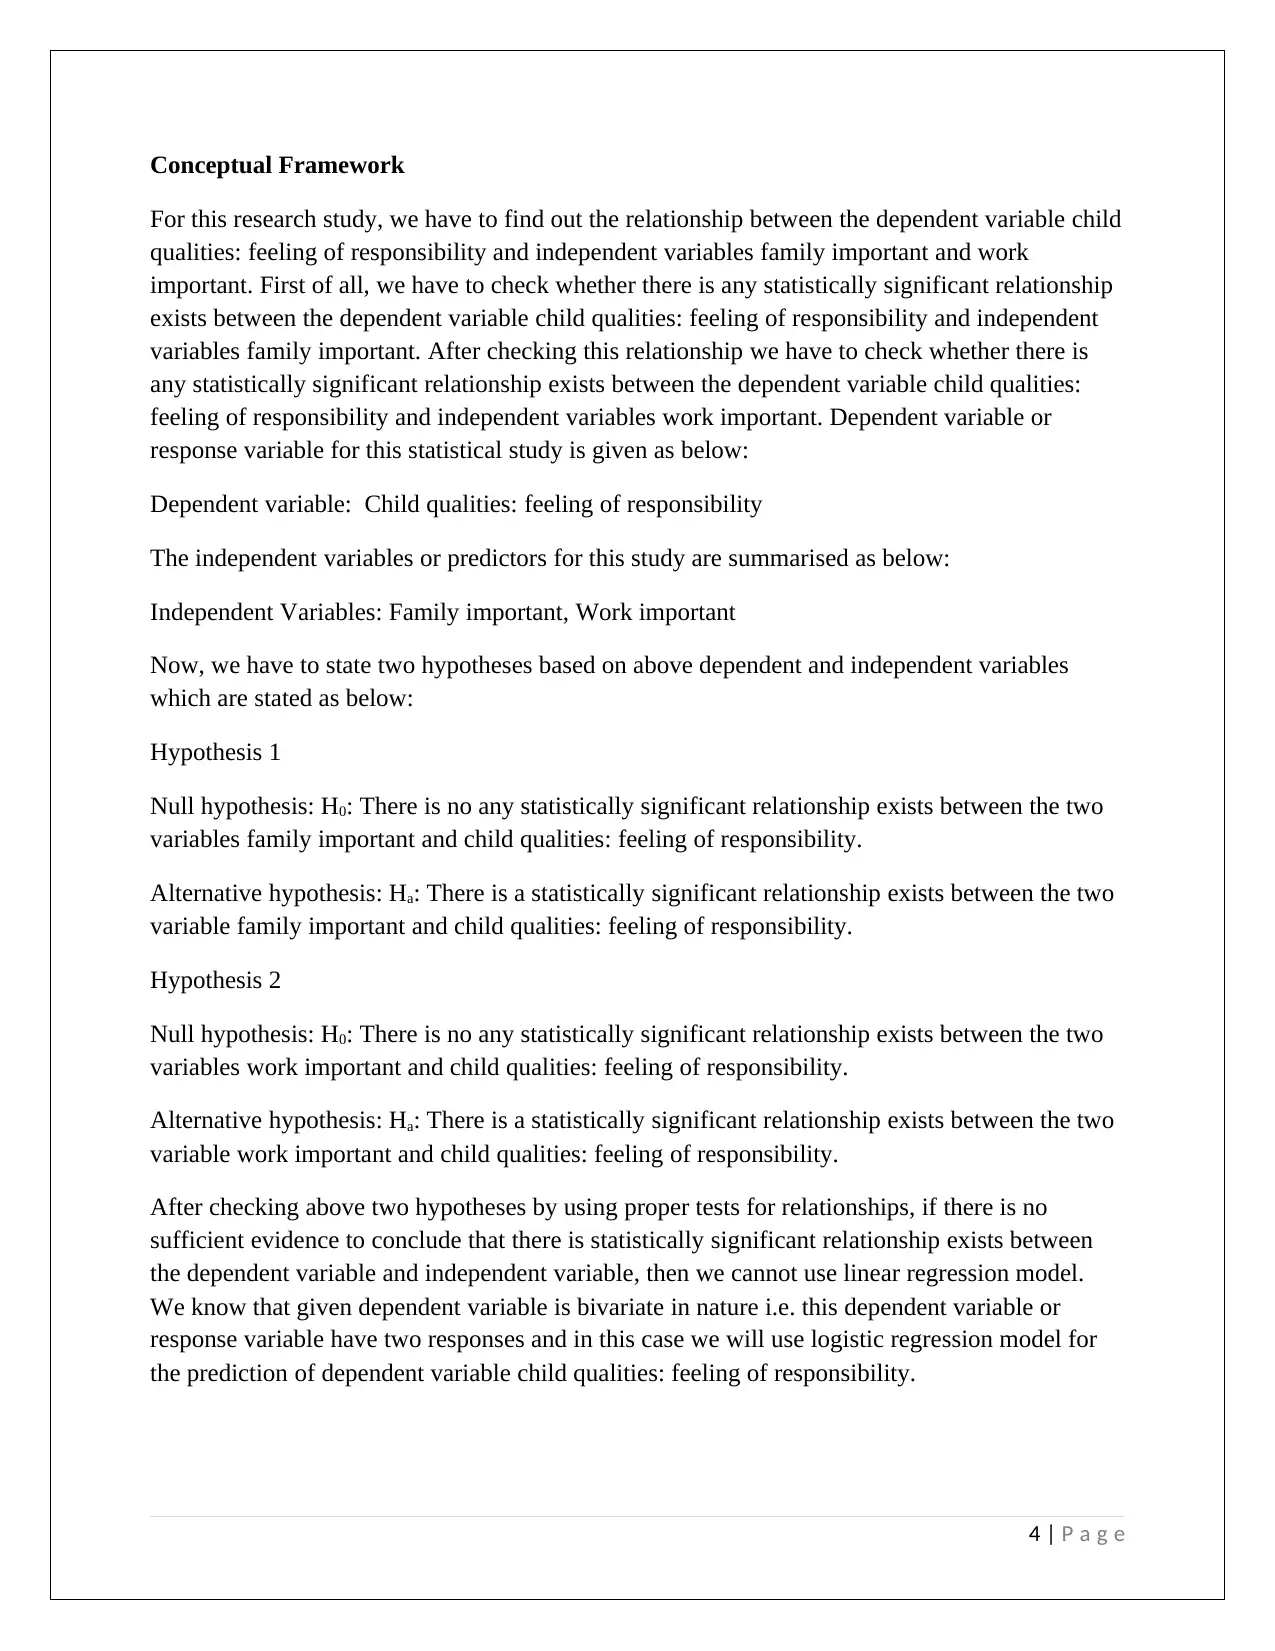
Conceptual Framework
For this research study, we have to find out the relationship between the dependent variable child
qualities: feeling of responsibility and independent variables family important and work
important. First of all, we have to check whether there is any statistically significant relationship
exists between the dependent variable child qualities: feeling of responsibility and independent
variables family important. After checking this relationship we have to check whether there is
any statistically significant relationship exists between the dependent variable child qualities:
feeling of responsibility and independent variables work important. Dependent variable or
response variable for this statistical study is given as below:
Dependent variable: Child qualities: feeling of responsibility
The independent variables or predictors for this study are summarised as below:
Independent Variables: Family important, Work important
Now, we have to state two hypotheses based on above dependent and independent variables
which are stated as below:
Hypothesis 1
Null hypothesis: H0: There is no any statistically significant relationship exists between the two
variables family important and child qualities: feeling of responsibility.
Alternative hypothesis: Ha: There is a statistically significant relationship exists between the two
variable family important and child qualities: feeling of responsibility.
Hypothesis 2
Null hypothesis: H0: There is no any statistically significant relationship exists between the two
variables work important and child qualities: feeling of responsibility.
Alternative hypothesis: Ha: There is a statistically significant relationship exists between the two
variable work important and child qualities: feeling of responsibility.
After checking above two hypotheses by using proper tests for relationships, if there is no
sufficient evidence to conclude that there is statistically significant relationship exists between
the dependent variable and independent variable, then we cannot use linear regression model.
We know that given dependent variable is bivariate in nature i.e. this dependent variable or
response variable have two responses and in this case we will use logistic regression model for
the prediction of dependent variable child qualities: feeling of responsibility.
4 | P a g e
Paraphrase This Document
Need a fresh take? Get an instant paraphrase of this document with our AI Paraphraser
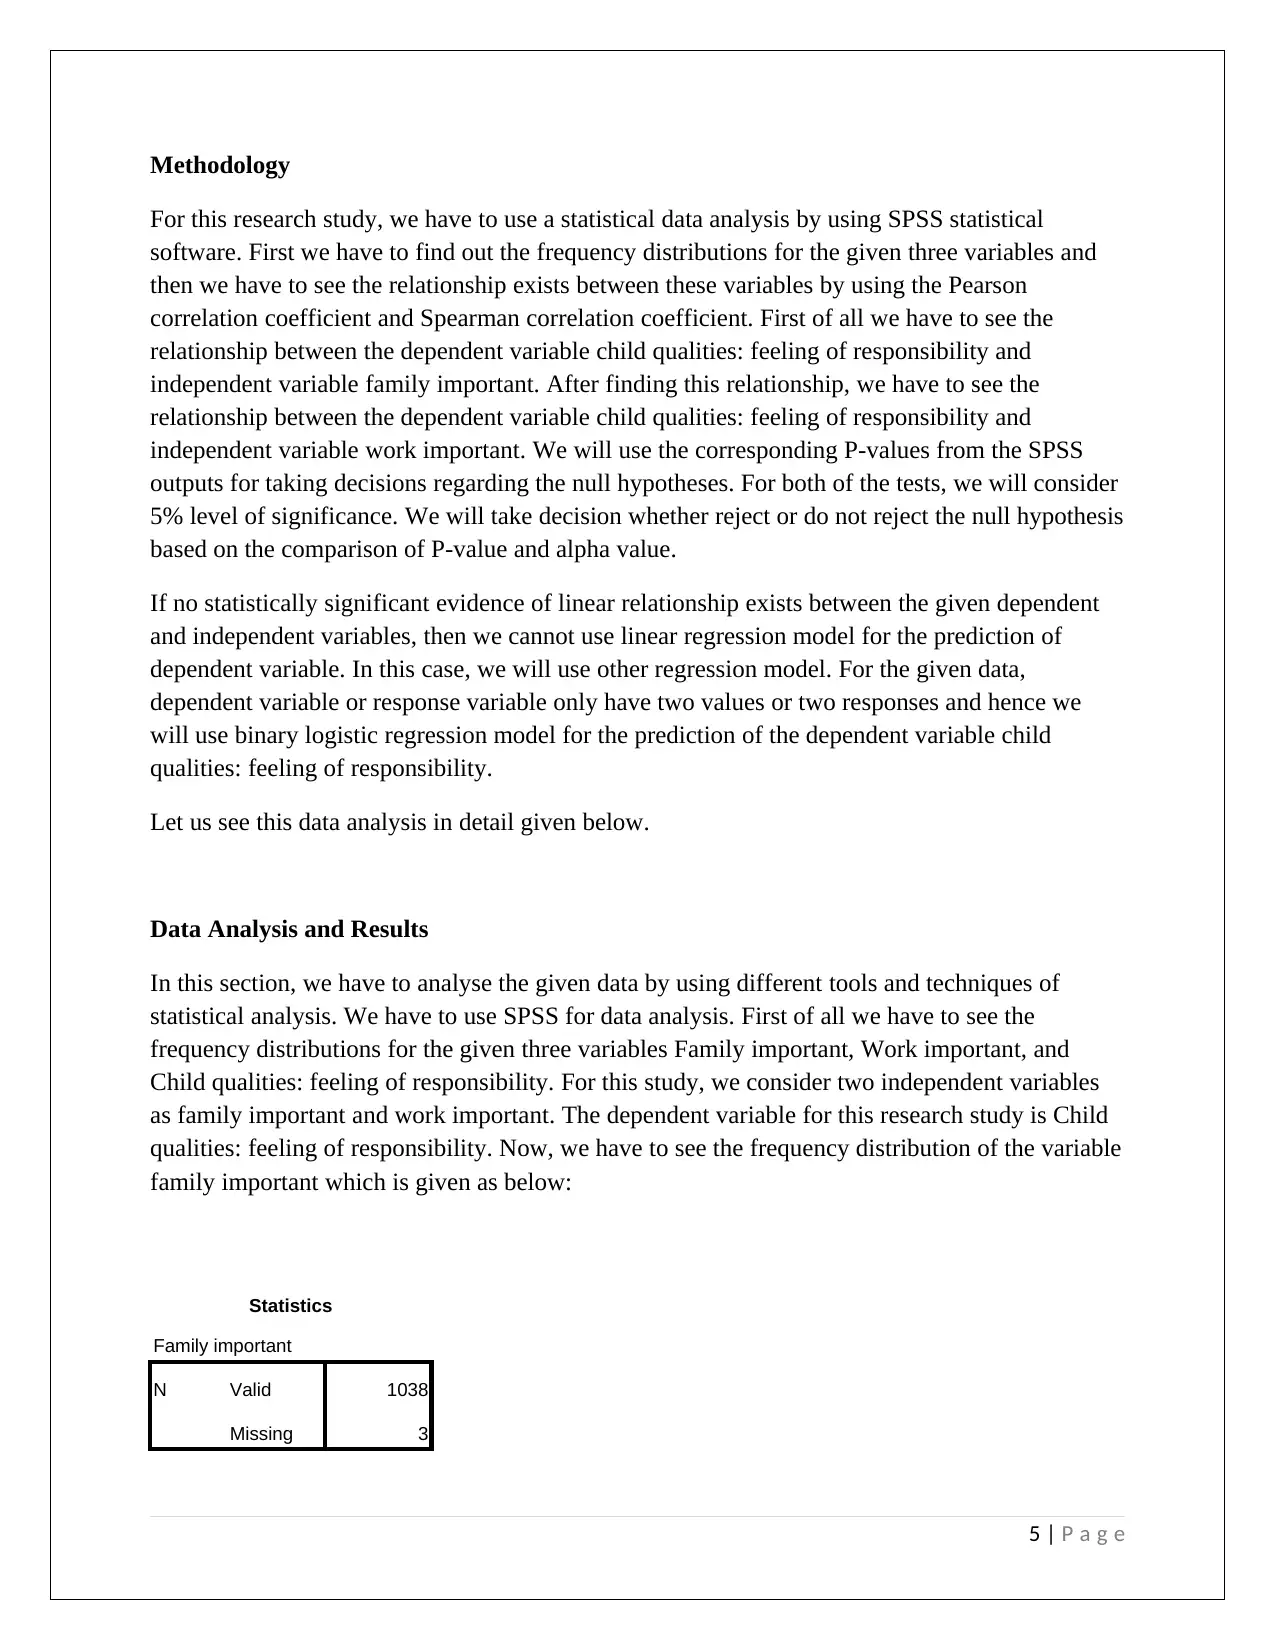
Methodology
For this research study, we have to use a statistical data analysis by using SPSS statistical
software. First we have to find out the frequency distributions for the given three variables and
then we have to see the relationship exists between these variables by using the Pearson
correlation coefficient and Spearman correlation coefficient. First of all we have to see the
relationship between the dependent variable child qualities: feeling of responsibility and
independent variable family important. After finding this relationship, we have to see the
relationship between the dependent variable child qualities: feeling of responsibility and
independent variable work important. We will use the corresponding P-values from the SPSS
outputs for taking decisions regarding the null hypotheses. For both of the tests, we will consider
5% level of significance. We will take decision whether reject or do not reject the null hypothesis
based on the comparison of P-value and alpha value.
If no statistically significant evidence of linear relationship exists between the given dependent
and independent variables, then we cannot use linear regression model for the prediction of
dependent variable. In this case, we will use other regression model. For the given data,
dependent variable or response variable only have two values or two responses and hence we
will use binary logistic regression model for the prediction of the dependent variable child
qualities: feeling of responsibility.
Let us see this data analysis in detail given below.
Data Analysis and Results
In this section, we have to analyse the given data by using different tools and techniques of
statistical analysis. We have to use SPSS for data analysis. First of all we have to see the
frequency distributions for the given three variables Family important, Work important, and
Child qualities: feeling of responsibility. For this study, we consider two independent variables
as family important and work important. The dependent variable for this research study is Child
qualities: feeling of responsibility. Now, we have to see the frequency distribution of the variable
family important which is given as below:
Statistics
Family important
N Valid 1038
Missing 3
5 | P a g e
Family important
Frequency Percent Valid Percent
Cumulative
Percent
Valid Very important 981 94.2 94.5 94.5
Rather important 44 4.2 4.2 98.7
Not very important 10 1.0 1.0 99.7
Not at all important 3 .3 .3 100.0
Total 1038 99.7 100.0
Missing Missing; Not asked by the
interviewer
2 .2
No answer 1 .1
Total 3 .3
Total 1041 100.0
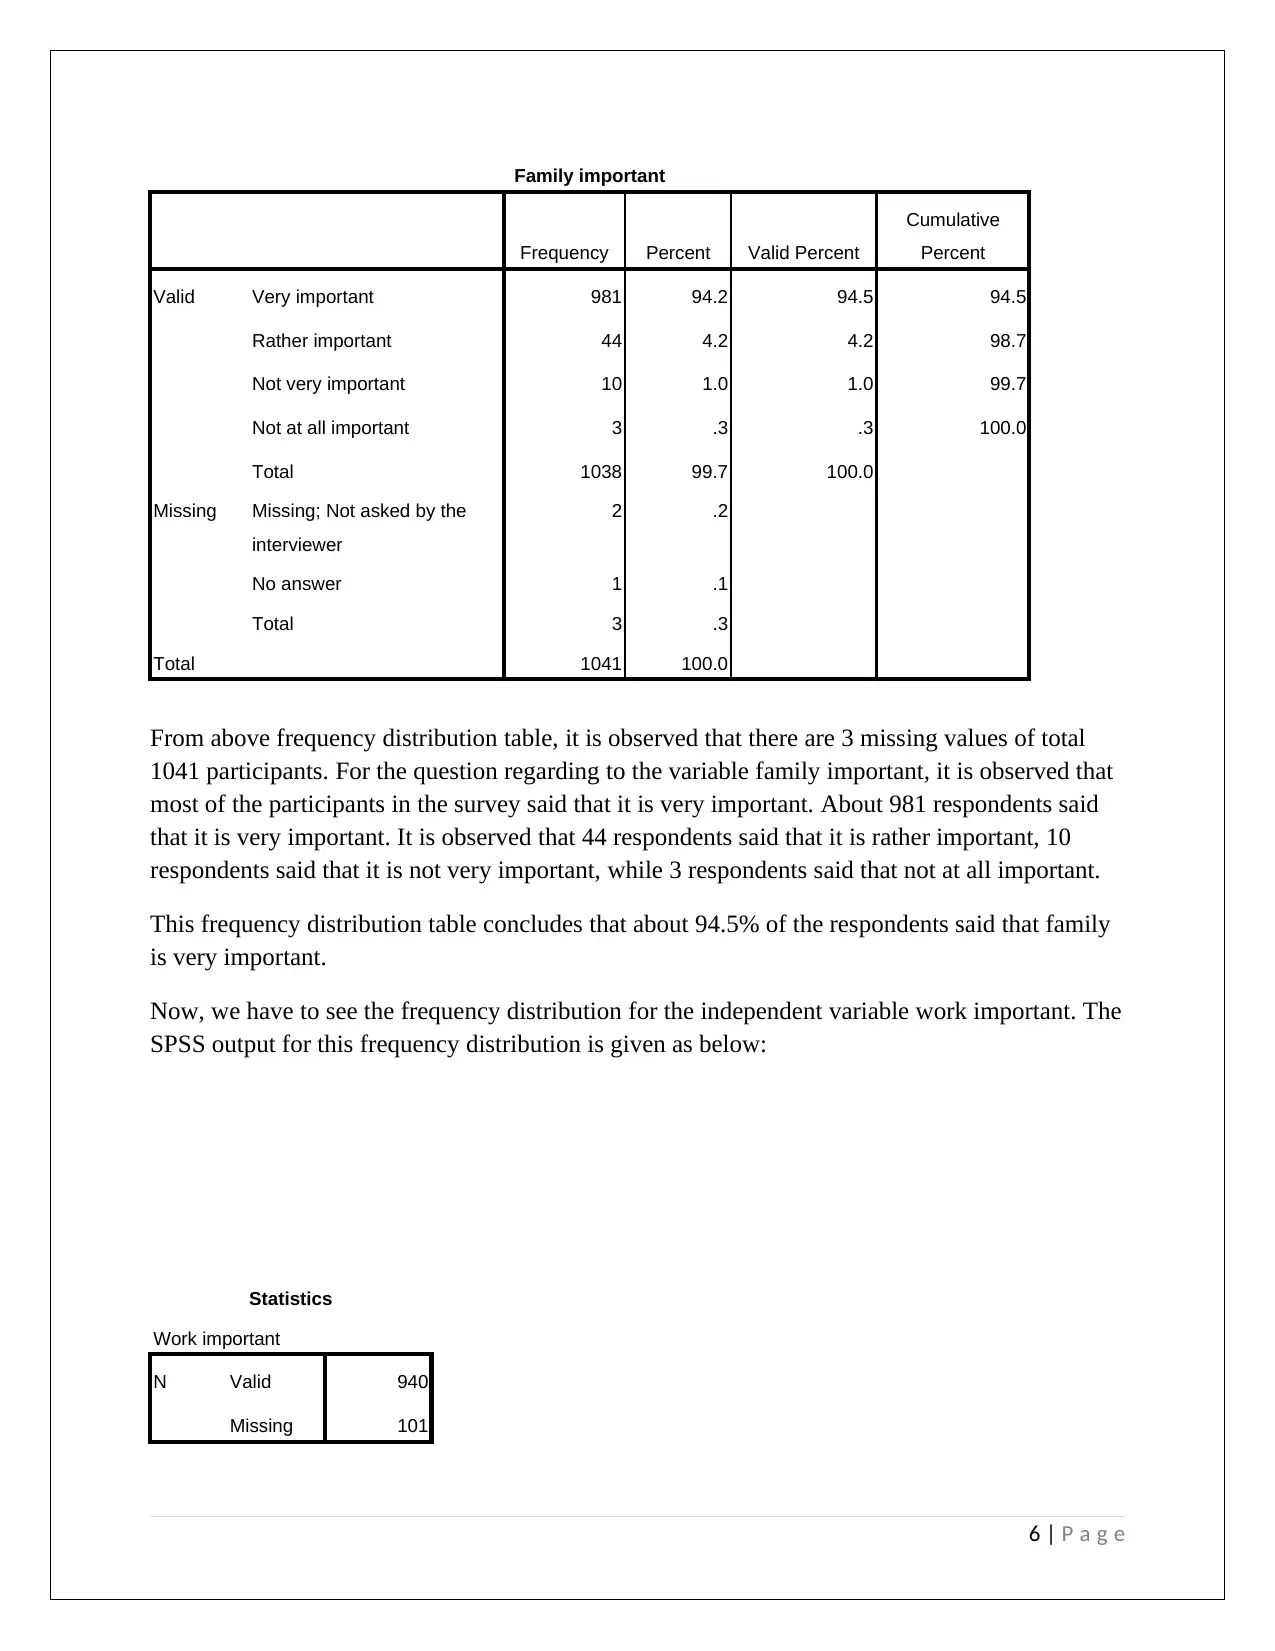
From above frequency distribution table, it is observed that there are 3 missing values of total
1041 participants. For the question regarding to the variable family important, it is observed that
most of the participants in the survey said that it is very important. About 981 respondents said
that it is very important. It is observed that 44 respondents said that it is rather important, 10
respondents said that it is not very important, while 3 respondents said that not at all important.
This frequency distribution table concludes that about 94.5% of the respondents said that family
is very important.
Now, we have to see the frequency distribution for the independent variable work important. The
SPSS output for this frequency distribution is given as below:
Statistics
Work important
N Valid 940
Missing 101
6 | P a g e
Frequency Percent Valid Percent
Cumulative
Percent
Valid Very important 981 94.2 94.5 94.5
Rather important 44 4.2 4.2 98.7
Not very important 10 1.0 1.0 99.7
Not at all important 3 .3 .3 100.0
Total 1038 99.7 100.0
Missing Missing; Not asked by the
interviewer
2 .2
No answer 1 .1
Total 3 .3
Total 1041 100.0
From above frequency distribution table, it is observed that there are 3 missing values of total
1041 participants. For the question regarding to the variable family important, it is observed that
most of the participants in the survey said that it is very important. About 981 respondents said
that it is very important. It is observed that 44 respondents said that it is rather important, 10
respondents said that it is not very important, while 3 respondents said that not at all important.
This frequency distribution table concludes that about 94.5% of the respondents said that family
is very important.
Now, we have to see the frequency distribution for the independent variable work important. The
SPSS output for this frequency distribution is given as below:
Statistics
Work important
N Valid 940
Missing 101
6 | P a g e
⊘ This is a preview!⊘
Do you want full access?
Subscribe today to unlock all pages.
Trusted by 1+ million students worldwide
Work important
Frequency Percent Valid Percent
Cumulative
Percent
Valid Very important 353 33.9 37.6 37.6
Rather important 365 35.1 38.8 76.4
Not very important 108 10.4 11.5 87.9
Not at all important 114 11.0 12.1 100.0
Total 940 90.3 100.0
Missing Missing; Not asked by the
interviewer
98 9.4
No answer 2 .2
Don´t know 1 .1
Total 101 9.7
Total 1041 100.0
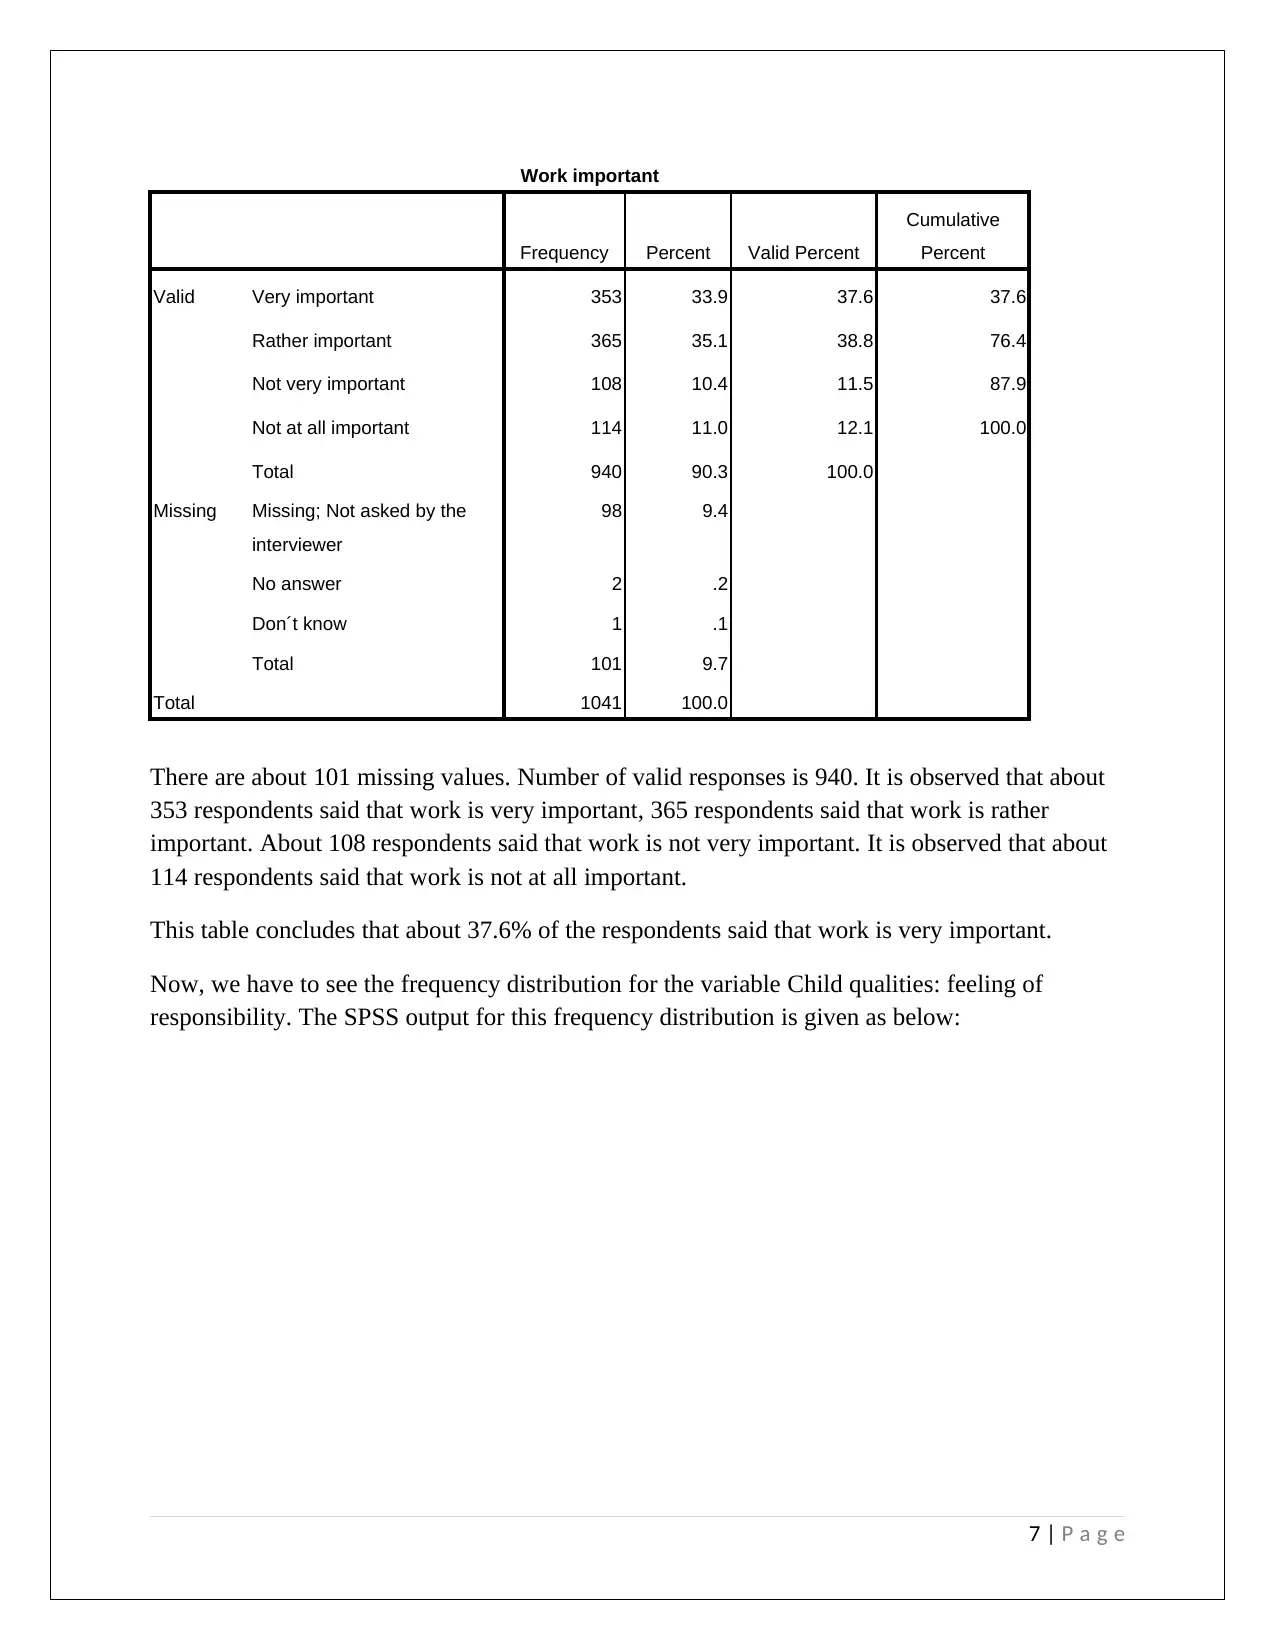
There are about 101 missing values. Number of valid responses is 940. It is observed that about
353 respondents said that work is very important, 365 respondents said that work is rather
important. About 108 respondents said that work is not very important. It is observed that about
114 respondents said that work is not at all important.
This table concludes that about 37.6% of the respondents said that work is very important.
Now, we have to see the frequency distribution for the variable Child qualities: feeling of
responsibility. The SPSS output for this frequency distribution is given as below:
7 | P a g e
Frequency Percent Valid Percent
Cumulative
Percent
Valid Very important 353 33.9 37.6 37.6
Rather important 365 35.1 38.8 76.4
Not very important 108 10.4 11.5 87.9
Not at all important 114 11.0 12.1 100.0
Total 940 90.3 100.0
Missing Missing; Not asked by the
interviewer
98 9.4
No answer 2 .2
Don´t know 1 .1
Total 101 9.7
Total 1041 100.0
There are about 101 missing values. Number of valid responses is 940. It is observed that about
353 respondents said that work is very important, 365 respondents said that work is rather
important. About 108 respondents said that work is not very important. It is observed that about
114 respondents said that work is not at all important.
This table concludes that about 37.6% of the respondents said that work is very important.
Now, we have to see the frequency distribution for the variable Child qualities: feeling of
responsibility. The SPSS output for this frequency distribution is given as below:
7 | P a g e
Paraphrase This Document
Need a fresh take? Get an instant paraphrase of this document with our AI Paraphraser
Statistics
Child qualities: feeling of
responsibility
N Valid 1041
Missing 0
Child qualities: feeling of responsibility
Frequency Percent Valid Percent
Cumulative
Percent
Valid Mentioned 626 60.1 60.1 60.1
Not mentioned 415 39.9 39.9 100.0
Total 1041 100.0 100.0
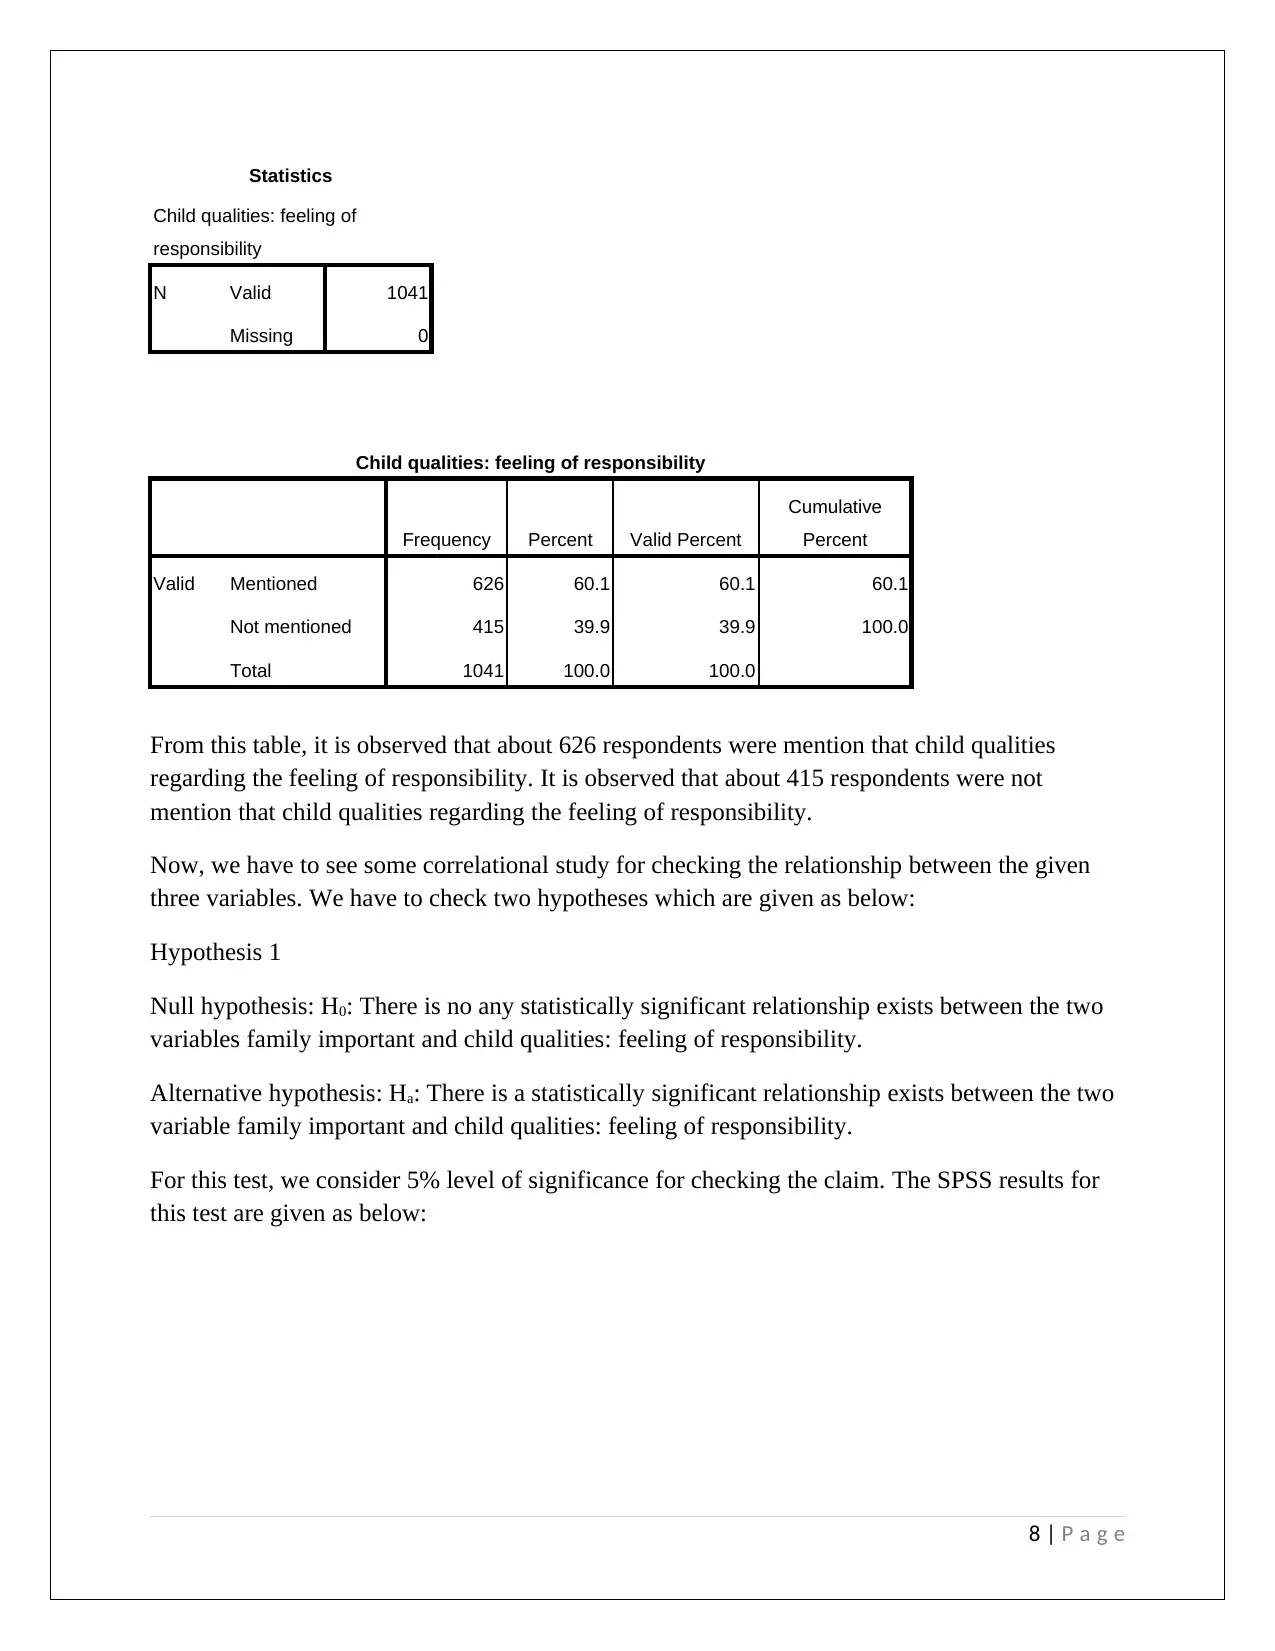
From this table, it is observed that about 626 respondents were mention that child qualities
regarding the feeling of responsibility. It is observed that about 415 respondents were not
mention that child qualities regarding the feeling of responsibility.
Now, we have to see some correlational study for checking the relationship between the given
three variables. We have to check two hypotheses which are given as below:
Hypothesis 1
Null hypothesis: H0: There is no any statistically significant relationship exists between the two
variables family important and child qualities: feeling of responsibility.
Alternative hypothesis: Ha: There is a statistically significant relationship exists between the two
variable family important and child qualities: feeling of responsibility.
For this test, we consider 5% level of significance for checking the claim. The SPSS results for
this test are given as below:
8 | P a g e
Child qualities: feeling of
responsibility
N Valid 1041
Missing 0
Child qualities: feeling of responsibility
Frequency Percent Valid Percent
Cumulative
Percent
Valid Mentioned 626 60.1 60.1 60.1
Not mentioned 415 39.9 39.9 100.0
Total 1041 100.0 100.0
From this table, it is observed that about 626 respondents were mention that child qualities
regarding the feeling of responsibility. It is observed that about 415 respondents were not
mention that child qualities regarding the feeling of responsibility.
Now, we have to see some correlational study for checking the relationship between the given
three variables. We have to check two hypotheses which are given as below:
Hypothesis 1
Null hypothesis: H0: There is no any statistically significant relationship exists between the two
variables family important and child qualities: feeling of responsibility.
Alternative hypothesis: Ha: There is a statistically significant relationship exists between the two
variable family important and child qualities: feeling of responsibility.
For this test, we consider 5% level of significance for checking the claim. The SPSS results for
this test are given as below:
8 | P a g e
Correlations
Family important
Child qualities:
feeling of
responsibility
Family important Pearson Correlation 1 .024
Sig. (2-tailed) .441
N 1038 1038
Child qualities: feeling of
responsibility
Pearson Correlation .024 1
Sig. (2-tailed) .441
N 1038 1041
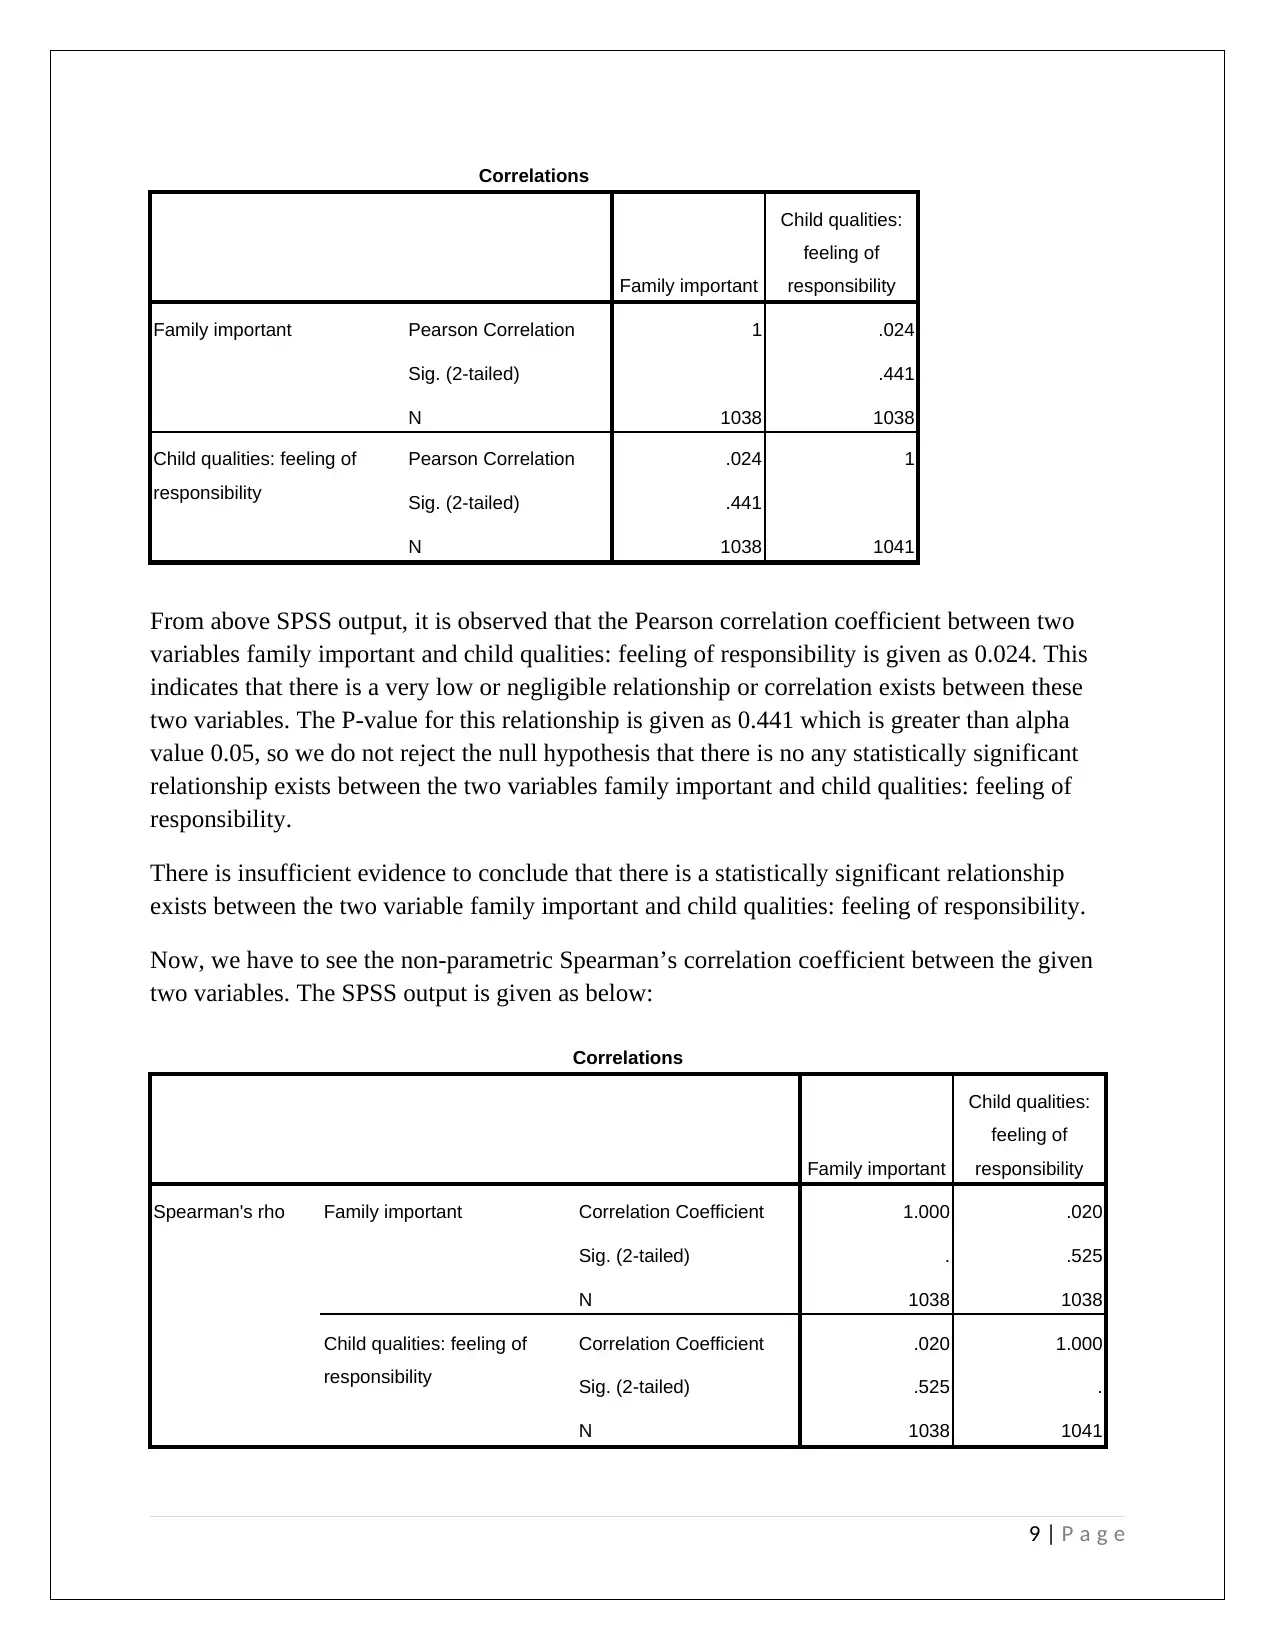
From above SPSS output, it is observed that the Pearson correlation coefficient between two
variables family important and child qualities: feeling of responsibility is given as 0.024. This
indicates that there is a very low or negligible relationship or correlation exists between these
two variables. The P-value for this relationship is given as 0.441 which is greater than alpha
value 0.05, so we do not reject the null hypothesis that there is no any statistically significant
relationship exists between the two variables family important and child qualities: feeling of
responsibility.
There is insufficient evidence to conclude that there is a statistically significant relationship
exists between the two variable family important and child qualities: feeling of responsibility.
Now, we have to see the non-parametric Spearman’s correlation coefficient between the given
two variables. The SPSS output is given as below:
Correlations
Family important
Child qualities:
feeling of
responsibility
Spearman's rho Family important Correlation Coefficient 1.000 .020
Sig. (2-tailed) . .525
N 1038 1038
Child qualities: feeling of
responsibility
Correlation Coefficient .020 1.000
Sig. (2-tailed) .525 .
N 1038 1041
9 | P a g e
Family important
Child qualities:
feeling of
responsibility
Family important Pearson Correlation 1 .024
Sig. (2-tailed) .441
N 1038 1038
Child qualities: feeling of
responsibility
Pearson Correlation .024 1
Sig. (2-tailed) .441
N 1038 1041
From above SPSS output, it is observed that the Pearson correlation coefficient between two
variables family important and child qualities: feeling of responsibility is given as 0.024. This
indicates that there is a very low or negligible relationship or correlation exists between these
two variables. The P-value for this relationship is given as 0.441 which is greater than alpha
value 0.05, so we do not reject the null hypothesis that there is no any statistically significant
relationship exists between the two variables family important and child qualities: feeling of
responsibility.
There is insufficient evidence to conclude that there is a statistically significant relationship
exists between the two variable family important and child qualities: feeling of responsibility.
Now, we have to see the non-parametric Spearman’s correlation coefficient between the given
two variables. The SPSS output is given as below:
Correlations
Family important
Child qualities:
feeling of
responsibility
Spearman's rho Family important Correlation Coefficient 1.000 .020
Sig. (2-tailed) . .525
N 1038 1038
Child qualities: feeling of
responsibility
Correlation Coefficient .020 1.000
Sig. (2-tailed) .525 .
N 1038 1041
9 | P a g e
⊘ This is a preview!⊘
Do you want full access?
Subscribe today to unlock all pages.
Trusted by 1+ million students worldwide
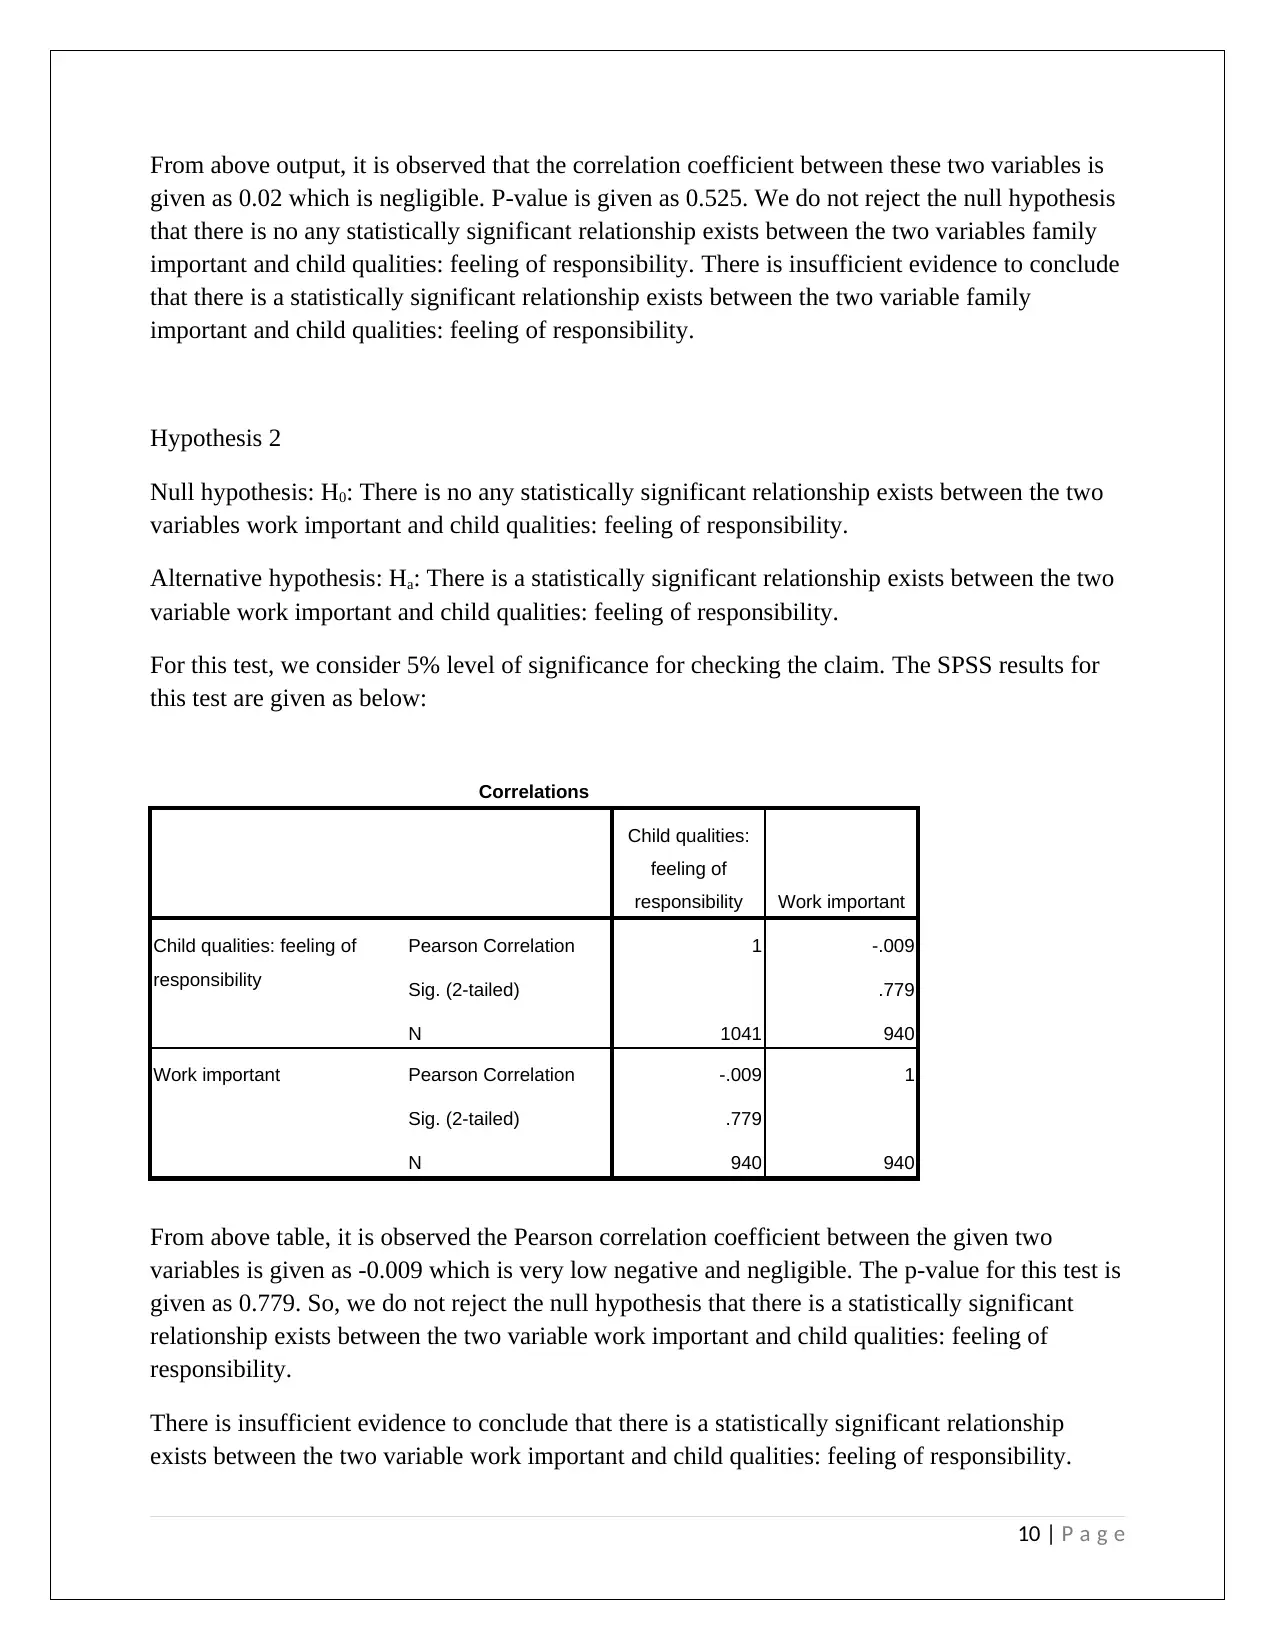
From above output, it is observed that the correlation coefficient between these two variables is
given as 0.02 which is negligible. P-value is given as 0.525. We do not reject the null hypothesis
that there is no any statistically significant relationship exists between the two variables family
important and child qualities: feeling of responsibility. There is insufficient evidence to conclude
that there is a statistically significant relationship exists between the two variable family
important and child qualities: feeling of responsibility.
Hypothesis 2
Null hypothesis: H0: There is no any statistically significant relationship exists between the two
variables work important and child qualities: feeling of responsibility.
Alternative hypothesis: Ha: There is a statistically significant relationship exists between the two
variable work important and child qualities: feeling of responsibility.
For this test, we consider 5% level of significance for checking the claim. The SPSS results for
this test are given as below:
Correlations
Child qualities:
feeling of
responsibility Work important
Child qualities: feeling of
responsibility
Pearson Correlation 1 -.009
Sig. (2-tailed) .779
N 1041 940
Work important Pearson Correlation -.009 1
Sig. (2-tailed) .779
N 940 940
From above table, it is observed the Pearson correlation coefficient between the given two
variables is given as -0.009 which is very low negative and negligible. The p-value for this test is
given as 0.779. So, we do not reject the null hypothesis that there is a statistically significant
relationship exists between the two variable work important and child qualities: feeling of
responsibility.
There is insufficient evidence to conclude that there is a statistically significant relationship
exists between the two variable work important and child qualities: feeling of responsibility.
10 | P a g e
Paraphrase This Document
Need a fresh take? Get an instant paraphrase of this document with our AI Paraphraser
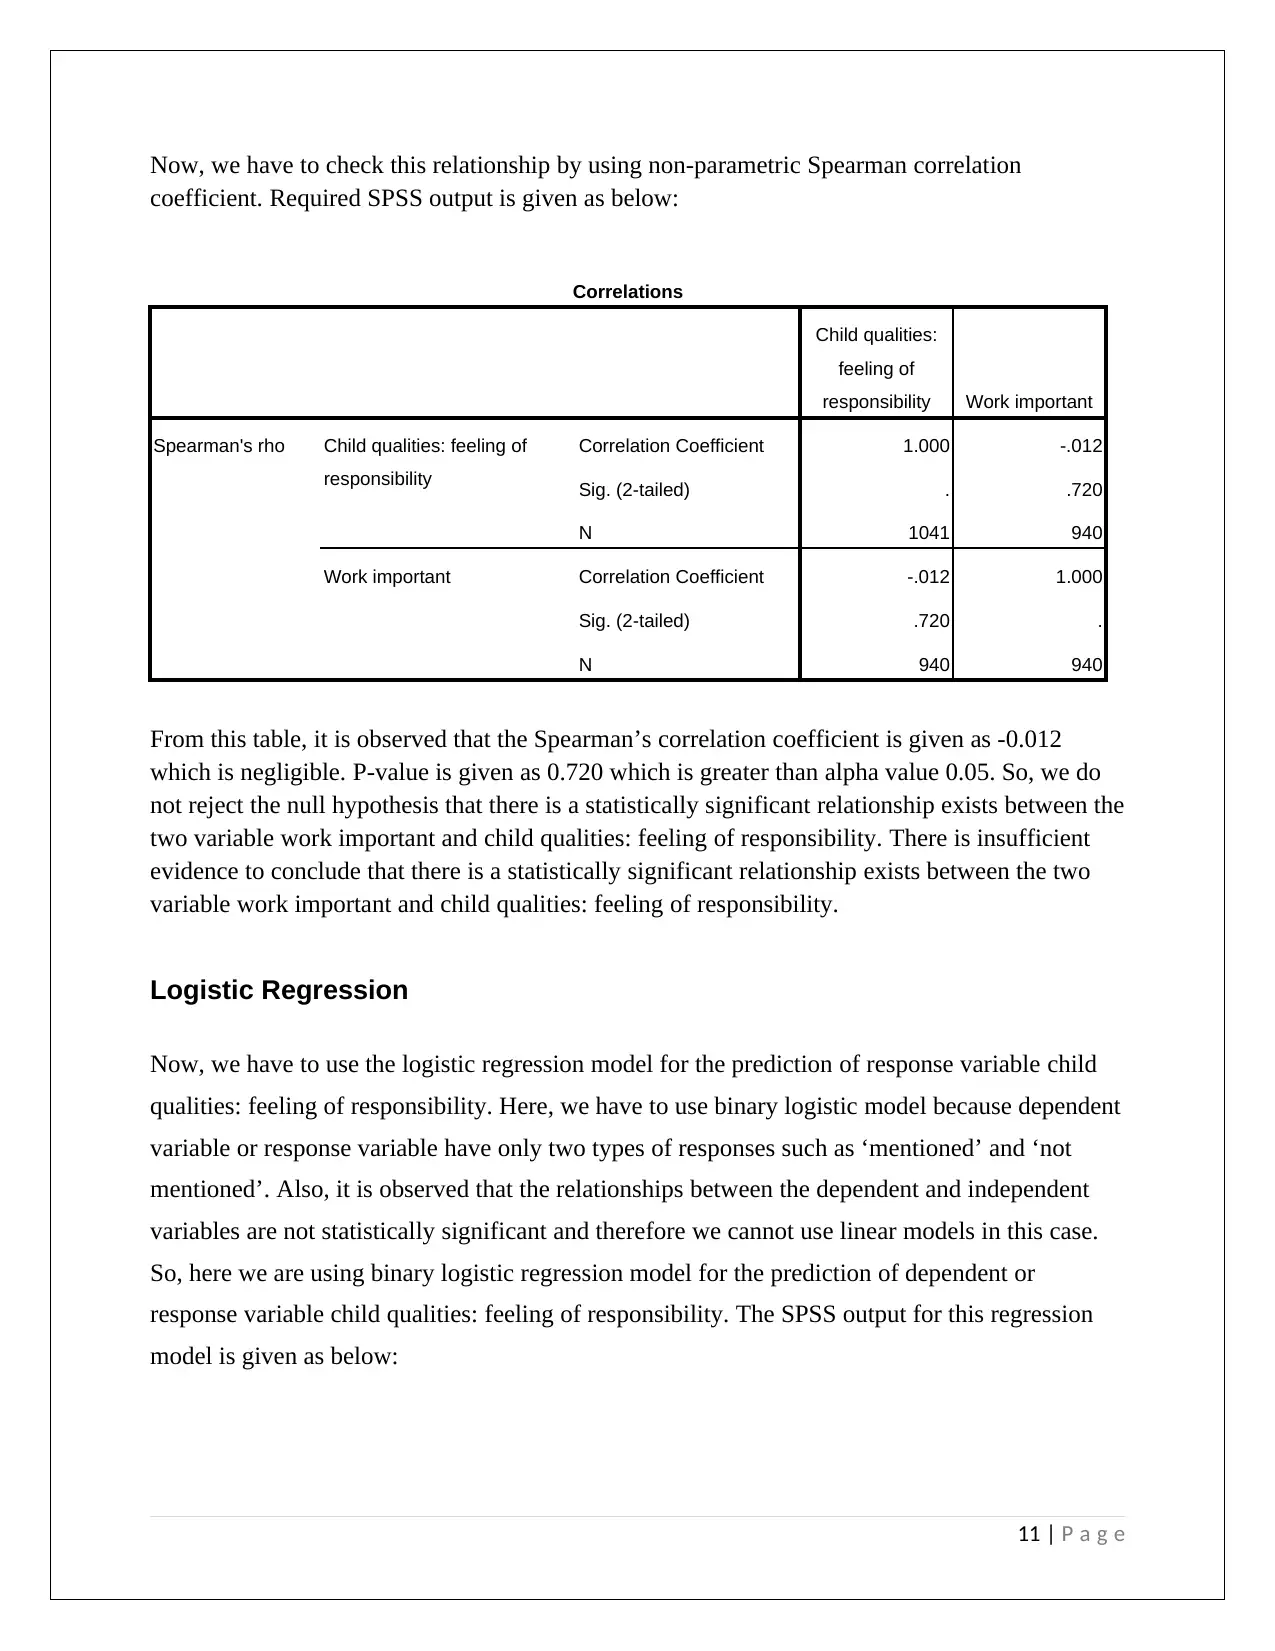
Now, we have to check this relationship by using non-parametric Spearman correlation
coefficient. Required SPSS output is given as below:
Correlations
Child qualities:
feeling of
responsibility Work important
Spearman's rho Child qualities: feeling of
responsibility
Correlation Coefficient 1.000 -.012
Sig. (2-tailed) . .720
N 1041 940
Work important Correlation Coefficient -.012 1.000
Sig. (2-tailed) .720 .
N 940 940
From this table, it is observed that the Spearman’s correlation coefficient is given as -0.012
which is negligible. P-value is given as 0.720 which is greater than alpha value 0.05. So, we do
not reject the null hypothesis that there is a statistically significant relationship exists between the
two variable work important and child qualities: feeling of responsibility. There is insufficient
evidence to conclude that there is a statistically significant relationship exists between the two
variable work important and child qualities: feeling of responsibility.
Logistic Regression
Now, we have to use the logistic regression model for the prediction of response variable child
qualities: feeling of responsibility. Here, we have to use binary logistic model because dependent
variable or response variable have only two types of responses such as ‘mentioned’ and ‘not
mentioned’. Also, it is observed that the relationships between the dependent and independent
variables are not statistically significant and therefore we cannot use linear models in this case.
So, here we are using binary logistic regression model for the prediction of dependent or
response variable child qualities: feeling of responsibility. The SPSS output for this regression
model is given as below:
11 | P a g e
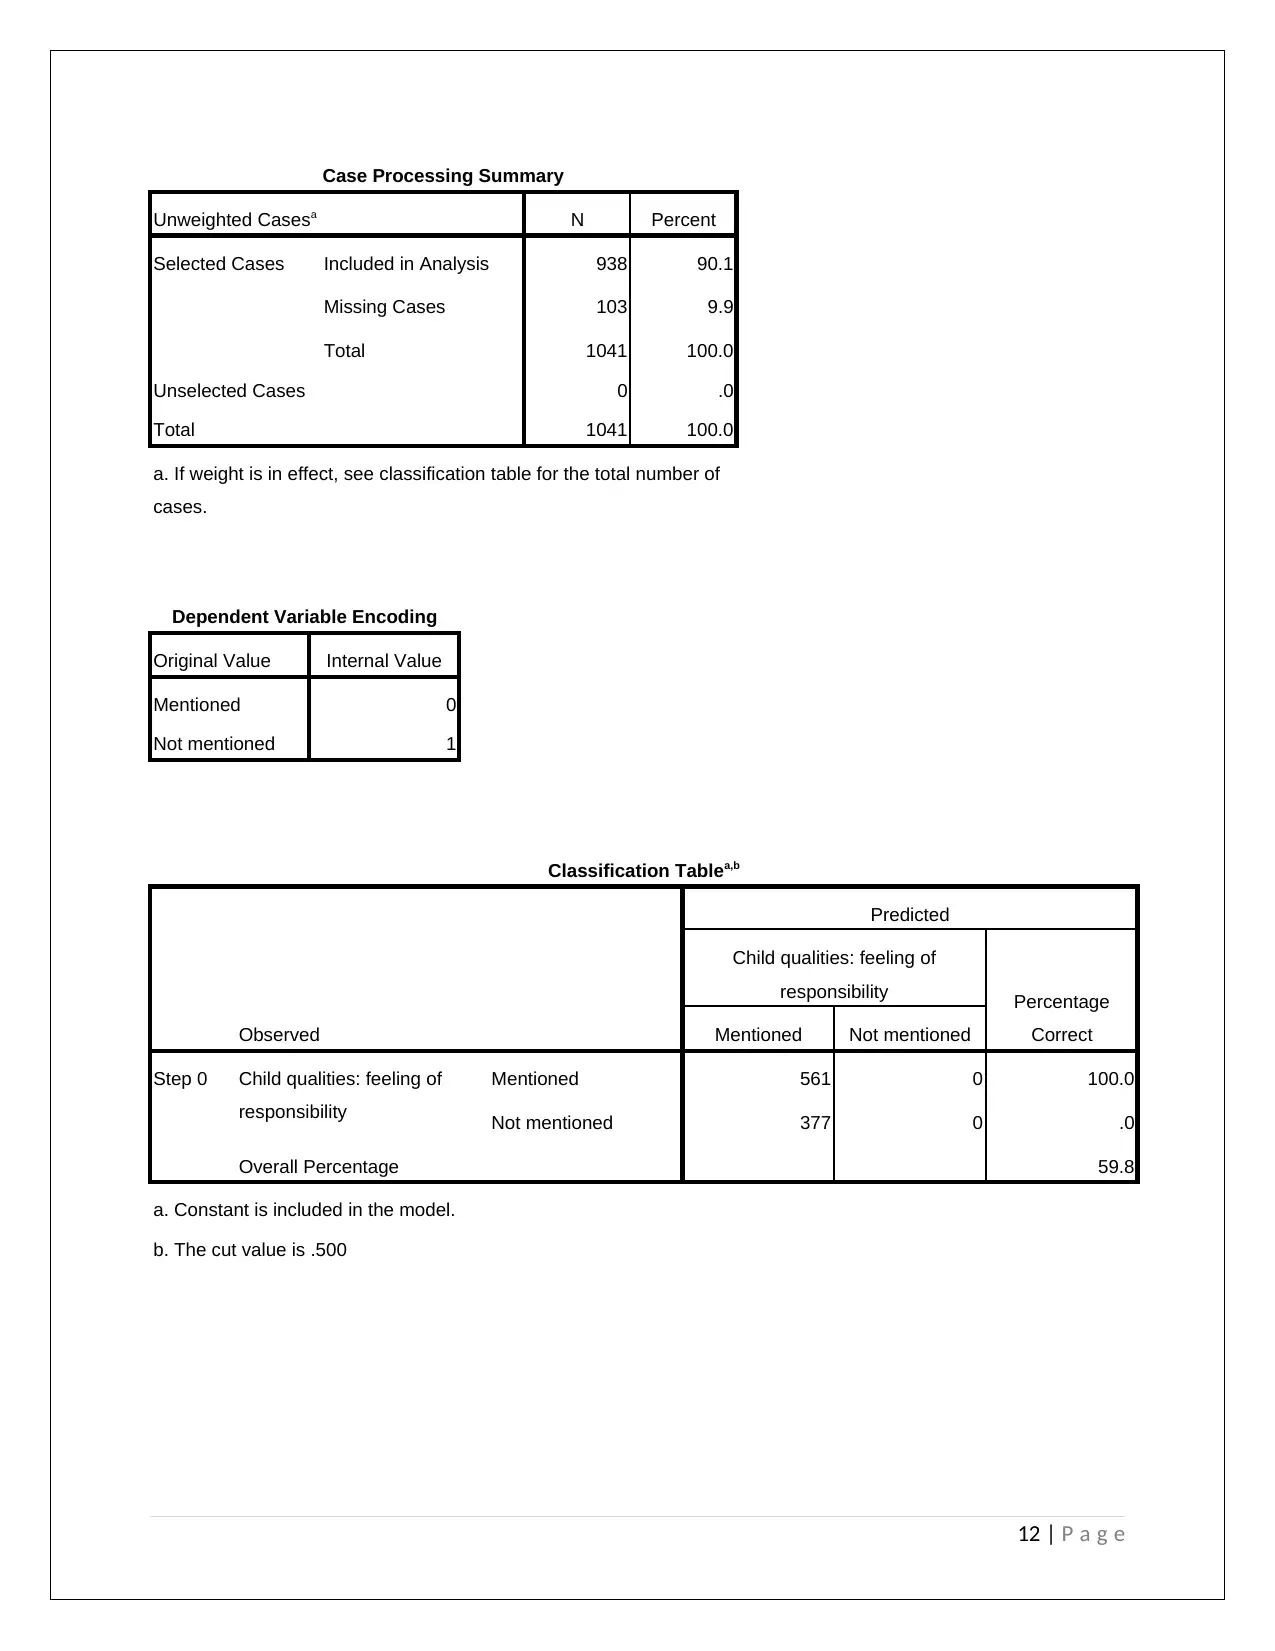
Case Processing Summary
Unweighted Casesa N Percent
Selected Cases Included in Analysis 938 90.1
Missing Cases 103 9.9
Total 1041 100.0
Unselected Cases 0 .0
Total 1041 100.0
a. If weight is in effect, see classification table for the total number of
cases.
Dependent Variable Encoding
Original Value Internal Value
Mentioned 0
Not mentioned 1
Classification Tablea,b
Observed
Predicted
Child qualities: feeling of
responsibility Percentage
CorrectMentioned Not mentioned
Step 0 Child qualities: feeling of
responsibility
Mentioned 561 0 100.0
Not mentioned 377 0 .0
Overall Percentage 59.8
a. Constant is included in the model.
b. The cut value is .500
12 | P a g e
⊘ This is a preview!⊘
Do you want full access?
Subscribe today to unlock all pages.
Trusted by 1+ million students worldwide
1 out of 15
Related Documents


Your All-in-One AI-Powered Toolkit for Academic Success.
+13062052269
info@desklib.com
Available 24*7 on WhatsApp / Email
![[object Object]](/_next/static/media/star-bottom.7253800d.svg)
Unlock your academic potential
Copyright © 2020–2026 A2Z Services. All Rights Reserved. Developed and managed by ZUCOL.