YouTube Data Analysis and Insights Report using Watson Analytics
VerifiedAdded on 2023/04/23
|23
|2411
|304
Report
AI Summary
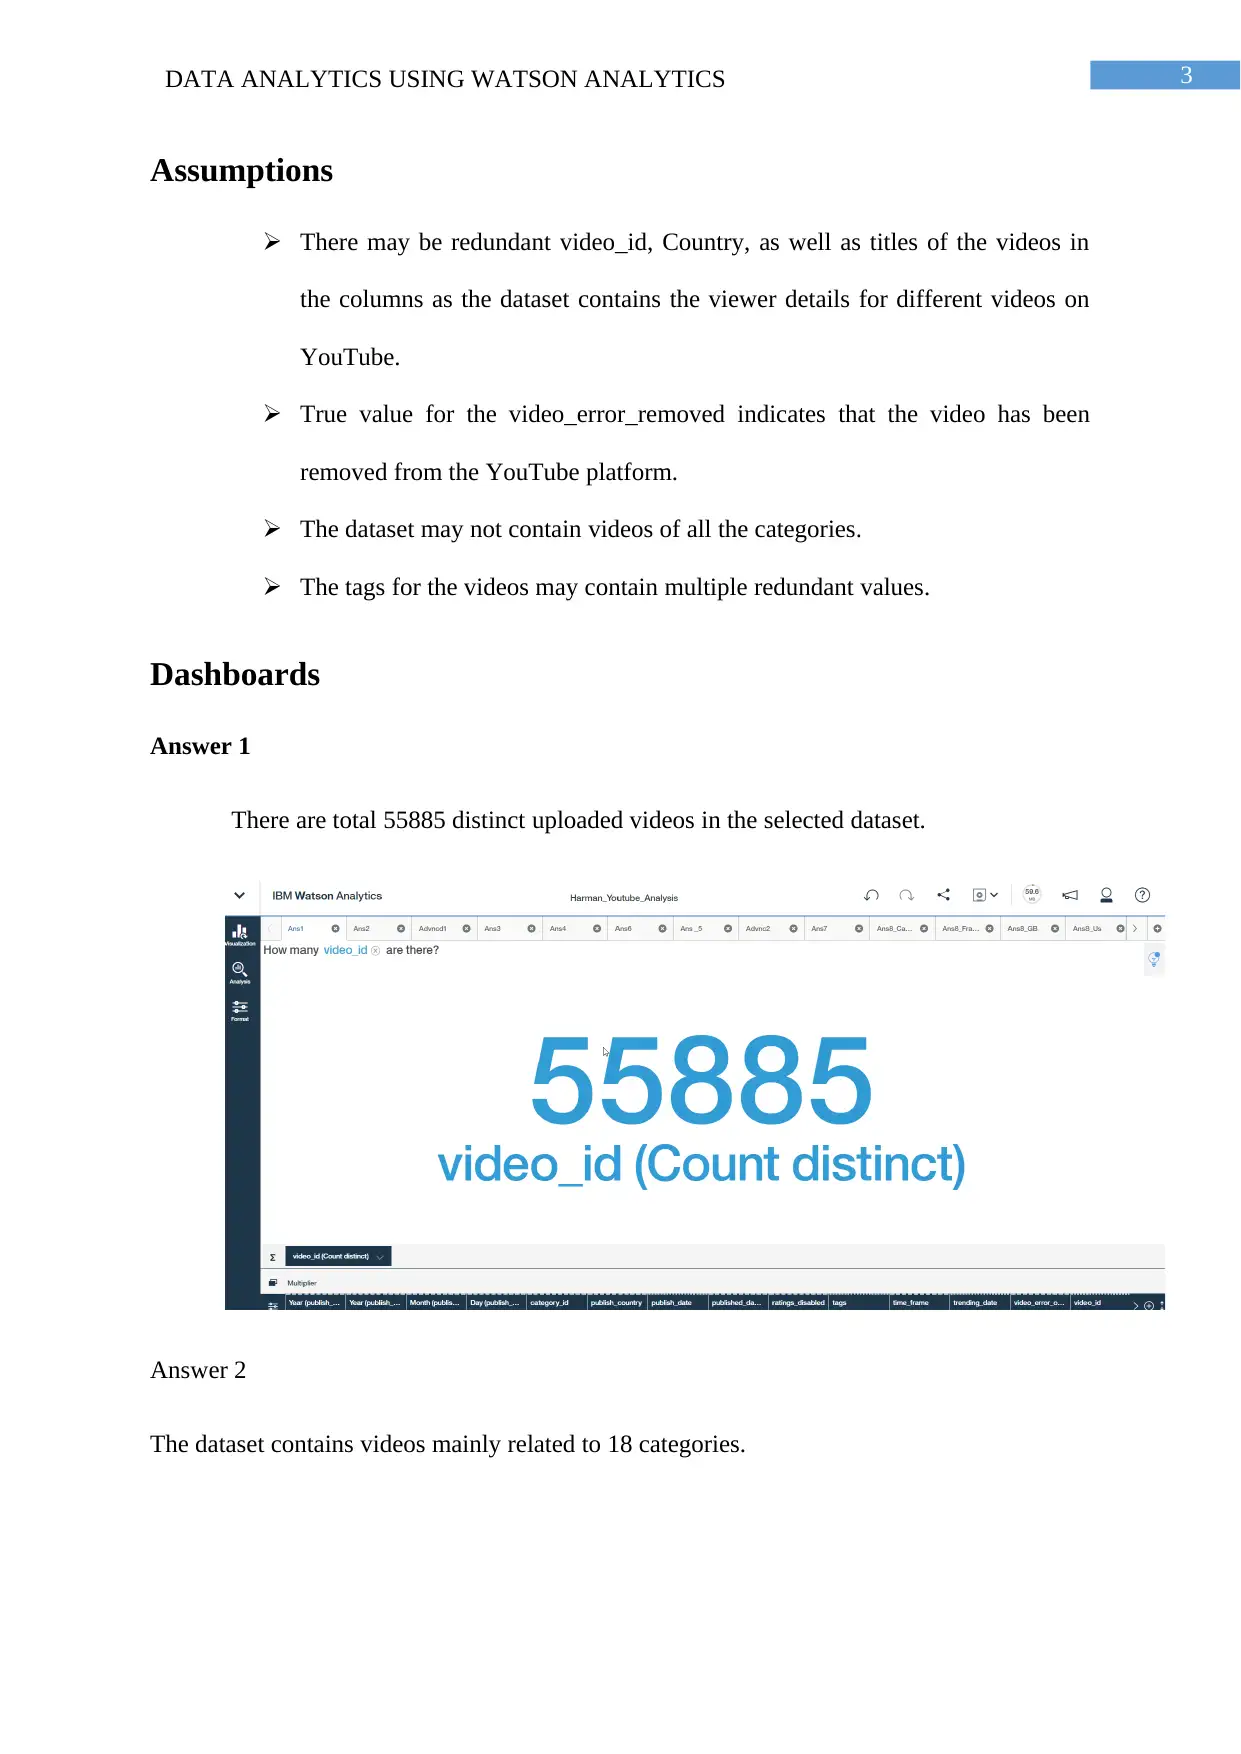
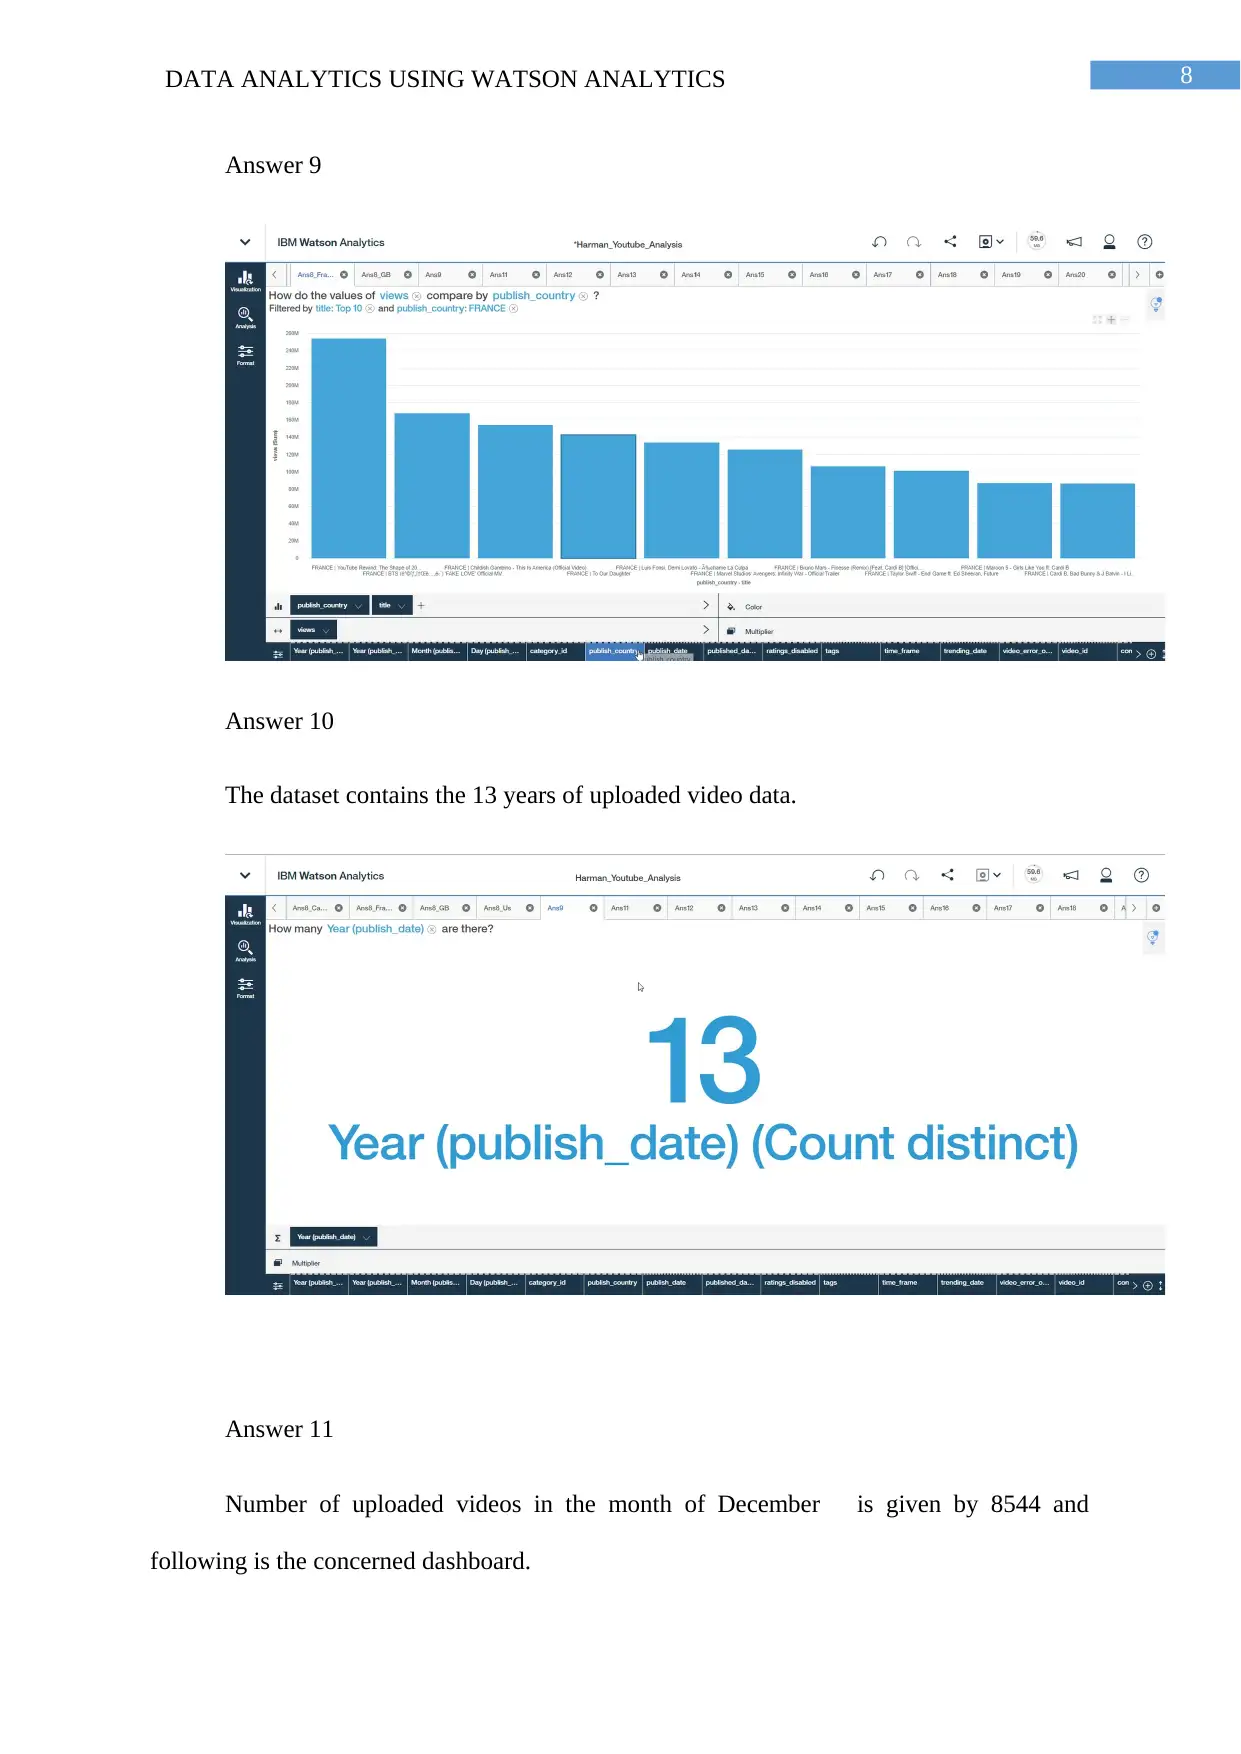
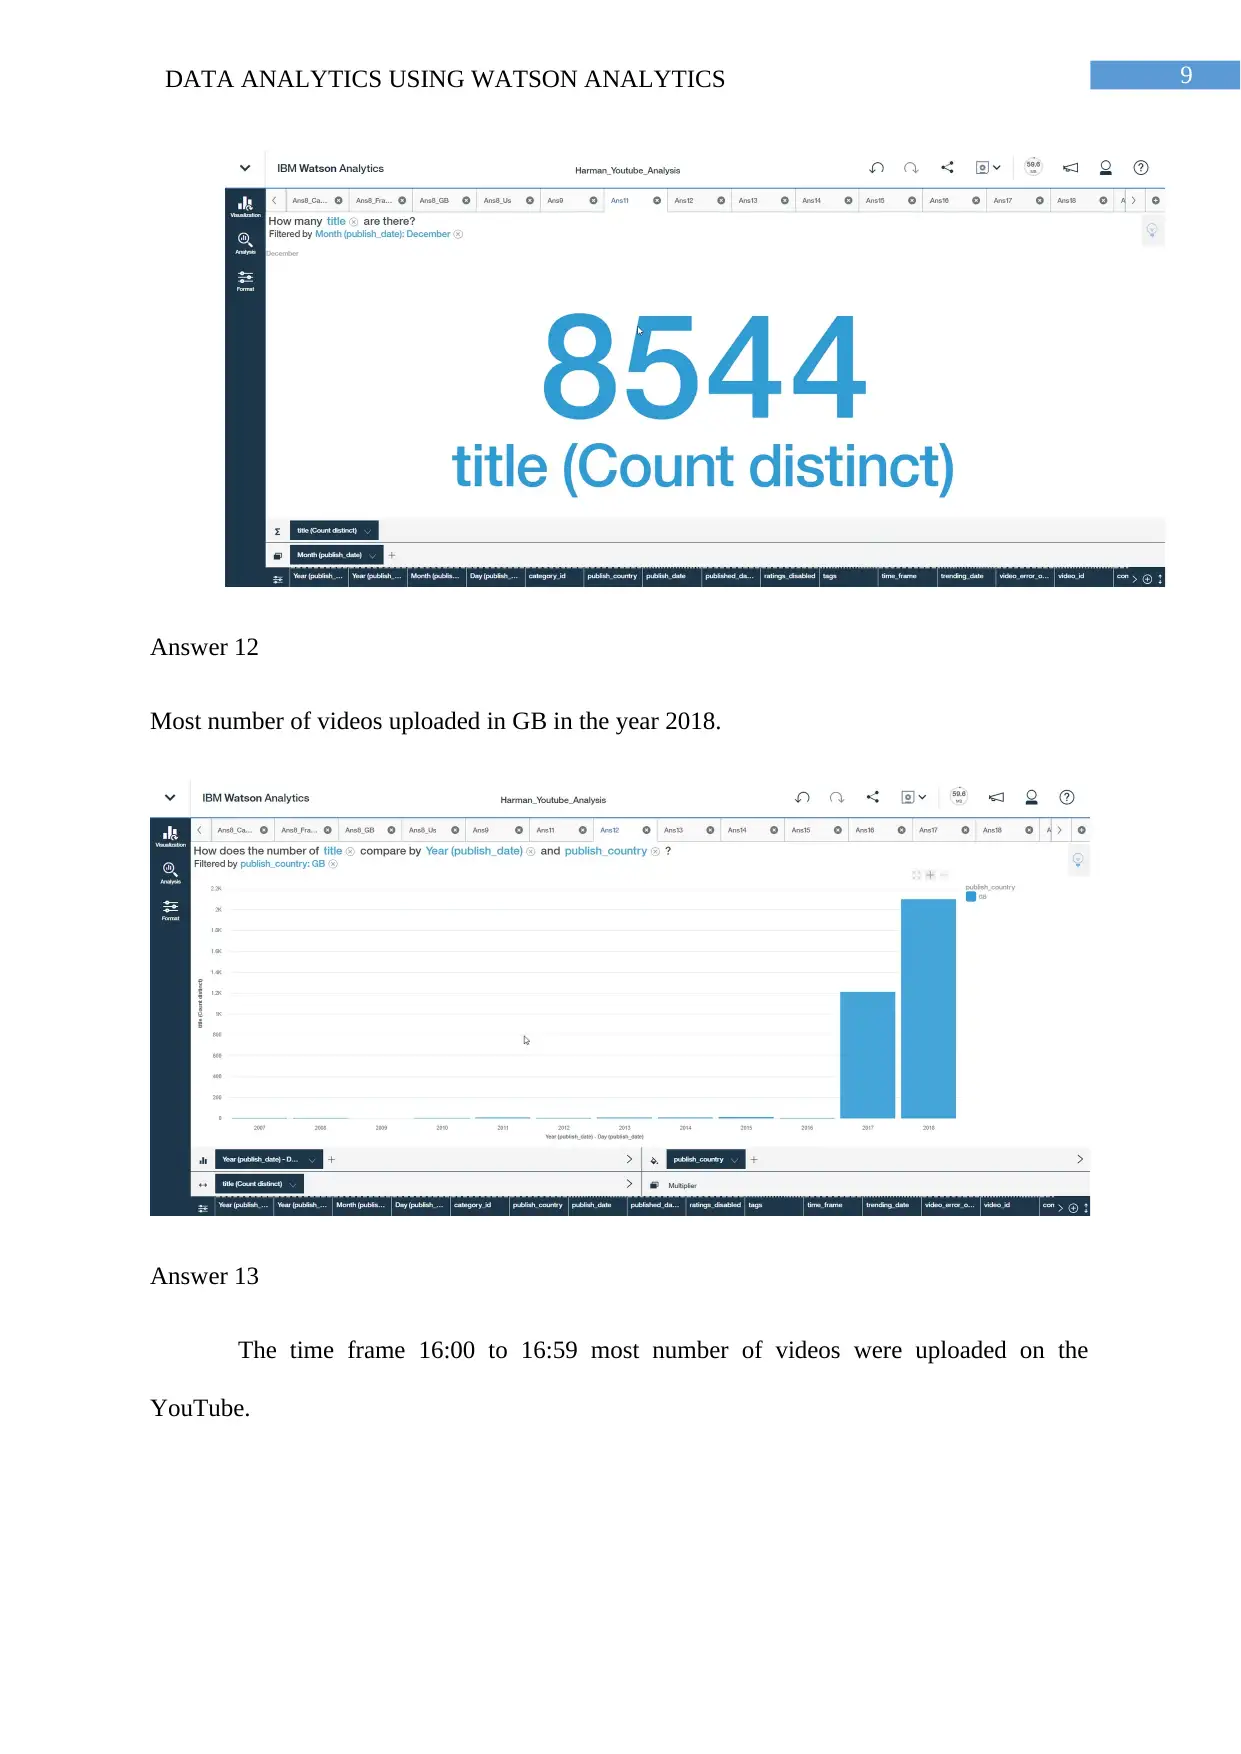
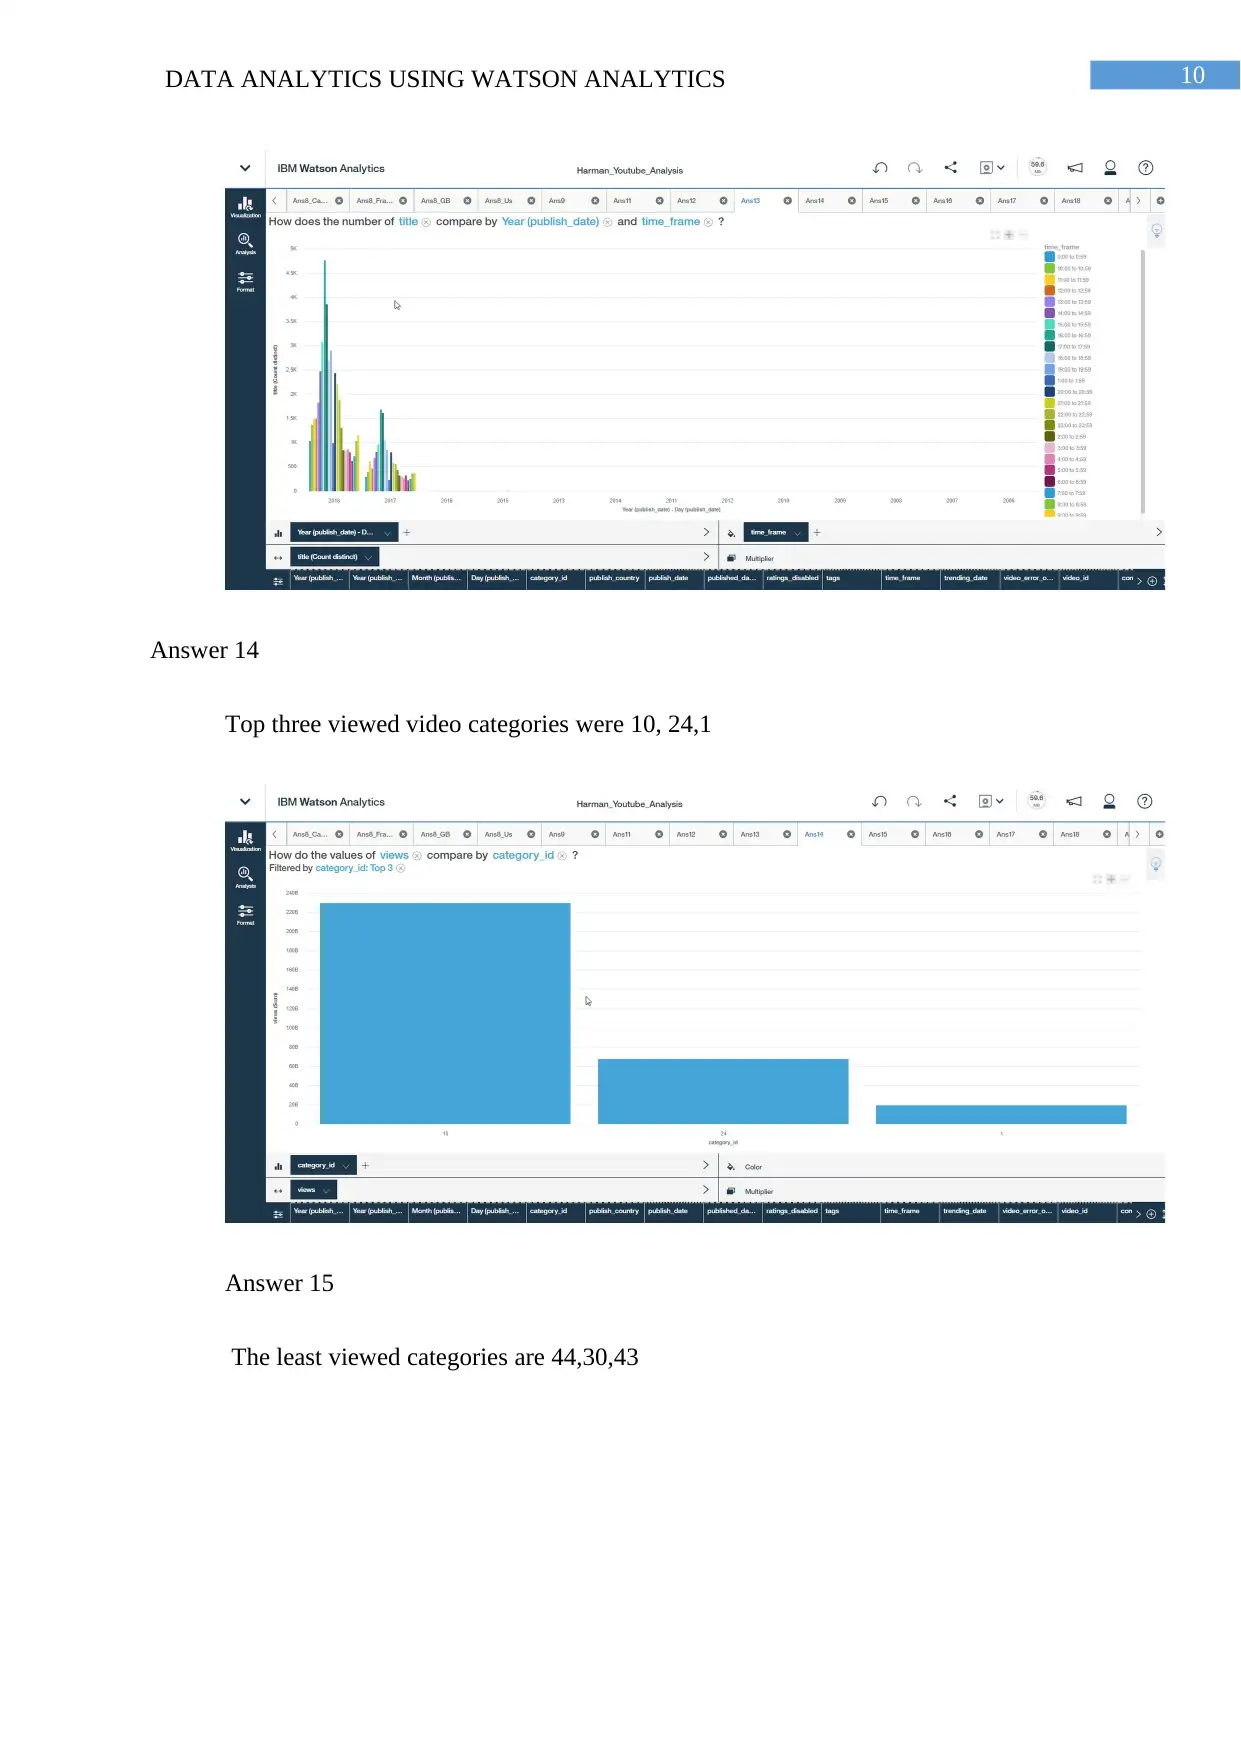
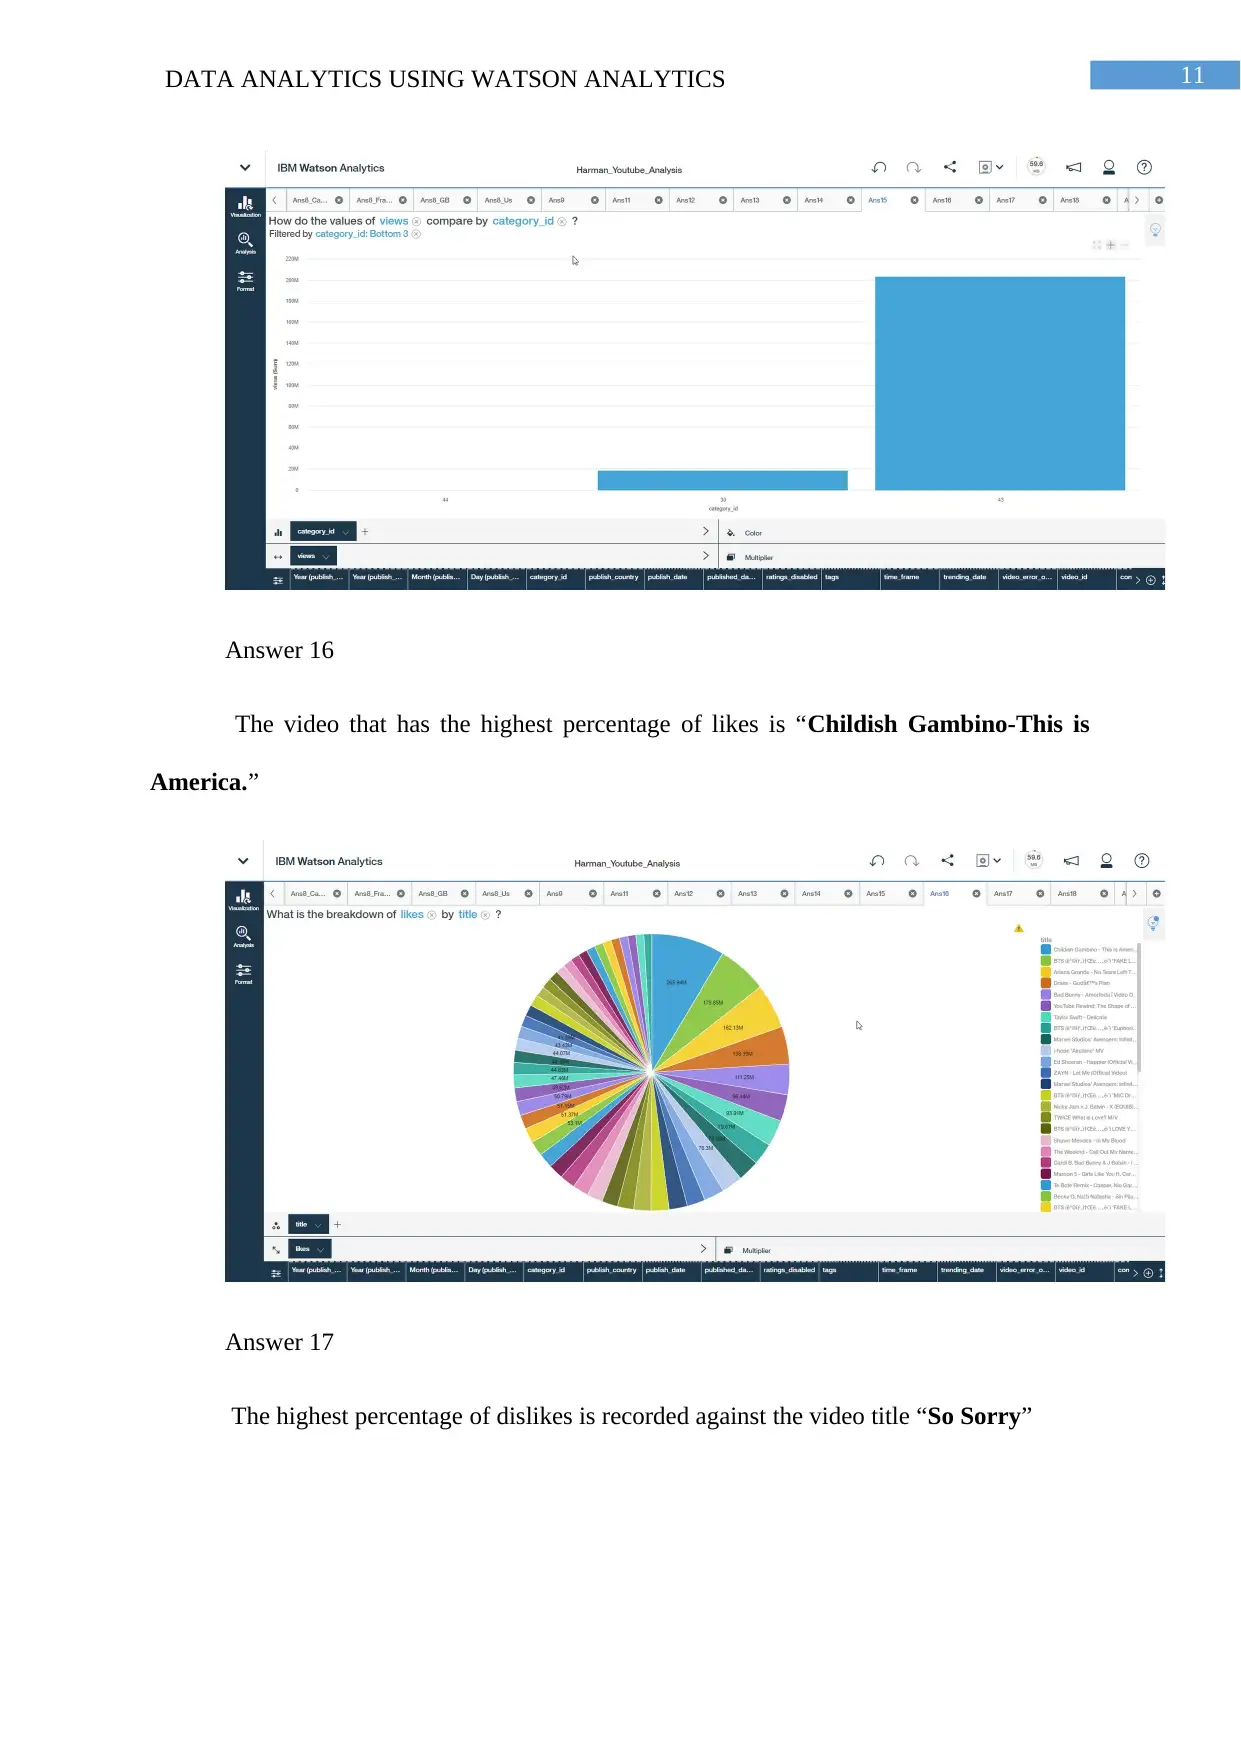
This report presents a comprehensive data analysis of a YouTube dataset using IBM Watson Analytics. The analysis explores various aspects of the data, including video categories, upload trends, viewer engagement, and channel performance across different countries (US, GB, France, and Canada). Dashboards are created to visualize key metrics such as the distribution of videos by category, monthly upload patterns, and viewer preferences. Advanced insights are derived to identify top disliked channels and tags, as well as the relationship between dislikes and video removals. The report concludes with recommendations for a content manager, focusing on strategies to increase viewership, minimize dislikes, and optimize content based on identified trends. The analysis highlights the potential of Watson Analytics in uncovering valuable insights from large datasets for informed decision-making.
1 out of 23
Related Documents


Your All-in-One AI-Powered Toolkit for Academic Success.
+13062052269
info@desklib.com
Available 24*7 on WhatsApp / Email
![[object Object]](/_next/static/media/star-bottom.7253800d.svg)
Copyright © 2020–2026 A2Z Services. All Rights Reserved. Developed and managed by ZUCOL.