Runway Incursion Analysis: Technologies Impact in USA (2013-2017)
VerifiedAdded on 2020/04/15
|40
|7784
|327
Report
AI Summary
This report presents an analysis of runway incursions in the USA from 2013 to 2017, focusing on the impact of new technologies introduced to mitigate these incidents. The study utilizes secondary data from the Federal Aviation Administration (FAA) and divides the data into two periods: before and after the implementation of new technologies. The analysis includes descriptive statistics to provide an overview of runway incursions across different regions, categorized by operational incidents, pilot deviations, vehicle/pedestrian deviations, and other factors. Inferential statistics, specifically paired t-tests, are employed to assess the statistical significance of the technology's impact on the frequency of runway incursions. The report also includes a graphical representation of the data through histograms, which helps in understanding the distribution of runway incursions. The findings aim to inform recommendations on the effectiveness of current technologies and the potential need for further safety measures to reduce runway incursions.
Chapter 04 –Results
Introduction( This should be instruction to this chapter. Not about the runway incursions)
The entire chapter of data analysis and results has been arranged in following order. In the first
section, the descriptive analysis has been presented which shows the runway incursion in
different regions over the period of five years. The descriptive analysis is followed by the
inferential analysis which consists of t-test and chi square test along with histograms of the
selected variables. Finally, the regression analysis has been performed to find the impact of the
technologies on the runway incursions.
For the analysis purpose secondary data has been collected from the data base of Federal
Aviation Administration. Time period for the current study has been taken from financial year
2013 till financial year 2016. Since the main aim of the study is to find the impact of the
technology used on the runway incursion in the USA, the entire data set has been divided into
two different groups. The first group is the before introducing the technology and the second
group after the introduction of the technologies for the runway incursion. So, for the current
study it has been assumed that the new technologies were introduced in 2015. Therefore, the
time period between 2013- 2014 has been taken as the before technology period and the time
period between 2015 and 2017 as the after technologies.
The data collected is sample from nine different regions in USA. The data contains two
variables including a dependent variable and an independent variable. The dependent variable is
the number of runaway incursion and the independent variable the use of technologies which is
categorically dichotomous variable (levels = before and after). The data enumerate all incidences
of runaway incursion before and after from 2013- 2016 five years for those airports that have
Paraphrase This Document
Need a fresh take? Get an instant paraphrase of this document with our AI Paraphraser
installed of the current technologies in each of the region in USA. Furthermore, the researcher
has analyzed the data to evaluate hypothesis and simulated data and tested the data against the
hypothesis.
Runway incursion in USA has become one of the most serious causes for accidents in the
runway. Innovative technologies have been introduced to reduce the incursions in the runways,
and the number of runway incursions has reduced (Federal Aviation Administration, 2017). So,
the current study is aimed to examine whether the new technologies have any impact on the
number of runway incursions in different regions in USA. On the basis of the results from the
analysis recommendation can be made whether the current technologies are effective or there is
requirement for new technologies to reduce the runway incursions.
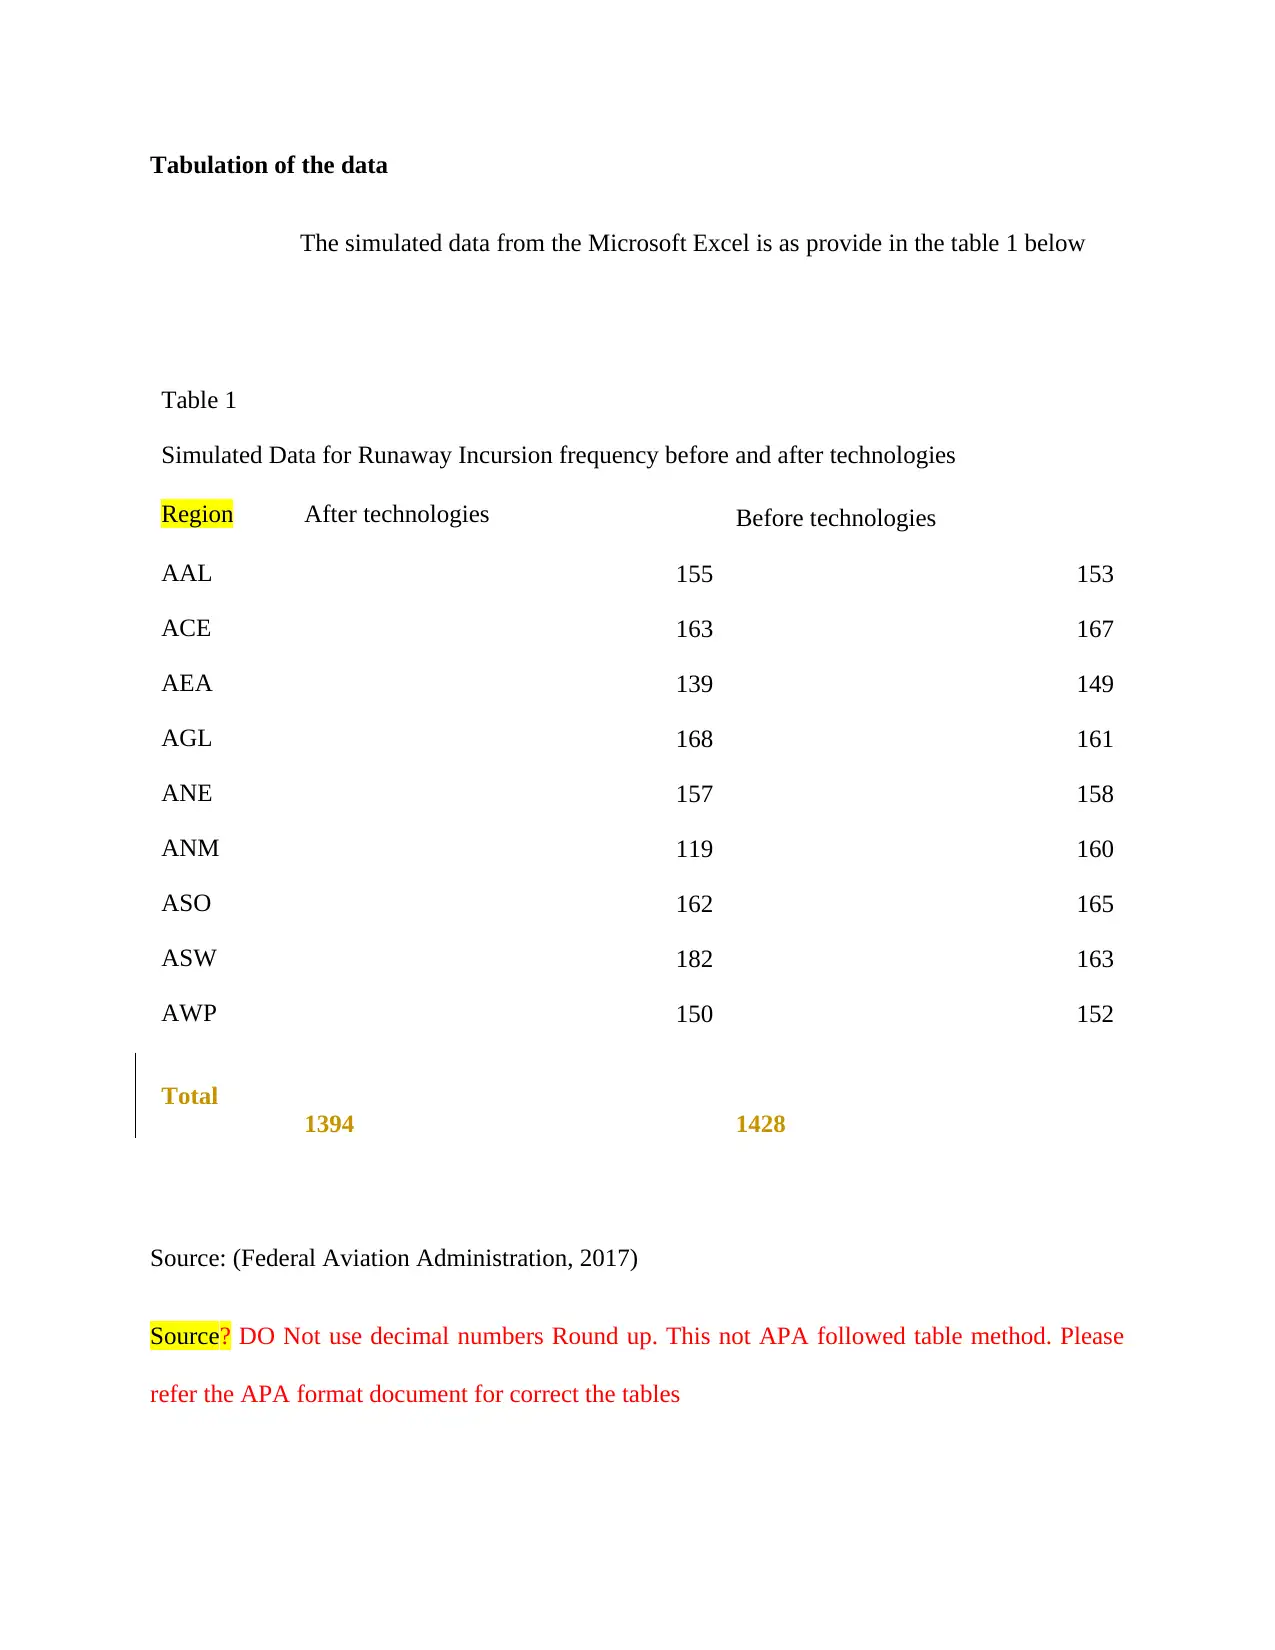
Tabulation of the data
The simulated data from the Microsoft Excel is as provide in the table 1 below
Table 1
Simulated Data for Runaway Incursion frequency before and after technologies
Region After technologies Before technologies
AAL 155 153
ACE 163 167
AEA 139 149
AGL 168 161
ANE 157 158
ANM 119 160
ASO 162 165
ASW 182 163
AWP 150 152
Total
1394 1428
Source: (Federal Aviation Administration, 2017)
Source? DO Not use decimal numbers Round up. This not APA followed table method. Please
refer the APA format document for correct the tables
⊘ This is a preview!⊘
Do you want full access?
Subscribe today to unlock all pages.
Trusted by 1+ million students worldwide
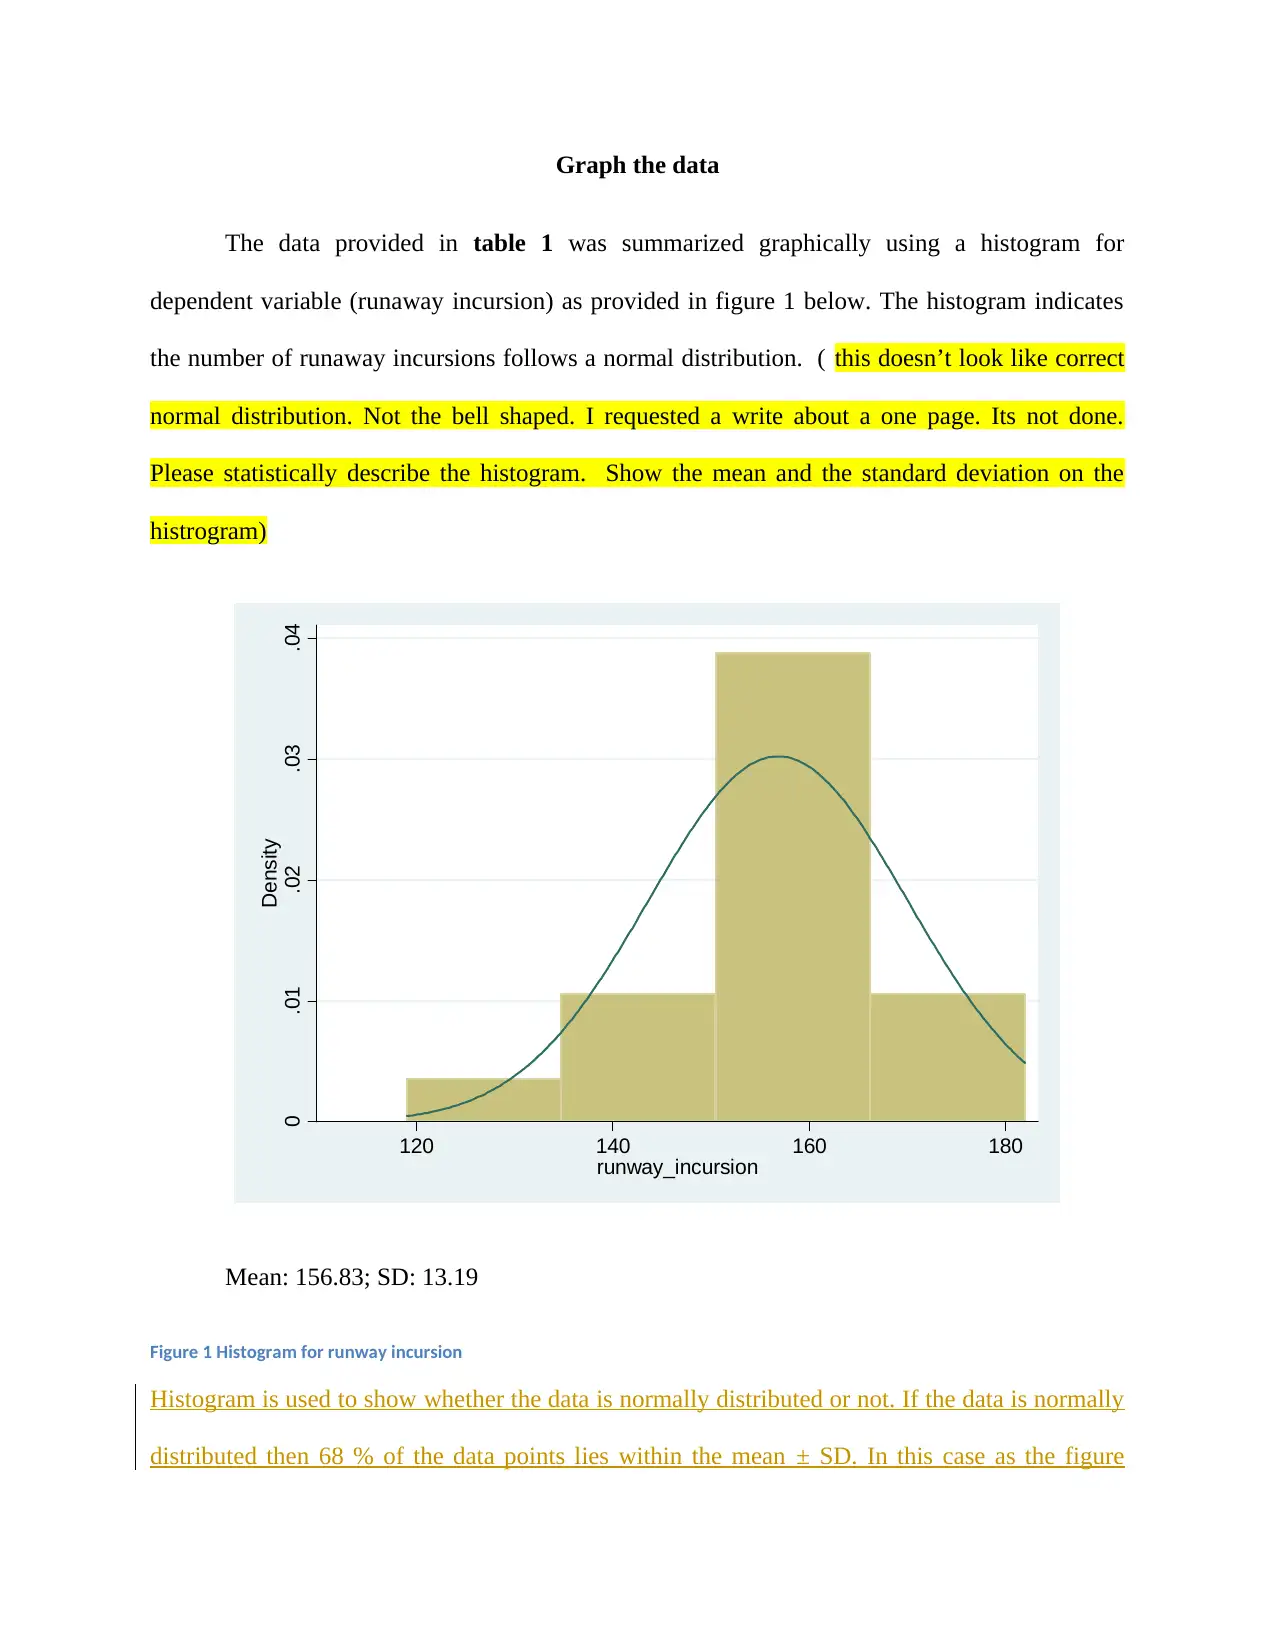
Graph the data
The data provided in table 1 was summarized graphically using a histogram for
dependent variable (runaway incursion) as provided in figure 1 below. The histogram indicates
the number of runaway incursions follows a normal distribution. ( this doesn’t look like correct
normal distribution. Not the bell shaped. I requested a write about a one page. Its not done.
Please statistically describe the histogram. Show the mean and the standard deviation on the
histrogram)
0 .01 .02 .03 .04
Density
120 140 160 180
runway_incursion
Mean: 156.83; SD: 13.19
Figure 1 Histogram for runway incursion
Histogram is used to show whether the data is normally distributed or not. If the data is normally
distributed then 68 % of the data points lies within the mean ± SD. In this case as the figure
Paraphrase This Document
Need a fresh take? Get an instant paraphrase of this document with our AI Paraphraser
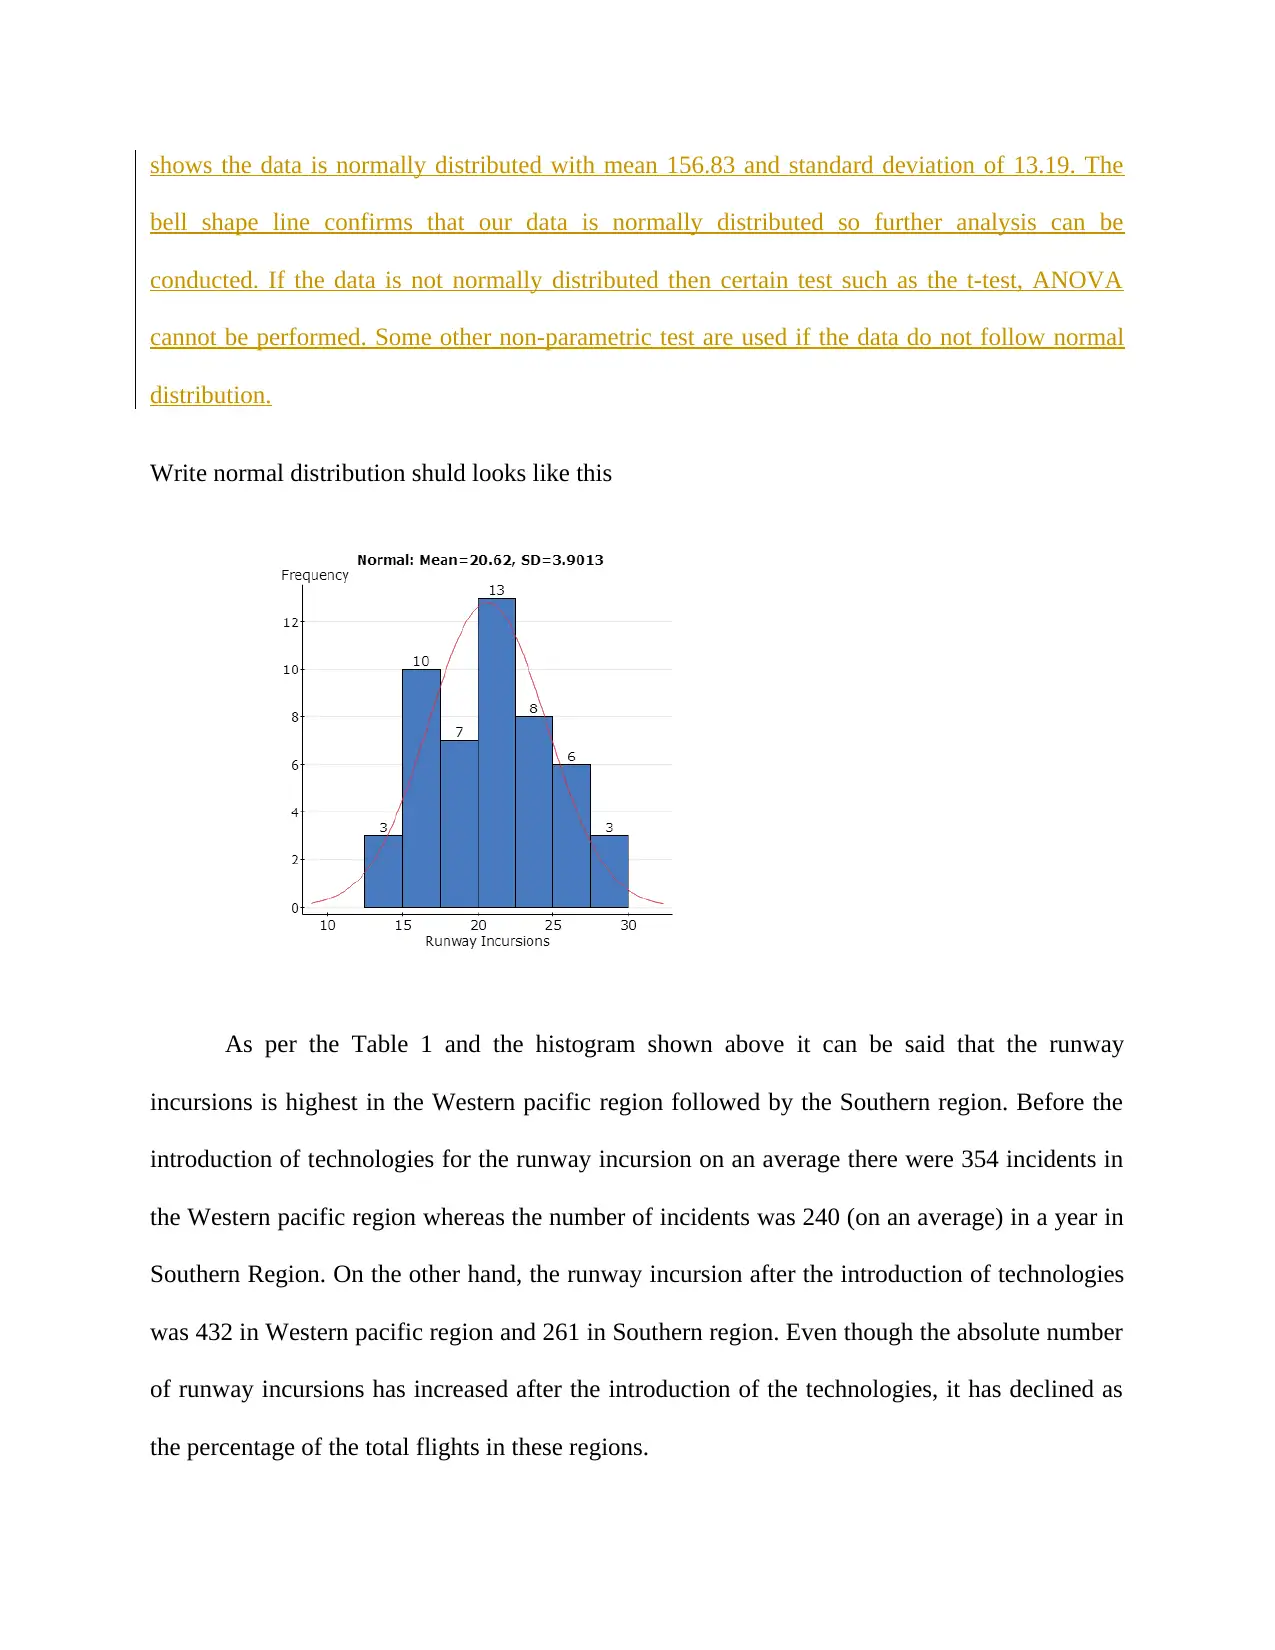
shows the data is normally distributed with mean 156.83 and standard deviation of 13.19. The
bell shape line confirms that our data is normally distributed so further analysis can be
conducted. If the data is not normally distributed then certain test such as the t-test, ANOVA
cannot be performed. Some other non-parametric test are used if the data do not follow normal
distribution.
Write normal distribution shuld looks like this
As per the Table 1 and the histogram shown above it can be said that the runway
incursions is highest in the Western pacific region followed by the Southern region. Before the
introduction of technologies for the runway incursion on an average there were 354 incidents in
the Western pacific region whereas the number of incidents was 240 (on an average) in a year in
Southern Region. On the other hand, the runway incursion after the introduction of technologies
was 432 in Western pacific region and 261 in Southern region. Even though the absolute number
of runway incursions has increased after the introduction of the technologies, it has declined as
the percentage of the total flights in these regions.
Furthermore the lowest number of incursion was in the Central region before the
technologies, whereas after the introduction of the technologies the lowest number of runway
incursion was recorded in the New England region where the average numbers of runway
incursion were 36 per year on an average.
Table 2:
Descriptive statistics of the variables
Descriptive Statistics
N Minimum Maximum Mean Std. Deviation
Before technologies 9 31 354 146.78 105.347
After technologies 9 36 432 181.11 127.352
Also the results from the descriptive statistics shows that the average number ofrunway
incursion before the technologies was146.78 whereas after the incursion of technologies the
average number of runway incursion are 181 with standard deviation of 127.352. Similarly the
minimum number of incursion before the technologies was 31 which were 36 after the
introduction of technologies. Furthermore, in terms of maximum number of incursion before the
technologies were 354 per year whereas after the technologies the maximum number of runway
incursion was 432 per year.
Region wise descriptive statistics for runway incursions
⊘ This is a preview!⊘
Do you want full access?
Subscribe today to unlock all pages.
Trusted by 1+ million students worldwide
Descriptive analysis helps the researcher to give the overview of the selected variables. In
this section, the descriptive analysis of the runway incursion in different region has been shown
in different years.
Runway incursion incidents are divided into four different categories which are as follows:
Operational Incidents (OI): It is related to the action of the air traffic controller where the
minimum separation times between the aircrafts are not maintained. In other cases where the
minimum required time between aircraft and the obstacles is not maintained, then also it comes
under the operational incidents.
Pilot Deviations (PD): This incursion is directly related to the pilots. It is considered as the pilot
deviation if the pilot of the aircraft does not follow the guidelines given by the Federal Aviation
Regulation. For example, pilot crossing the runway without the clearance from the concerned
department.
Vehicle/ Pedestrian Deviation (V/PD): This runway incursion appears if any vehicle or human
enters the runway without the authorization from the concerned department (Chang & Wong,
2012; Galle, Ale, Hossain, & Moliterno, 2010).
Other: Apart from the above three conditions, if the runway incursion occurs, it comes under
“other” category.
Table 3
Runway incursion before the introduction of technologies (2012-13)
Region OI other PD V/PD Total
AAL 13 1 16 12 42
Paraphrase This Document
Need a fresh take? Get an instant paraphrase of this document with our AI Paraphraser
ACE 3 31 3 37
AEA 25 68 21 114
AGL 47 1 88 36 172
ANE 7 30 7 44
ANM 28 68 25 121
ASO 53 1 154 23 231
ASW 27 104 41 172
AWP 40 1 224 44 309
This shows that in 2012 -13 most of the runway incursion was due to pilot deviations. In other
words, runway incursion occurred because the aircraft pilots do not follow the rules given by the
Federal Aviation Regulations. Similarly around 11 % of the runway incursions were due to the
human or vehicle deviations. Operational incidents were the lowest.
Table 4
Runway incursion before the introduction of technologies (2013-14)
Region OI other PD V/PD Total
AAL 6 30 17 53
ACE 6 12 6 24
AEA 67 1 59 31 158
AGL 37 2 77 23 139
ANE 6 11 5 22
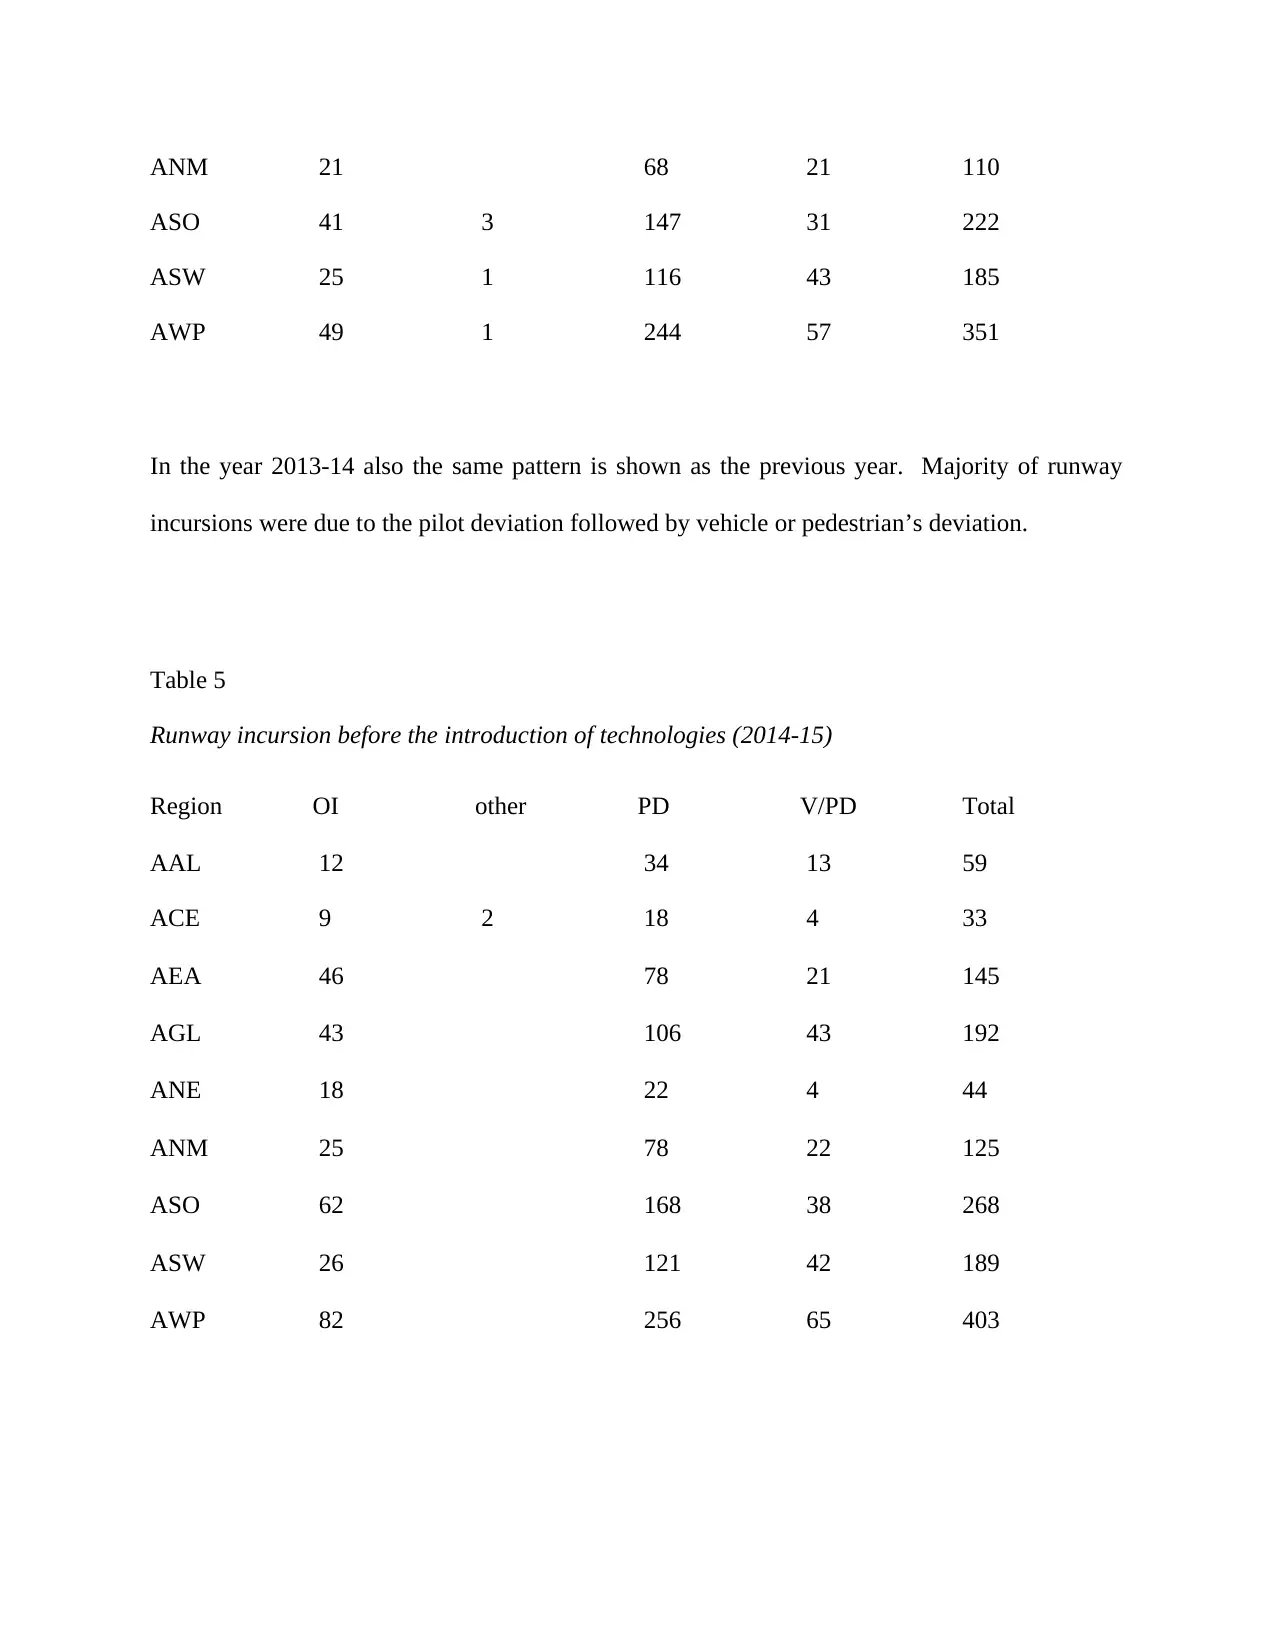
ANM 21 68 21 110
ASO 41 3 147 31 222
ASW 25 1 116 43 185
AWP 49 1 244 57 351
In the year 2013-14 also the same pattern is shown as the previous year. Majority of runway
incursions were due to the pilot deviation followed by vehicle or pedestrian’s deviation.
Table 5
Runway incursion before the introduction of technologies (2014-15)
Region OI other PD V/PD Total
AAL 12 34 13 59
ACE 9 2 18 4 33
AEA 46 78 21 145
AGL 43 106 43 192
ANE 18 22 4 44
ANM 25 78 22 125
ASO 62 168 38 268
ASW 26 121 42 189
AWP 82 256 65 403
⊘ This is a preview!⊘
Do you want full access?
Subscribe today to unlock all pages.
Trusted by 1+ million students worldwide
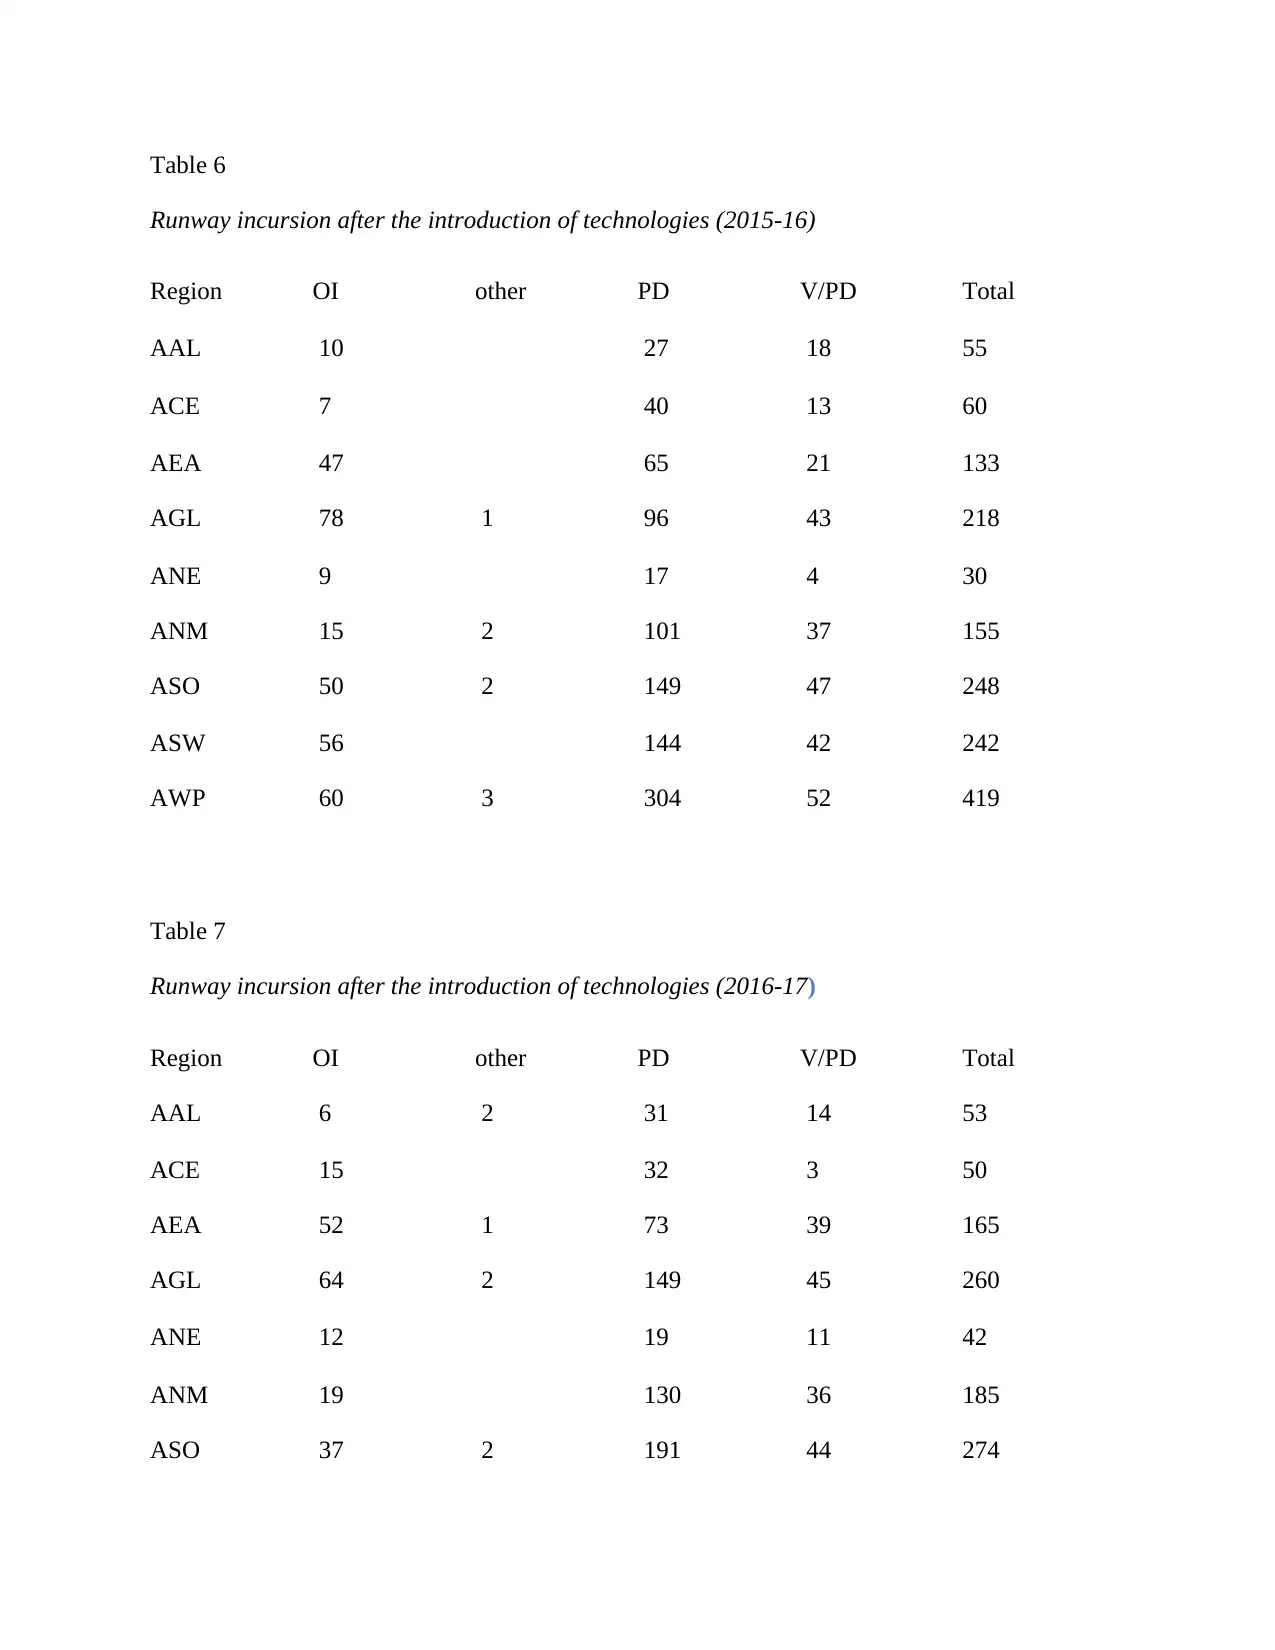
Table 6
Runway incursion after the introduction of technologies (2015-16)
Region OI other PD V/PD Total
AAL 10 27 18 55
ACE 7 40 13 60
AEA 47 65 21 133
AGL 78 1 96 43 218
ANE 9 17 4 30
ANM 15 2 101 37 155
ASO 50 2 149 47 248
ASW 56 144 42 242
AWP 60 3 304 52 419
Table 7
Runway incursion after the introduction of technologies (2016-17)
Region OI other PD V/PD Total
AAL 6 2 31 14 53
ACE 15 32 3 50
AEA 52 1 73 39 165
AGL 64 2 149 45 260
ANE 12 19 11 42
ANM 19 130 36 185
ASO 37 2 191 44 274
Paraphrase This Document
Need a fresh take? Get an instant paraphrase of this document with our AI Paraphraser
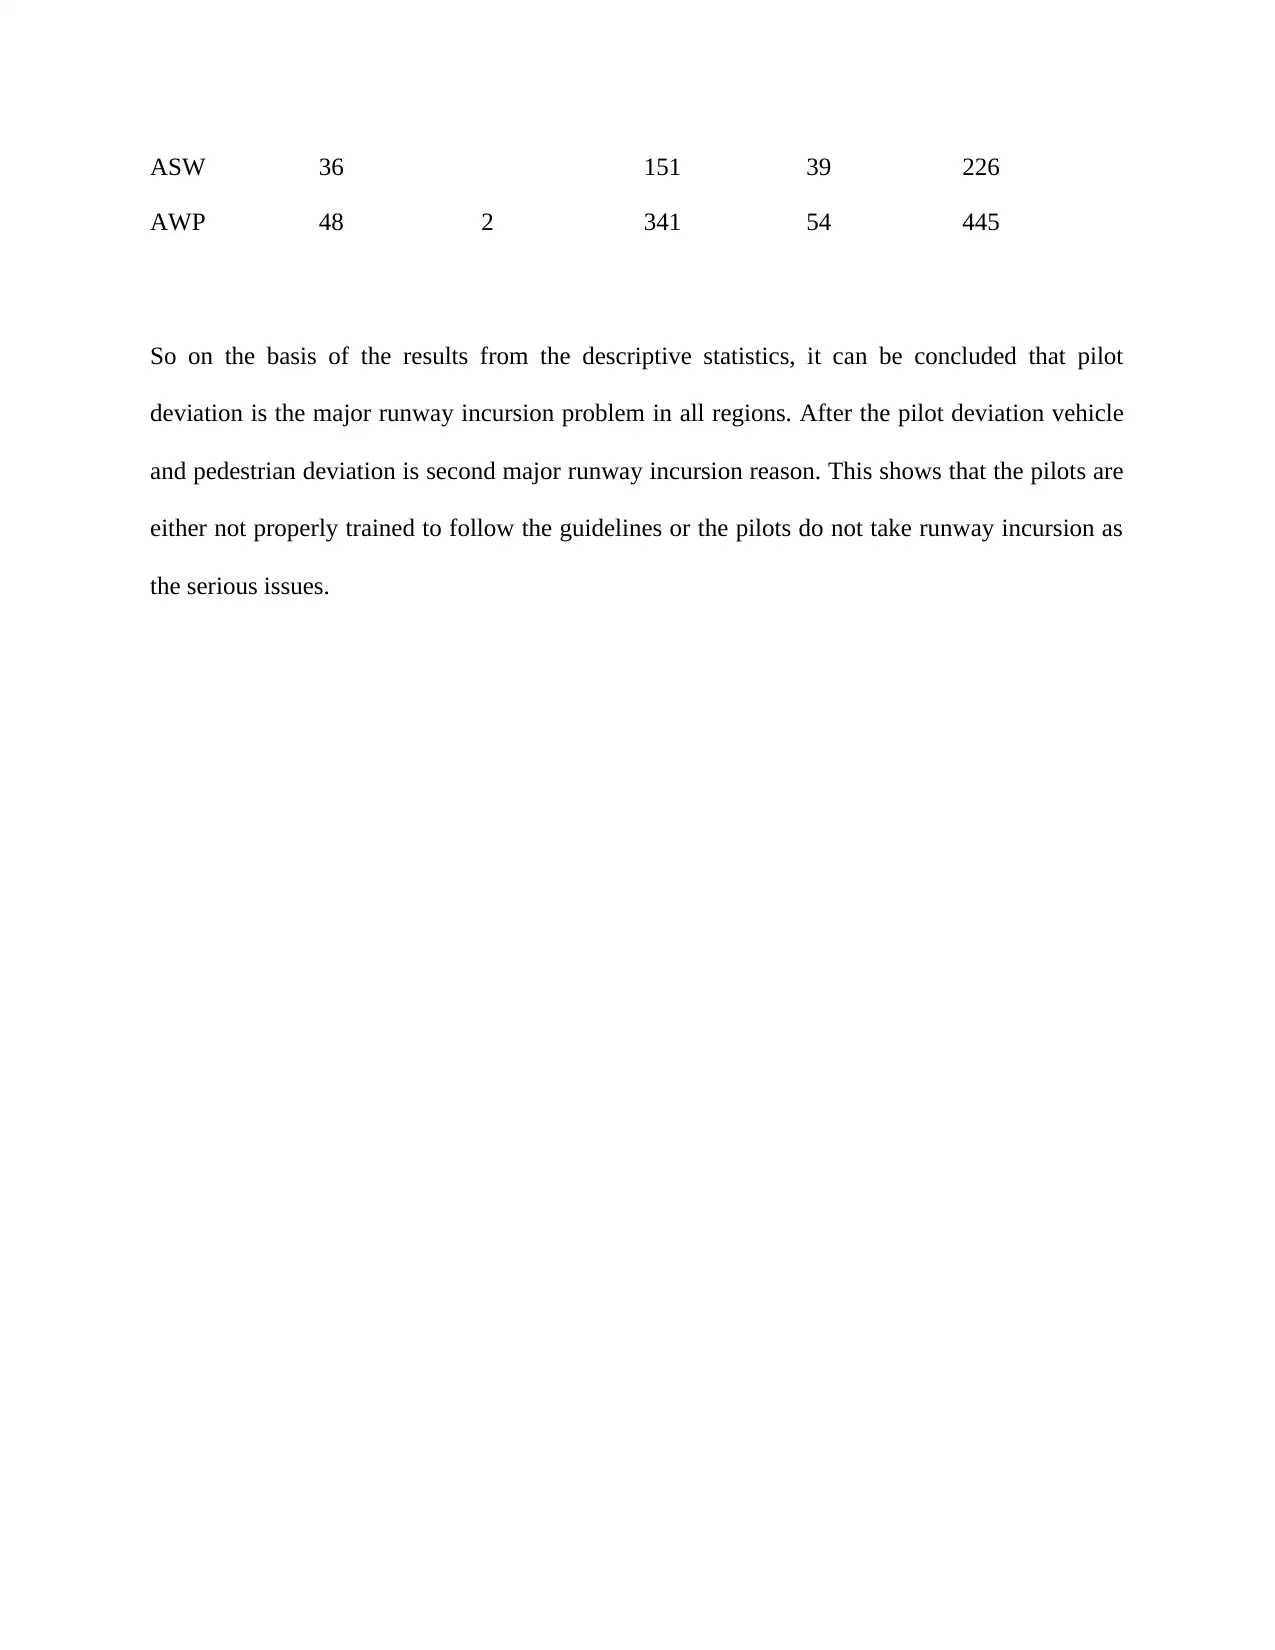
ASW 36 151 39 226
AWP 48 2 341 54 445
So on the basis of the results from the descriptive statistics, it can be concluded that pilot
deviation is the major runway incursion problem in all regions. After the pilot deviation vehicle
and pedestrian deviation is second major runway incursion reason. This shows that the pilots are
either not properly trained to follow the guidelines or the pilots do not take runway incursion as
the serious issues.
Statistical method
Since the data from the two groups comes from the same, it is appropriate to use paired t-
test to test the hypotheses stated above. Since the dependent variable is a continuous variable, the
independent variable is dichotomous, and figure 1 indicates the dependent variable is normally
distributed, it is appropriated to conclude that the data meets the criterion for paired t-test. The
hypothesis is directional hence the test will be one-tailed.
Paired sample t test is also known as the dependent sample t test. It is generally used to
test whether there is significant difference between two samples from the same population. In
other words, it tests whether the mean difference between tow samples is zero or not. The paired
sample t test is used to test the following hypothesis:
Null hypothesis: The true mean difference is zero
Alternative hypothesis: The true mean difference is not zero.
So, if the significance value (or p value) is less than 0.05 then one can reject the null hypothesis
and accept the alternative hypothesis, whereas if the p value is more than 0.05, then one cannot
reject the null hypothesis. To perform the paired sample t test the dependent variable should be
continuous and the observation should be independent. Similarly normality of the data is another
important assumption of paired sample t-test.
In this research also the main aim is to test whether the runway incursion after the technologies is
significantly different as compared to before technologies period. So, the paired sample t test has
been used (Johnson, Zhao, Faulkne, & Young, 2016).
⊘ This is a preview!⊘
Do you want full access?
Subscribe today to unlock all pages.
Trusted by 1+ million students worldwide
1 out of 40