MGT723 Research Project, Semester 2: Data Collection and Analysis
VerifiedAdded on 2023/06/07
|11
|2427
|320
Report
AI Summary
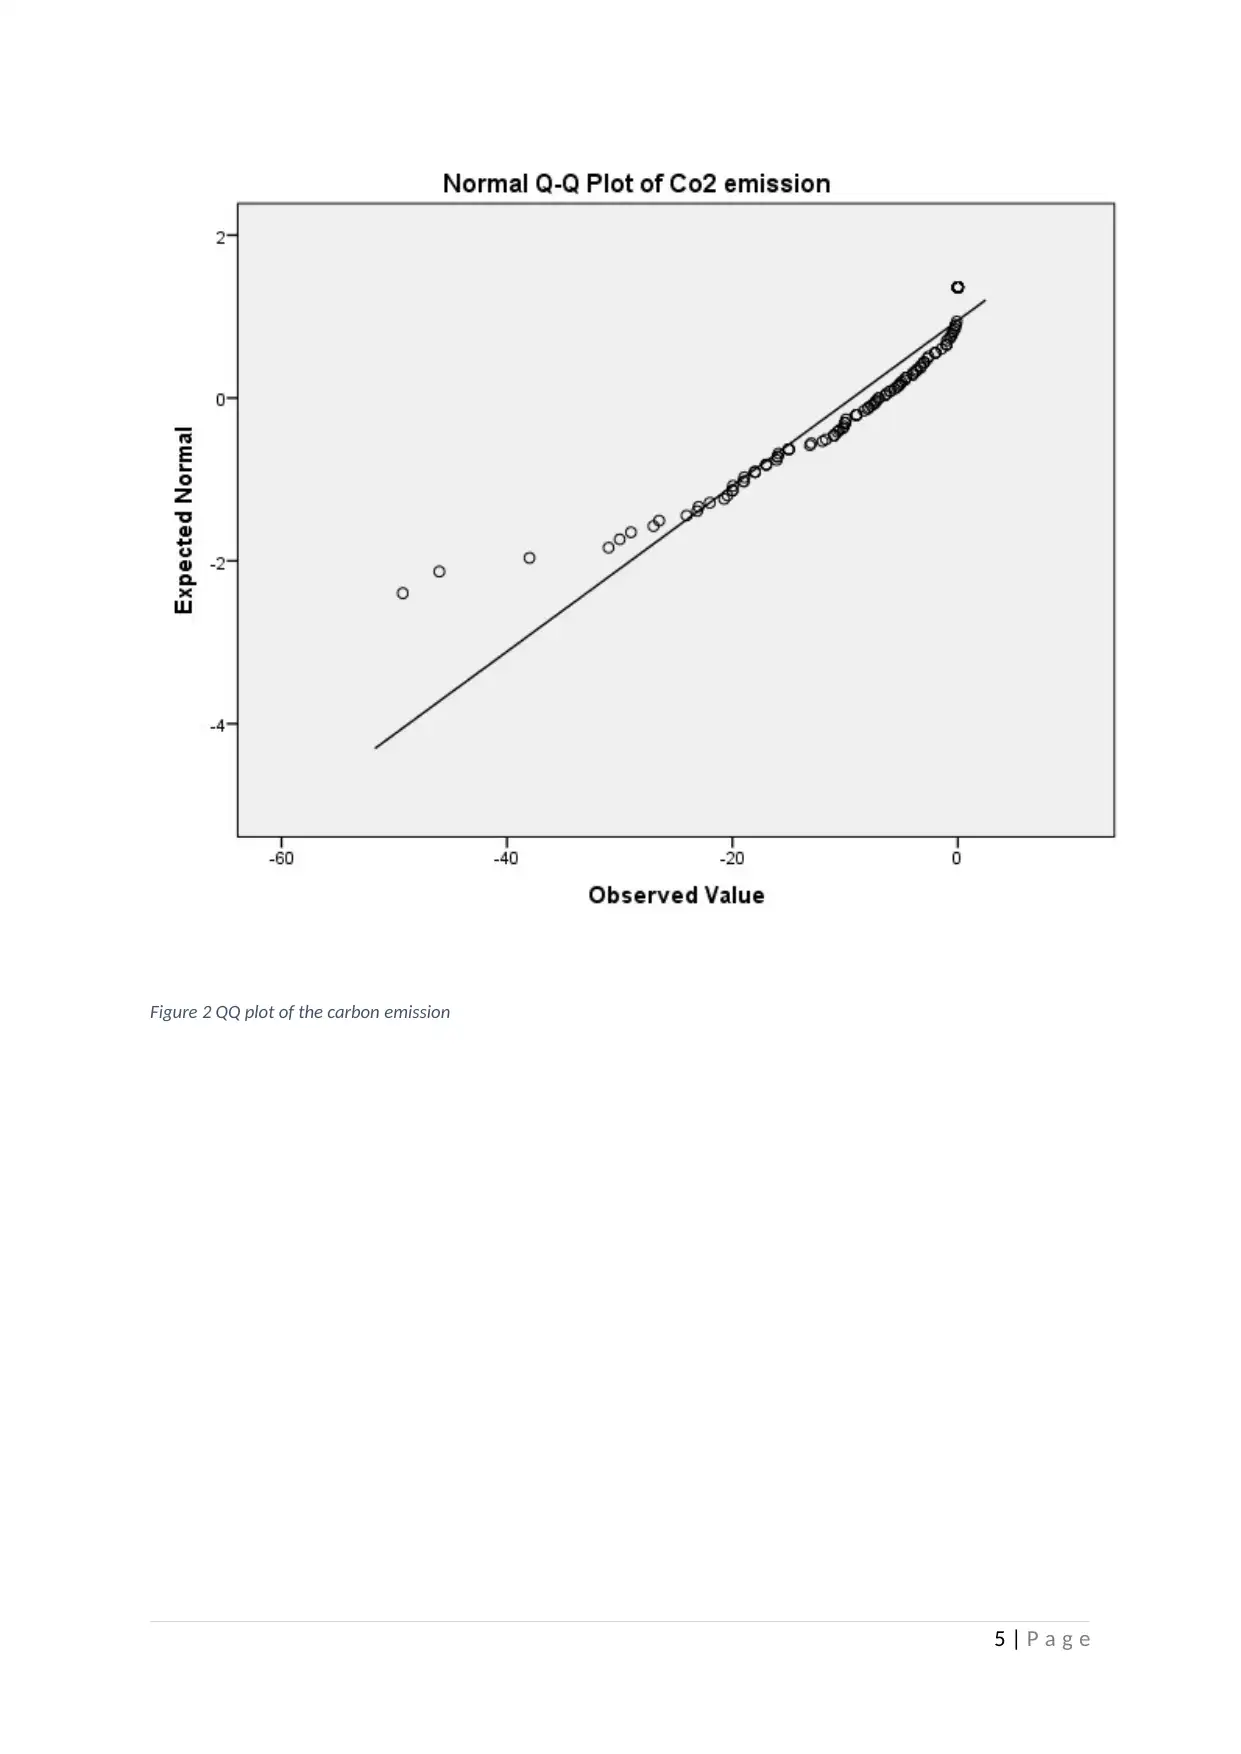
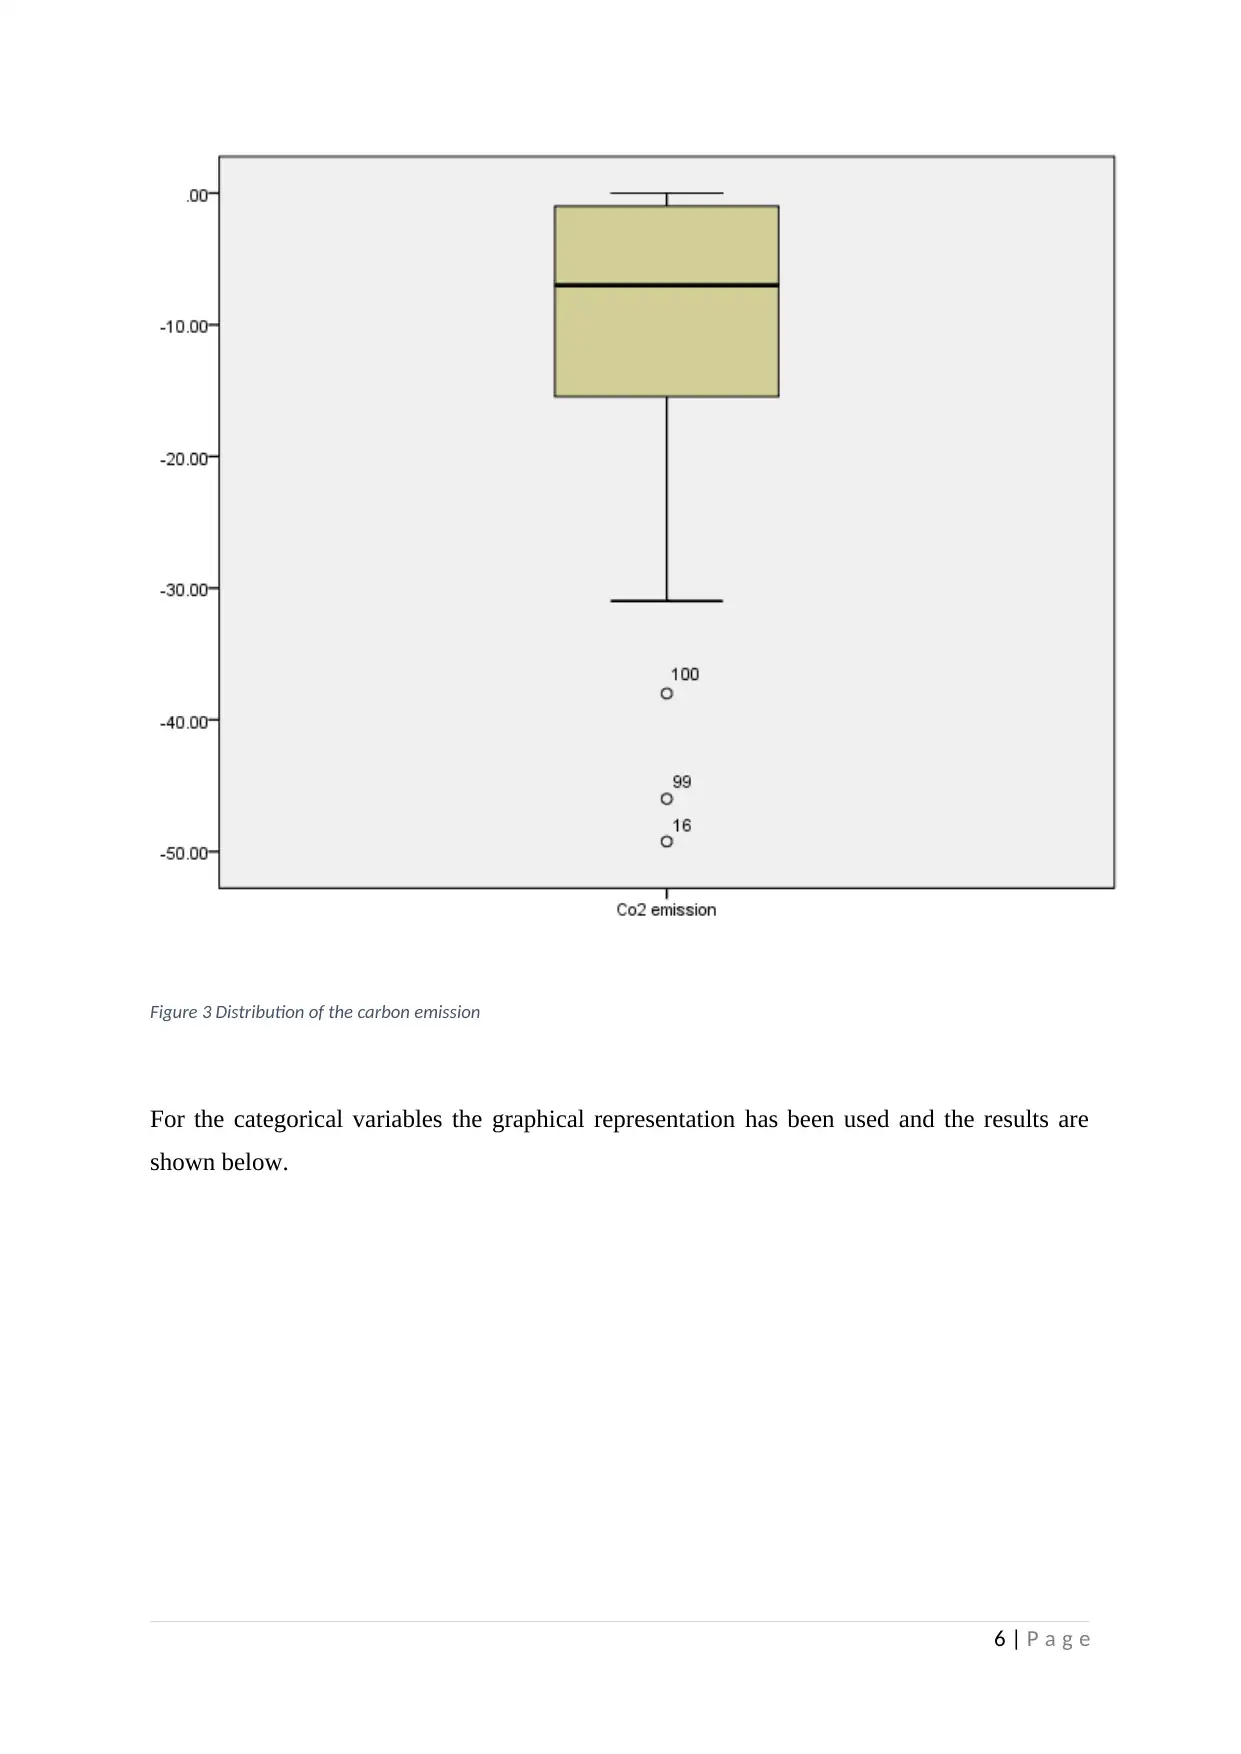
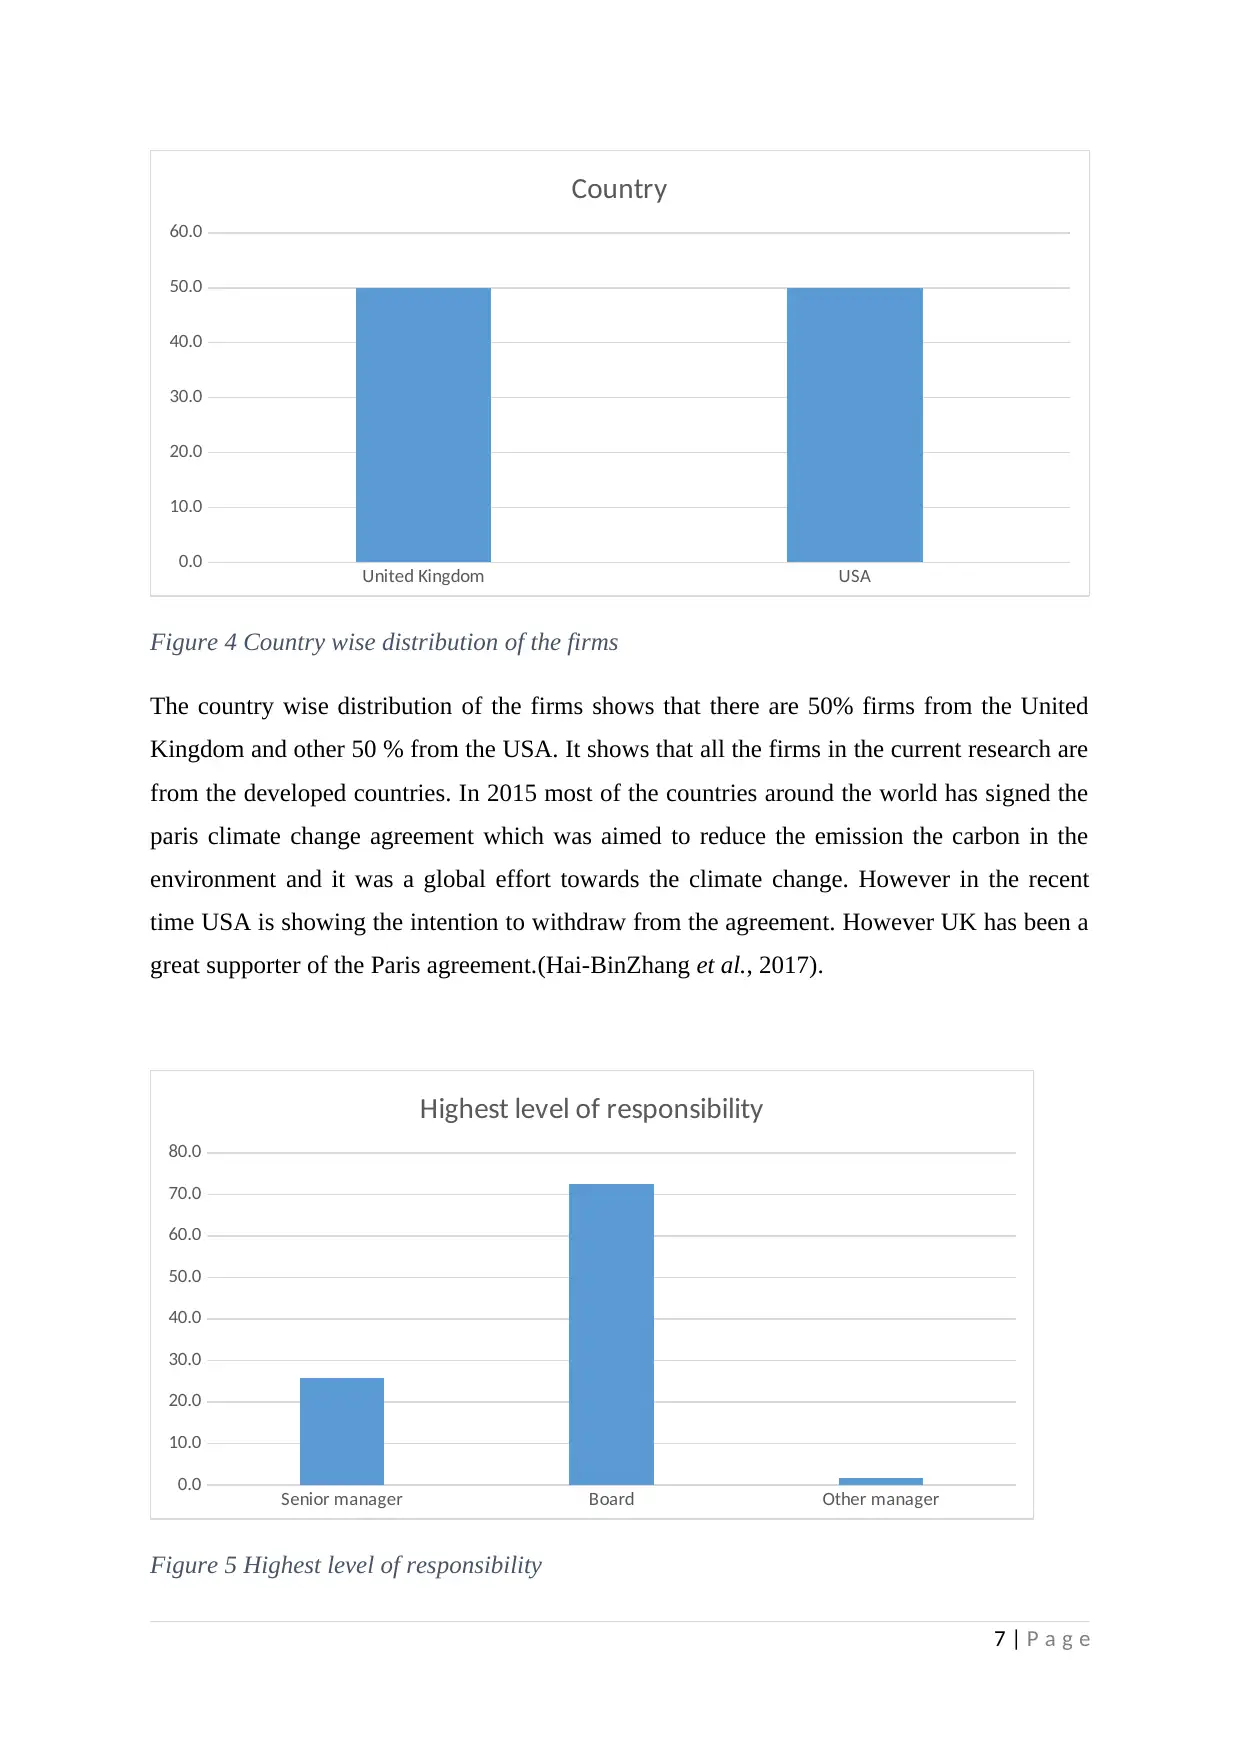
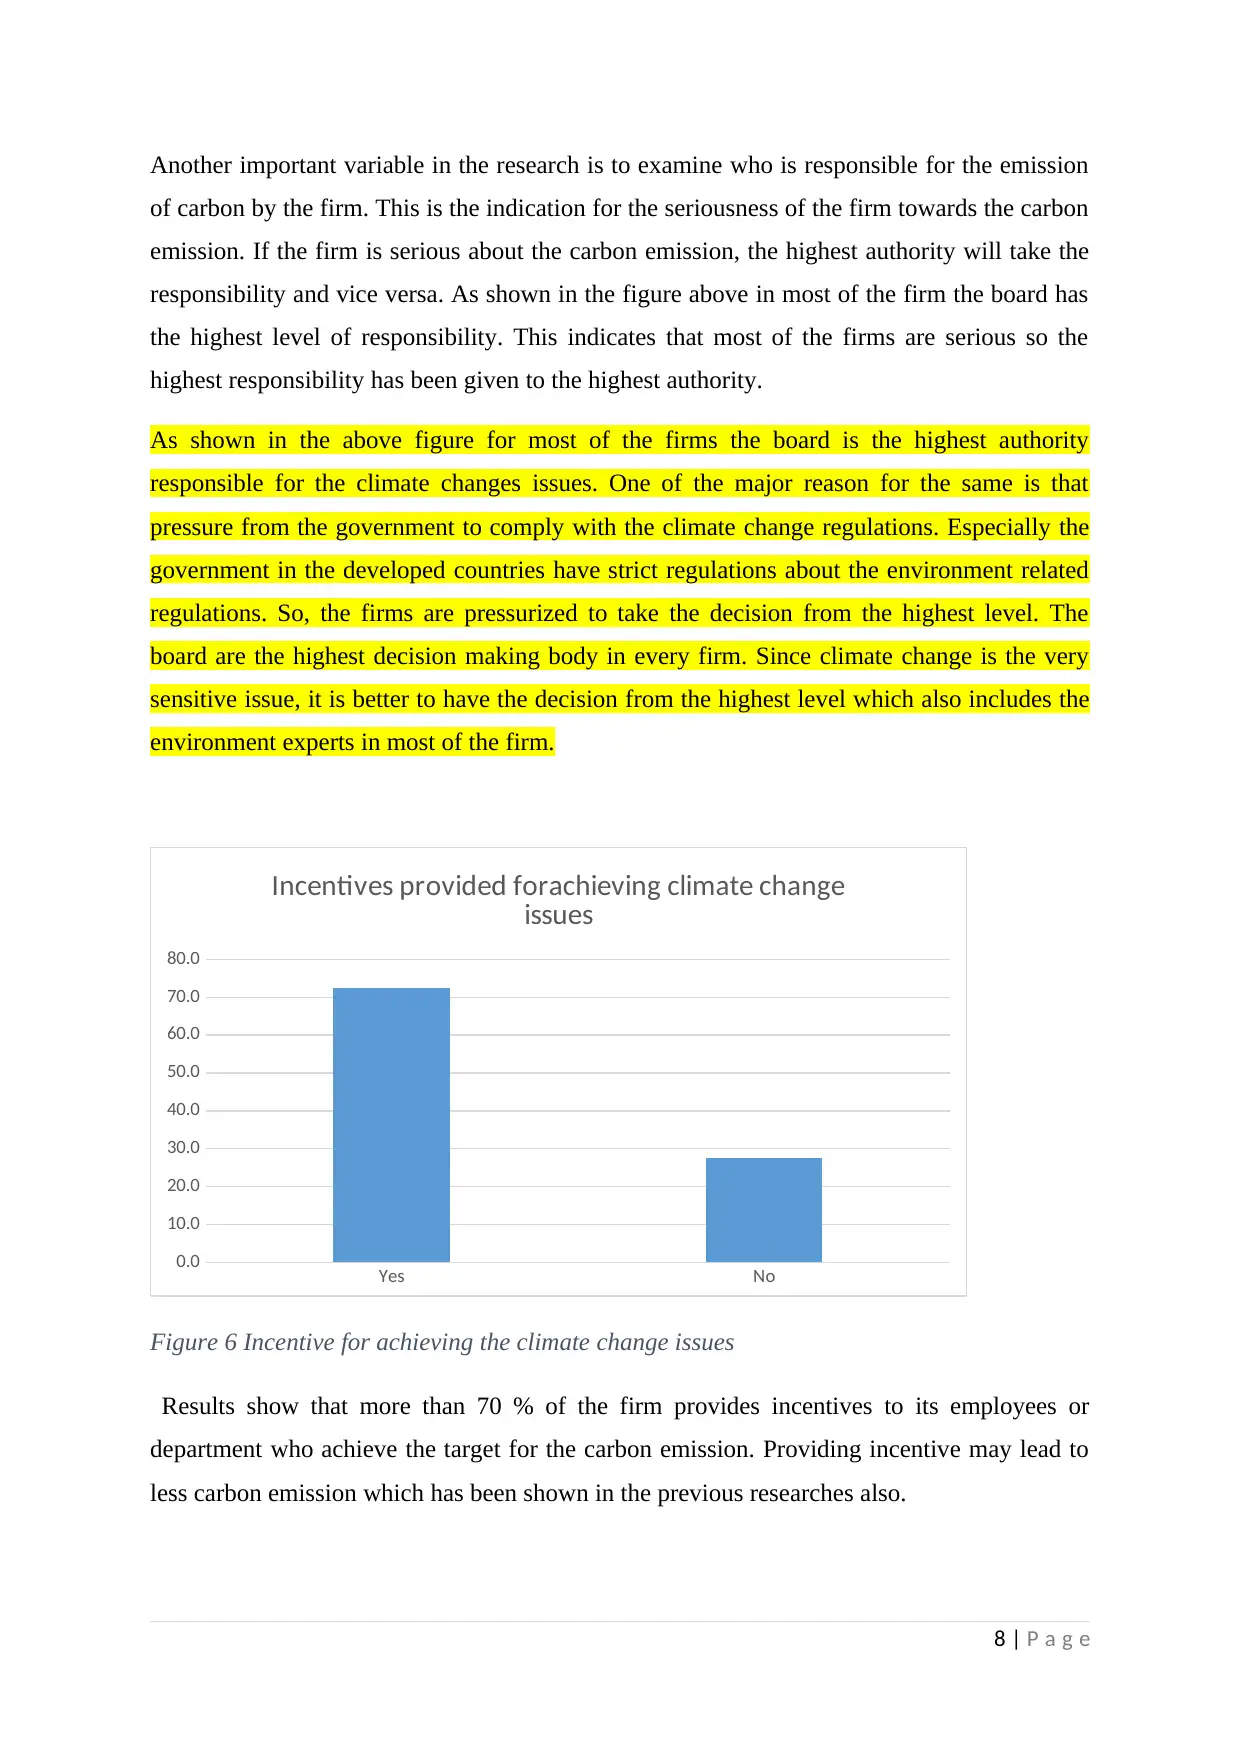
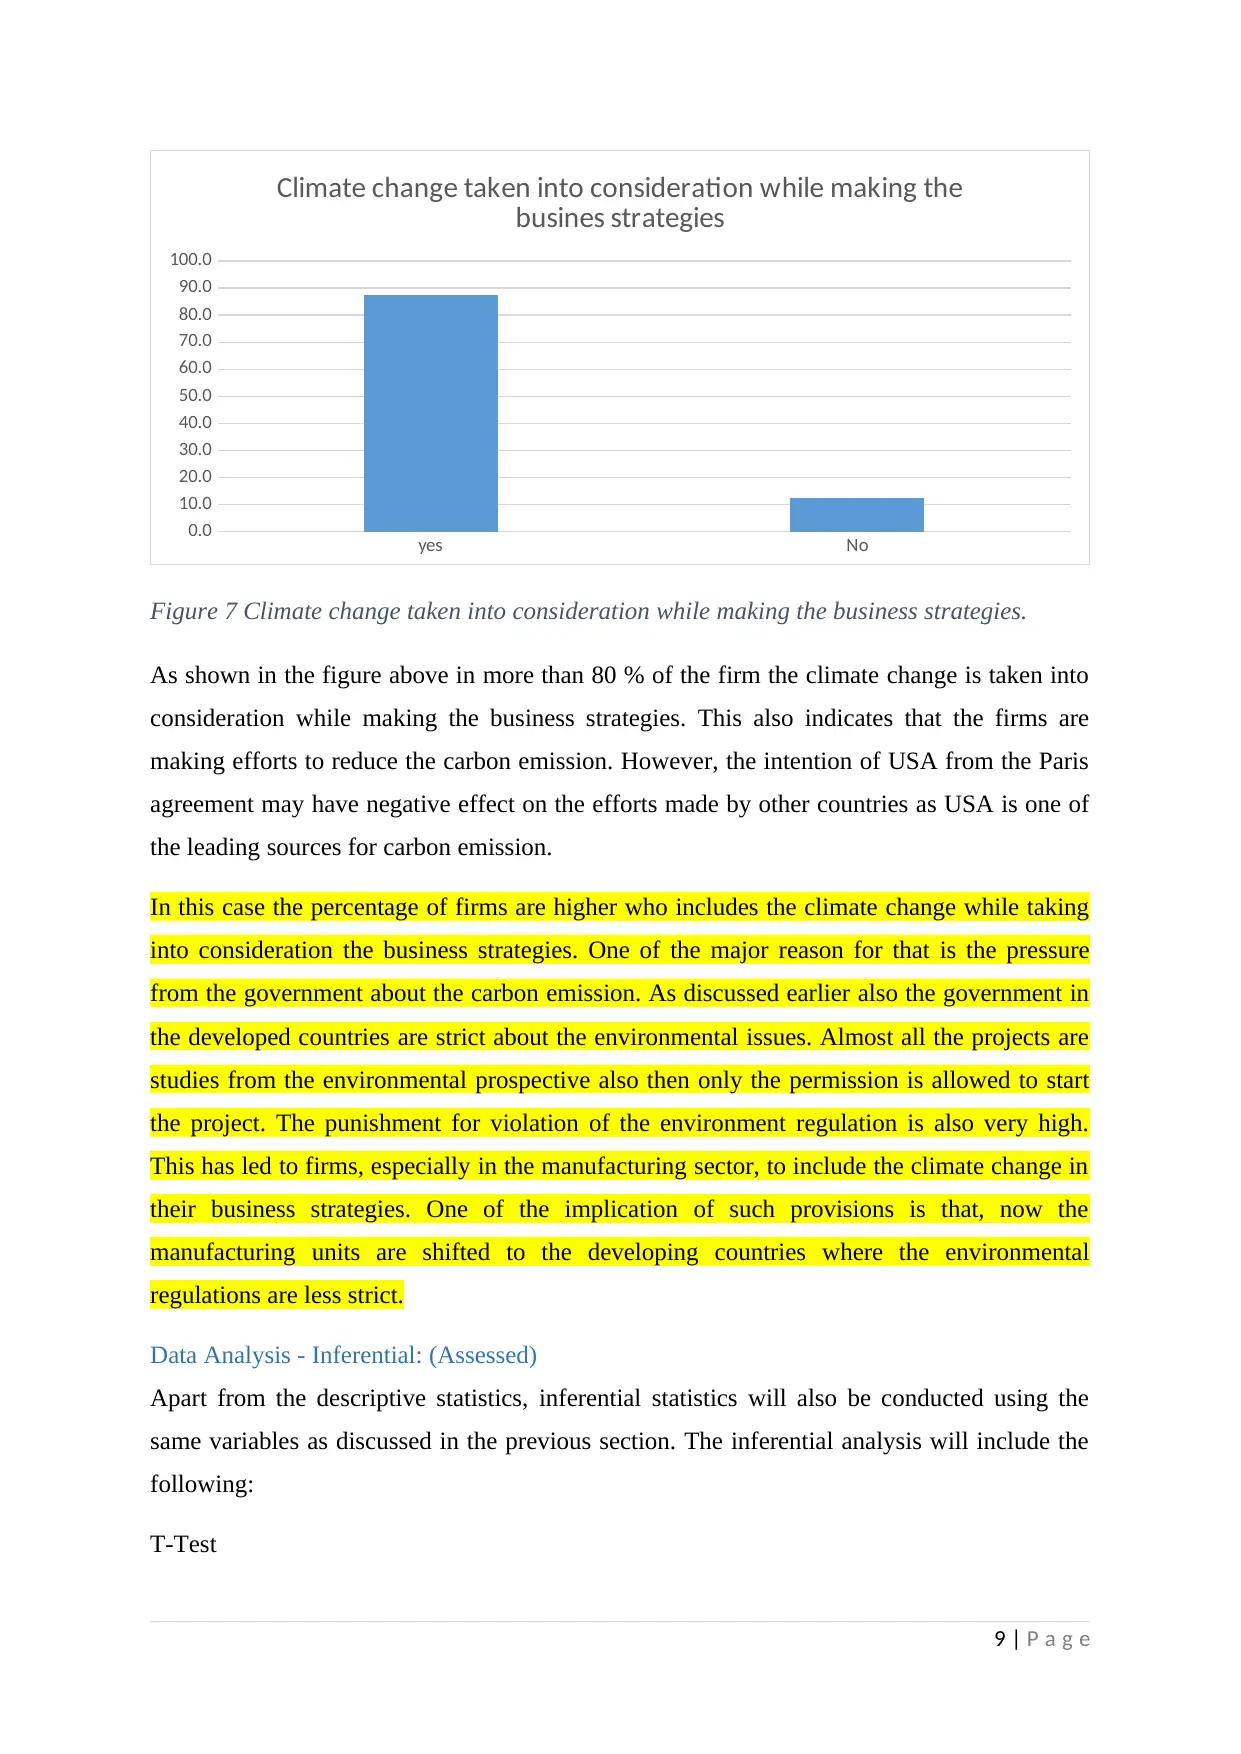
This report presents the data collection and analysis for a research project investigating carbon emissions. The study utilizes secondary data from the United Kingdom and the United States of America, employing descriptive and inferential statistical techniques. Data cleaning, including handling missing values and outliers, was performed before analysis using SPSS. Descriptive statistics, including measures of central tendency like mean, median, and mode, were used to provide an overview of the data, revealing a decrease in CO2 emissions on average. Graphical representations were also used for categorical variables. Inferential statistics, including t-tests and ANOVA, were proposed to further analyze the data. The report highlights the importance of environmental regulations and the impact of stakeholder influence on carbon emission reduction strategies within organizations. The findings indicate that the board is the highest authority responsible for climate change issues. The report also discusses the country-wise distribution of firms and the incentives provided for achieving climate change goals. The report provides an in-depth analysis of the data and results, providing a comprehensive overview of the research project.

Data Collection (Assessed)
One of the most important part of any research is the data collection. The hypothesis
proposed by the researcher are tested on the basis of the collected data. There are mainly two
types of data sources which are used for research papers. The first one is the primary data,
which is also called the fists hand data. This type of data is collected by the researchers as per
the requirement of the research. The major techniques of collecting the primary data are the
primary survey and the personal interview. If the researcher want to collect the quantitative
data primary survey is the most appropriate technique. On the other hand if the researcher
wants to collect the qualitative data, then conducting the personal interview is more
appropriate as compared to the primary survey. One of the major advantage of primary data is
that the researcher can collect whatever information is required for the research. However the
primary survey is both time consuming and costly(VARGAS-HERNÁNDEZ, LEÓN and
VALDÉZ, 2011; Rajasekar, Philominathan and Chinnathambi, 2013; Kumar, 2014).
The second type of the data is the secondary data which is also called the second hand data.
This data has been already collected by someone else (government, research organisations,
international institutions) for their own purpose. The major source of secondary data includes
published books, journals, government data bases, research papers, data base of international
organisations such as World Bank, IMF, ILO etc. One of the major advantage of the
secondary data is that it is easy to collect and are less costly as compared to the primary data.
However, in some cases the appropriate data is not available which is one of the major
drawback(Stewart and Kamins, 1993; Saunders, Lewis and Thornhill, 2007; Bryman, A. and
Bell, 2011; Flick, 2011).
For the current search the secondary data has been used to test the proposed hypothesis in the
previous section. The data has been used for both the descriptive and the inferential analysis
and the results from the analysis have been discussed in the next section. However before
analysing the data the basic data cleaning process has been followed. First the missing values
in the data set were checked and also the outliers were tested. This is because the missing
values and the outliers may affect the results and the robust results may not be obtained. The
outliners are those data points which are far from the mean value of the series. Once the data
was cleaned then it was exported to SPSS for further analysis.
In this case the data has been collected for United Kingdom and the United States of
America, which are the most developed countries in the world. The data from the developed
Paraphrase This Document
Need a fresh take? Get an instant paraphrase of this document with our AI Paraphraser

countries have been used because they are responsible for the majority of the historical
carbon emission. However in the current context the developing countries are also
contributing significantly in the carbon emission. Furthermore the government is also strict
about the carbon emission in developed countries as compared to the developing ones. This is
another reason to select these countries.
Data Analysis - Descriptive: (Assessed)
In this section the results from the descriptive data analysis has been presented. The
descriptive statistics are the most appropriate way of presenting the overview of the collected
data. This will provide a clear picture to both the writer and the reader about the data being
used for the research. Also the descriptive statistics set the base for the inferential
analysis(Gaur and Gaur, 2006; Greenland et al., 2016).
In the current case the descriptive statistics has been conducted using various measures of
central tendencies. This includes mean, mode, median and other statistics such as skewness,
kurtosis, maximum value and minimum value. The results from the descriptive statistics is
shown in the table below. However one important thing to notice is that the descriptive
statistic is appropriate only if the variable is continuous. In the current research only the
emission of Co2 is the only continuous variable and the result for the same has been
presented.
Statistics
Co2 emission
N Valid 120
Missing 0
Mean -9.3728
Median -7.0000
Mode .00
Std. Deviation 9.83731
Variance 96.773
Skewness -1.505
Std. Error of Skewness .221
Kurtosis 2.832
Std. Error of Kurtosis .438
Minimum -49.24
2 | P a g e

Maximum .00
Sum -1124.73
Percentiles
25 -15.6750
50 -7.0000
75 -1.0000
Table 1 Results from the descriptive statistics
As shown in the table above, the mean change (5%) of the co2 emission as compared to the
previous year is -9.3728. This indicates that on an average the emission of co2 has decreased
as compared to the previous year. The standard deviation is 9.8 which is comparatively high.
A high standard deviation indicates higher variation in the data set. On the other hand a low
standard deviation indicates that there is less variation in the data set of most of the data
points lies near the mean value of the series. Furthermore the median value is -7 which also
indicates that there has been decline in the emission of co2 as compared to the previous year.
Researchers sometimes argues that as compared to mean, median is more appropriate. This is
because the mean value is highly influenced by the extreme values whereas median is not
influenced. In addition the minimum value is -49 % which indicates there has been 49 %
reduction in the emission of co2 as compared to the previous year. On the other hand
maximum is 0, which shows that there are some firms whose carbon emission has neither
increased nor decreased. One interesting thing to notice is that there is no single firm, where
the carbon emission has increased(Burnett, 2009; Millimet and Roy, 2011; Zhang et al.,
2016).
3 | P a g e
⊘ This is a preview!⊘
Do you want full access?
Subscribe today to unlock all pages.

Trusted by 1+ million students worldwide

Figure 1 Histogram of the carbon emission
4 | P a g e
4 | P a g e
Paraphrase This Document
Need a fresh take? Get an instant paraphrase of this document with our AI Paraphraser

Figure 2 QQ plot of the carbon emission
5 | P a g e
5 | P a g e

Figure 3 Distribution of the carbon emission
For the categorical variables the graphical representation has been used and the results are
shown below.
6 | P a g e
For the categorical variables the graphical representation has been used and the results are
shown below.
6 | P a g e
⊘ This is a preview!⊘
Do you want full access?
Subscribe today to unlock all pages.

Trusted by 1+ million students worldwide

United Kingdom USA
0.0
10.0
20.0
30.0
40.0
50.0
60.0
Country
Figure 4 Country wise distribution of the firms
The country wise distribution of the firms shows that there are 50% firms from the United
Kingdom and other 50 % from the USA. It shows that all the firms in the current research are
from the developed countries. In 2015 most of the countries around the world has signed the
paris climate change agreement which was aimed to reduce the emission the carbon in the
environment and it was a global effort towards the climate change. However in the recent
time USA is showing the intention to withdraw from the agreement. However UK has been a
great supporter of the Paris agreement.(Hai-BinZhang et al., 2017).
Senior manager Board Other manager
0.0
10.0
20.0
30.0
40.0
50.0
60.0
70.0
80.0
Highest level of responsibility
Figure 5 Highest level of responsibility
7 | P a g e
0.0
10.0
20.0
30.0
40.0
50.0
60.0
Country
Figure 4 Country wise distribution of the firms
The country wise distribution of the firms shows that there are 50% firms from the United
Kingdom and other 50 % from the USA. It shows that all the firms in the current research are
from the developed countries. In 2015 most of the countries around the world has signed the
paris climate change agreement which was aimed to reduce the emission the carbon in the
environment and it was a global effort towards the climate change. However in the recent
time USA is showing the intention to withdraw from the agreement. However UK has been a
great supporter of the Paris agreement.(Hai-BinZhang et al., 2017).
Senior manager Board Other manager
0.0
10.0
20.0
30.0
40.0
50.0
60.0
70.0
80.0
Highest level of responsibility
Figure 5 Highest level of responsibility
7 | P a g e
Paraphrase This Document
Need a fresh take? Get an instant paraphrase of this document with our AI Paraphraser

Another important variable in the research is to examine who is responsible for the emission
of carbon by the firm. This is the indication for the seriousness of the firm towards the carbon
emission. If the firm is serious about the carbon emission, the highest authority will take the
responsibility and vice versa. As shown in the figure above in most of the firm the board has
the highest level of responsibility. This indicates that most of the firms are serious so the
highest responsibility has been given to the highest authority.
As shown in the above figure for most of the firms the board is the highest authority
responsible for the climate changes issues. One of the major reason for the same is that
pressure from the government to comply with the climate change regulations. Especially the
government in the developed countries have strict regulations about the environment related
regulations. So, the firms are pressurized to take the decision from the highest level. The
board are the highest decision making body in every firm. Since climate change is the very
sensitive issue, it is better to have the decision from the highest level which also includes the
environment experts in most of the firm.
Yes No
0.0
10.0
20.0
30.0
40.0
50.0
60.0
70.0
80.0
Incentives provided forachieving climate change
issues
Figure 6 Incentive for achieving the climate change issues
Results show that more than 70 % of the firm provides incentives to its employees or
department who achieve the target for the carbon emission. Providing incentive may lead to
less carbon emission which has been shown in the previous researches also.
8 | P a g e

yes No
0.0
10.0
20.0
30.0
40.0
50.0
60.0
70.0
80.0
90.0
100.0
Climate change taken into consideration while making the
busines strategies
Figure 7 Climate change taken into consideration while making the business strategies.
As shown in the figure above in more than 80 % of the firm the climate change is taken into
consideration while making the business strategies. This also indicates that the firms are
making efforts to reduce the carbon emission. However, the intention of USA from the Paris
agreement may have negative effect on the efforts made by other countries as USA is one of
the leading sources for carbon emission.
In this case the percentage of firms are higher who includes the climate change while taking
into consideration the business strategies. One of the major reason for that is the pressure
from the government about the carbon emission. As discussed earlier also the government in
the developed countries are strict about the environmental issues. Almost all the projects are
studies from the environmental prospective also then only the permission is allowed to start
the project. The punishment for violation of the environment regulation is also very high.
This has led to firms, especially in the manufacturing sector, to include the climate change in
their business strategies. One of the implication of such provisions is that, now the
manufacturing units are shifted to the developing countries where the environmental
regulations are less strict.
Data Analysis - Inferential: (Assessed)
Apart from the descriptive statistics, inferential statistics will also be conducted using the
same variables as discussed in the previous section. The inferential analysis will include the
following:
T-Test
9 | P a g e
⊘ This is a preview!⊘
Do you want full access?
Subscribe today to unlock all pages.

Trusted by 1+ million students worldwide

The t test is used to examine whether there is statistical difference in means of two samples
which follows the normal distribution. If the variables do not follow the normal distribution
then the t test cannot be conducted. The t test can only be conducted between the two groups
which is one of its limitations.
ANOVA
ANOVA is similar to the t-test. The only difference is that the ANOVA test can be used
when there are more than two groups for which the difference in the mean has to be
calculated. It is one of the most popular inferential technique which has been used in wide
range of subjects.
Statistical software
For the inferential analysis the SPSS software will be used. The software allows the
researcher to conduct various types of descriptive and the inferential analysis. The analysis
can be conducted either by directly writing the syntax or the researcher can select the option
from the drop down menu to conduct the test.
List of references
Bryman, A. and Bell, E. (2011) Business Research Methods 3e. Oxford University Press.
Burnett, J. W. (2009) Economic Growth and Environmental Degradation. Athens.
Flick, U. (2011) Introducing Research Methodology: A Beginner’s Guide to Doing a
Research Project. SAGE Publications.
Gaur, A. S. and Gaur, S. S. (2006) Statistical Methods for Practice and Research: A Guide to
Data Analysis Using SPSS. Response Books, Sage Publications India, New Delhi.
Greenland, S. et al. (2016) ‘Statistical tests, P values, confidence intervals, and power: a
guide to misinterpretations’, European Journal of Epidemiology, 31, pp. 337 – 350.
Hai-BinZhang et al. (2017) ‘U.S. withdrawal from the Paris Agreement: Reasons, impacts,
and China’s response’, Advances in Climate Change Research, 8(4), pp. 220–225.
Kumar, R. (2014) Research Methodology: A Step-by-Step Guide for Beginners. SAGE
Publications.
Millimet, D. L. and Roy, J. (2011) Three New Empirical Tests of the Pollution Haven
Hypothesis When Environmental Regulation is Endogenous. Bonn.
Rajasekar, S., Philominathan, P. and Chinnathambi, V. (2013) Research methodology.
Tamilnadu India.
10 | P a g e
Paraphrase This Document
Need a fresh take? Get an instant paraphrase of this document with our AI Paraphraser

Saunders, M., Lewis, P. and Thornhill, A. (2007) Research methods for business students
fifth edition. 3rd edn. Harlow: Prentice Hall. Available at:
https://is.vsfs.cz/el/6410/leto2014/BA_BSeBM/um/Research_Methods_for_Business_Studen
ts__5th_Edition.pdf.
Stewart, D. W. and Kamins, M. A. (1993) Secondary Research: Information Sources and
Methods. 2nd edn. Newbury Park, CA: SAGE.
VARGAS-HERNÁNDEZ, J. G., LEÓN, A. de and VALDÉZ, A. (2011) ‘RESEARCH
METHODOLOGY STRATEGIES IN STRATEGIC MANAGEMENT’, African Journal of
Social Sciences, 2.
Zhang, Z. et al. (2016) ‘The Decoupling of Resource Consumption and Environmental
Impact from Economic Growth in China: Spatial Pattern and Temporal Trend’, pp. 1–13.
11 | P a g e
1 out of 11
Related Documents

Your All-in-One AI-Powered Toolkit for Academic Success.
+13062052269
info@desklib.com
Available 24*7 on WhatsApp / Email
Unlock your academic potential
Copyright © 2020–2025 A2Z Services. All Rights Reserved. Developed and managed by ZUCOL.