MKT202: Designing Data Collection Tools for Customer Satisfaction

Verified

Added on  2023/06/08

|13
|1272
|165
Practical Assignment
AI Summary
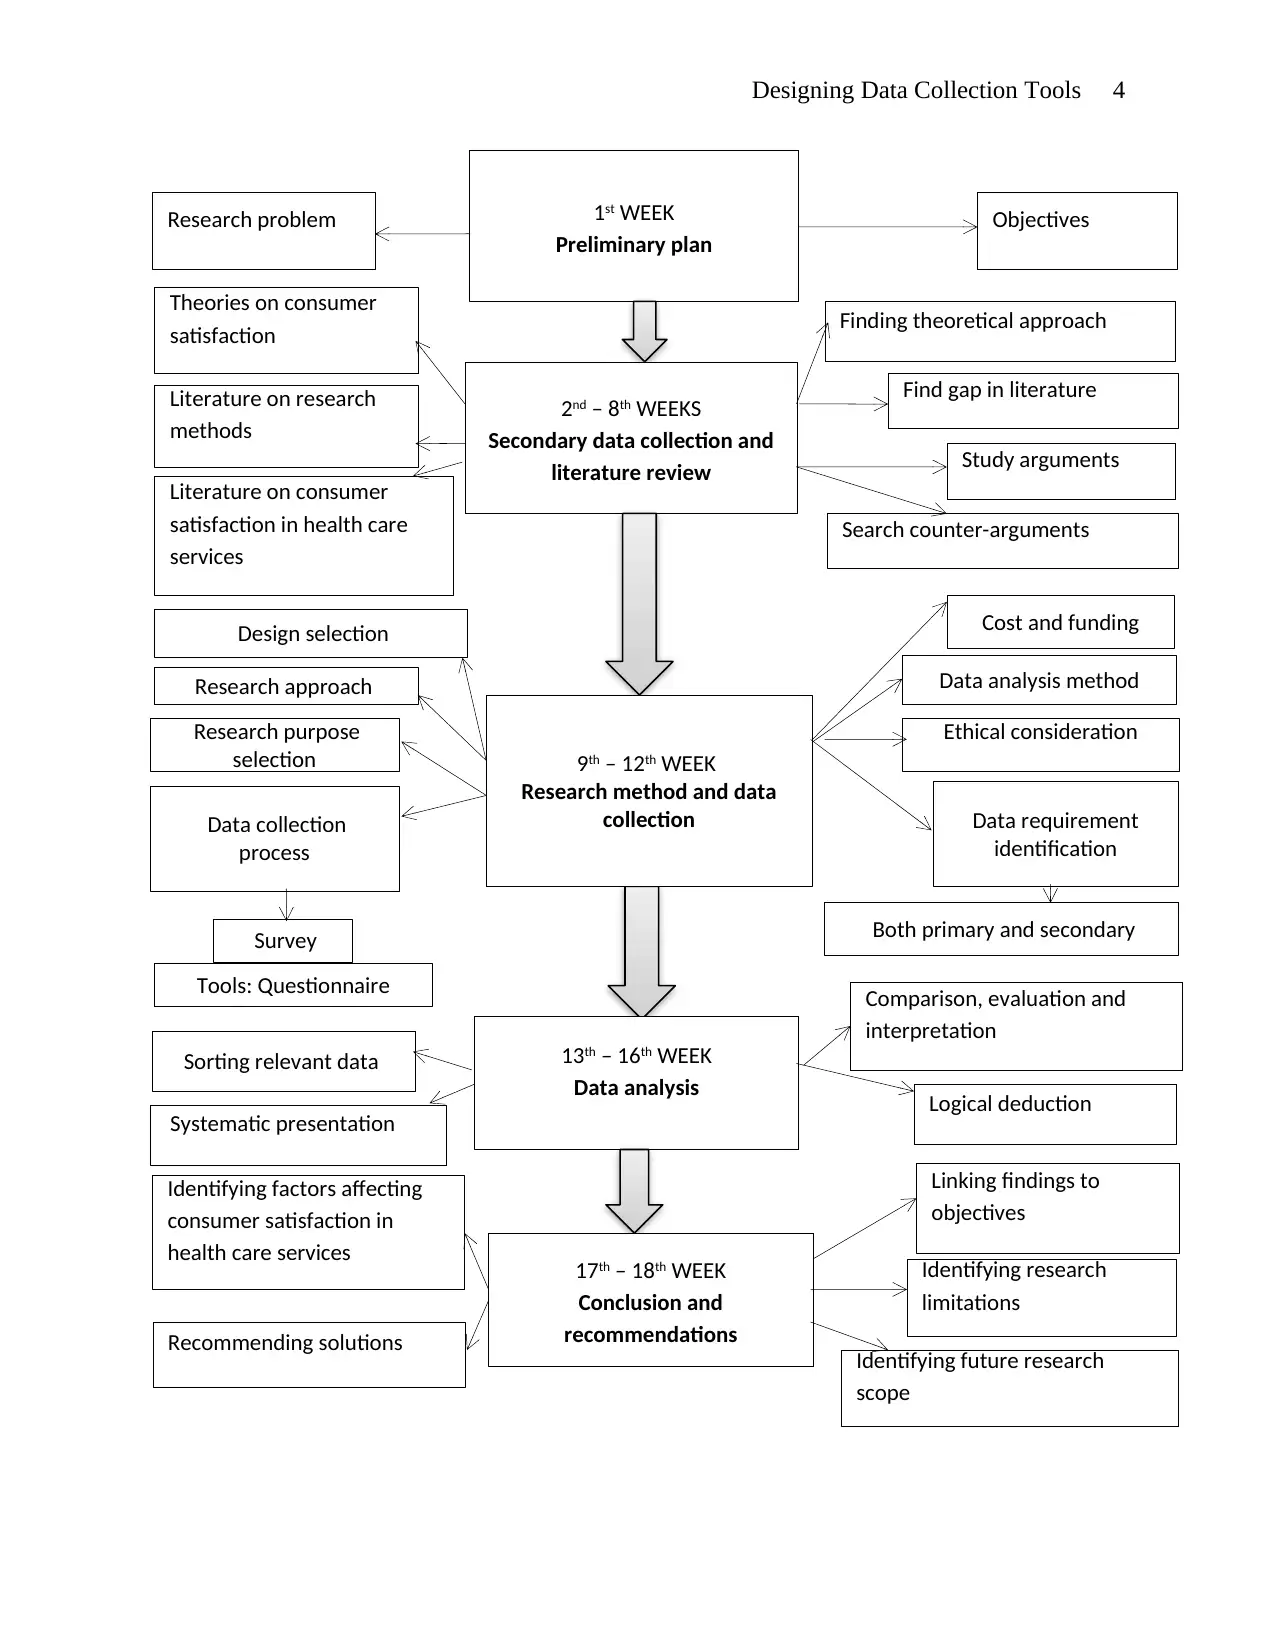
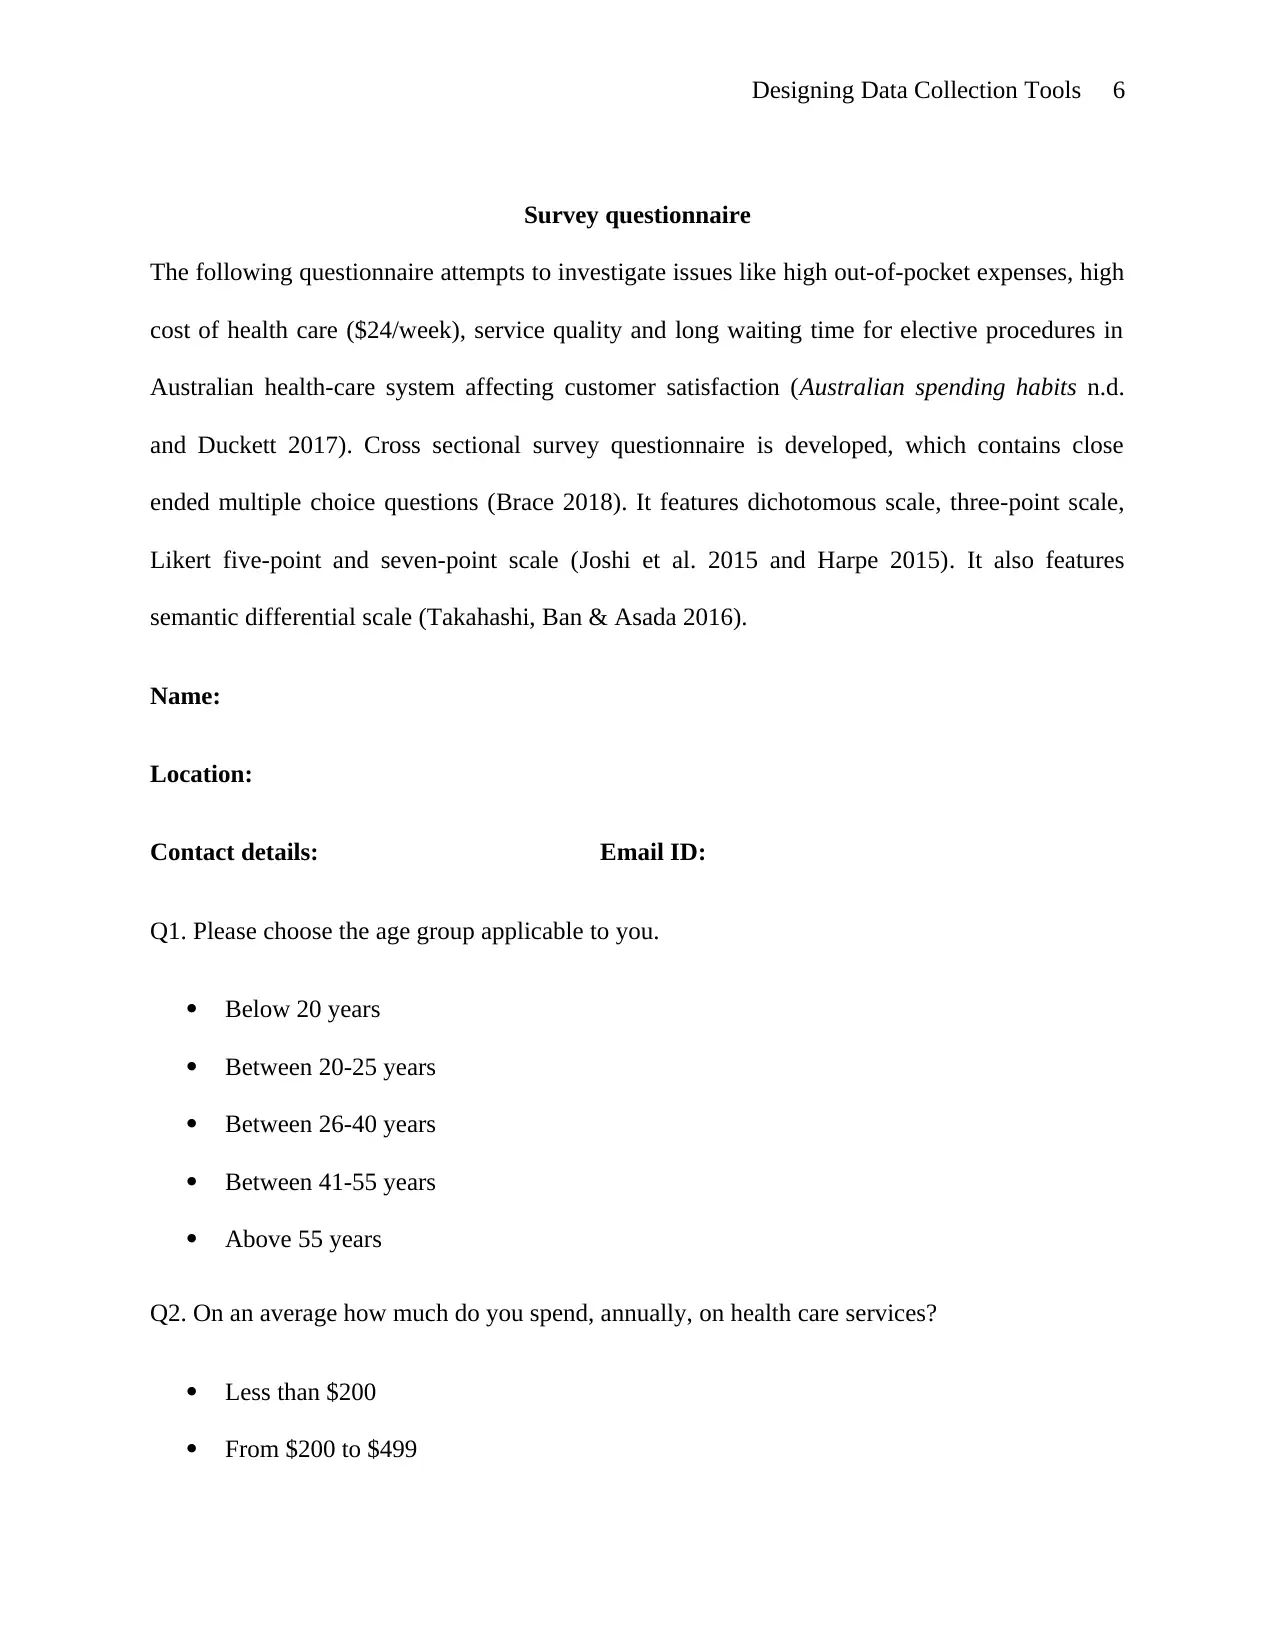
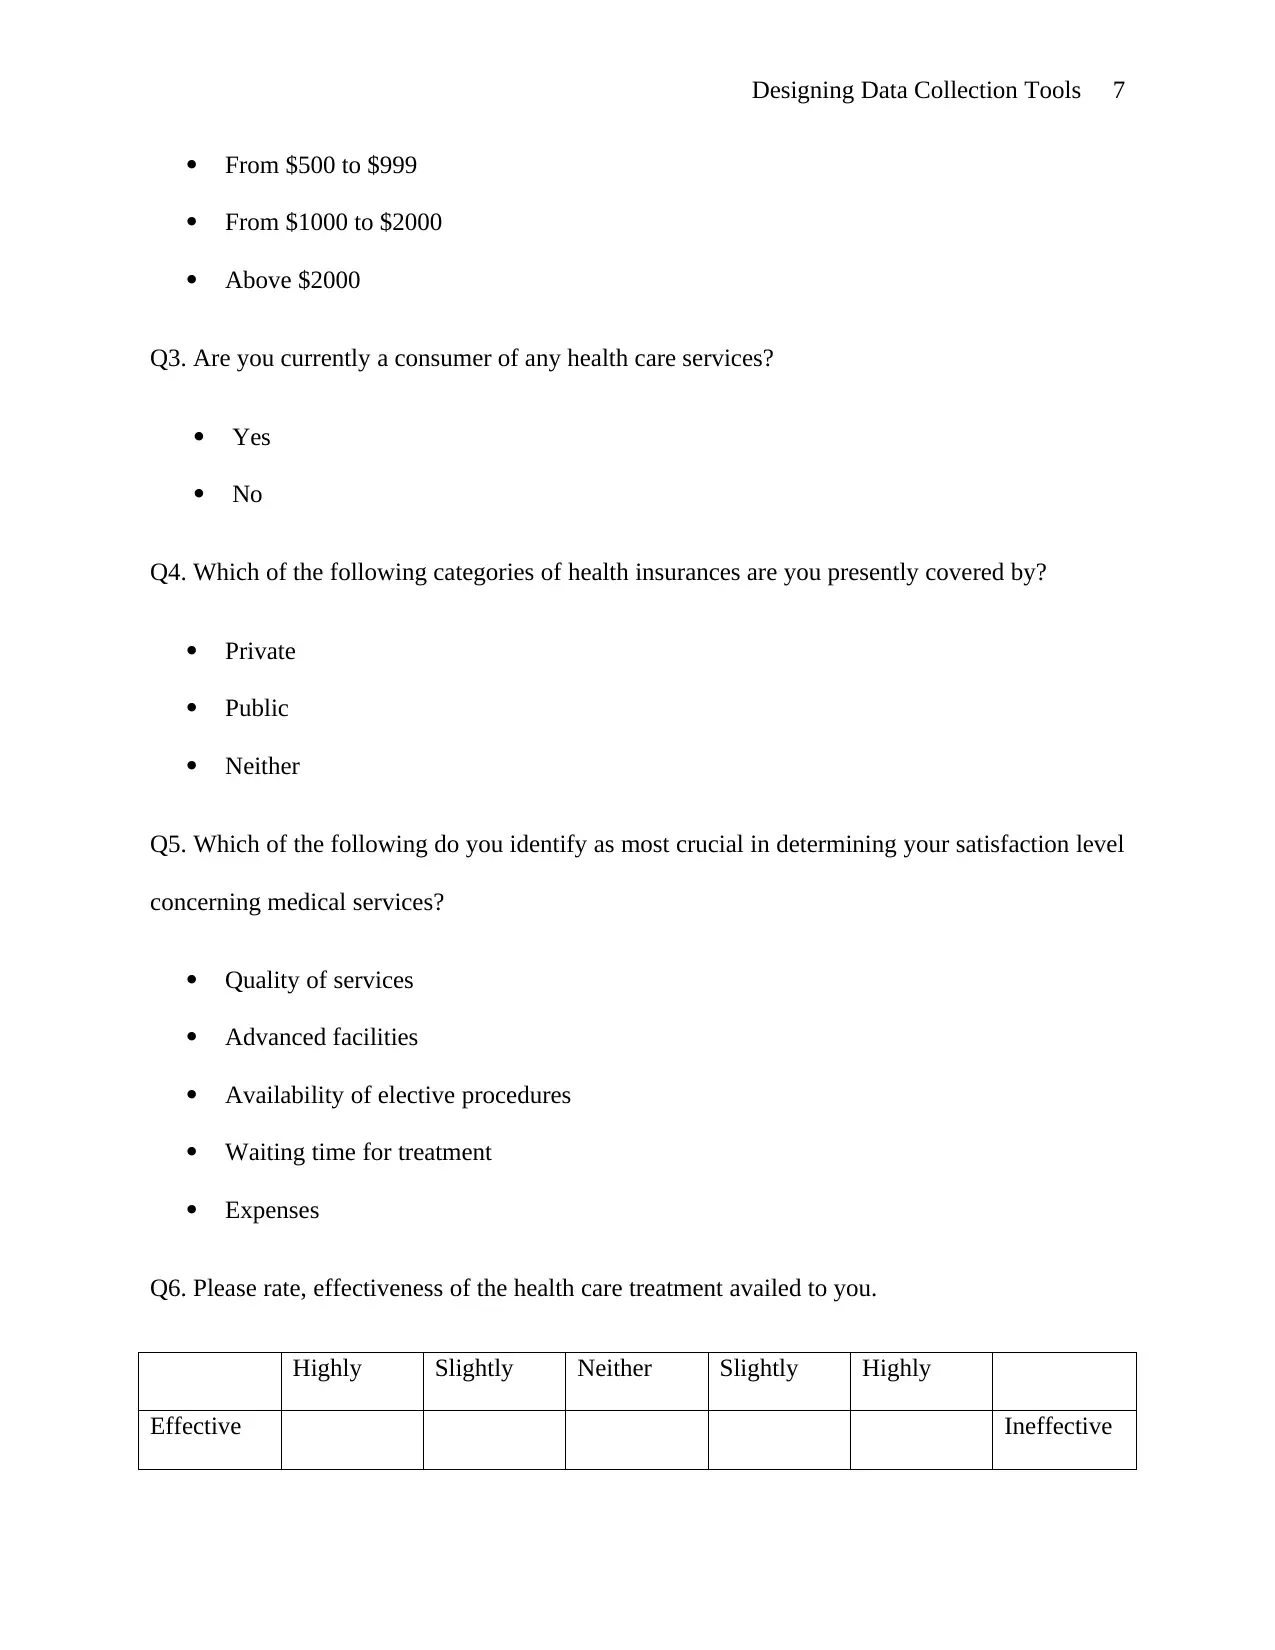
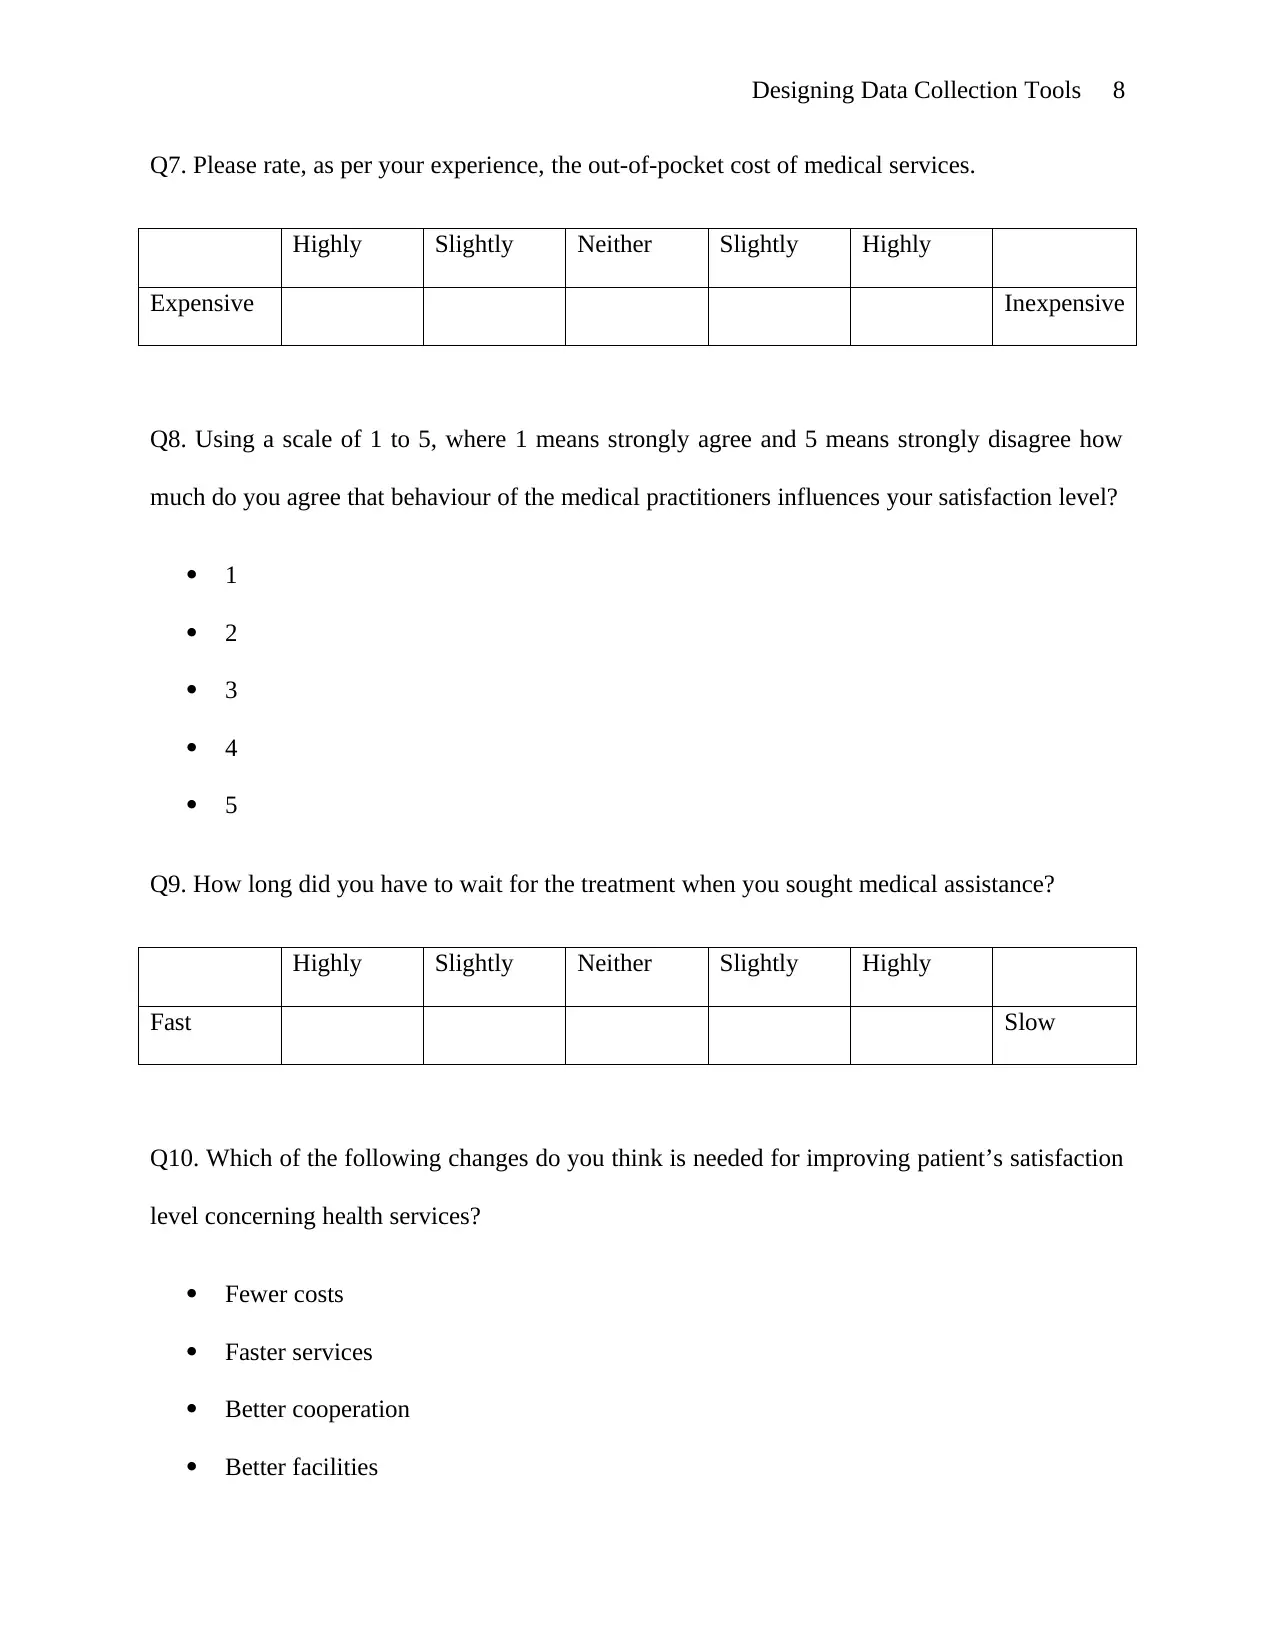
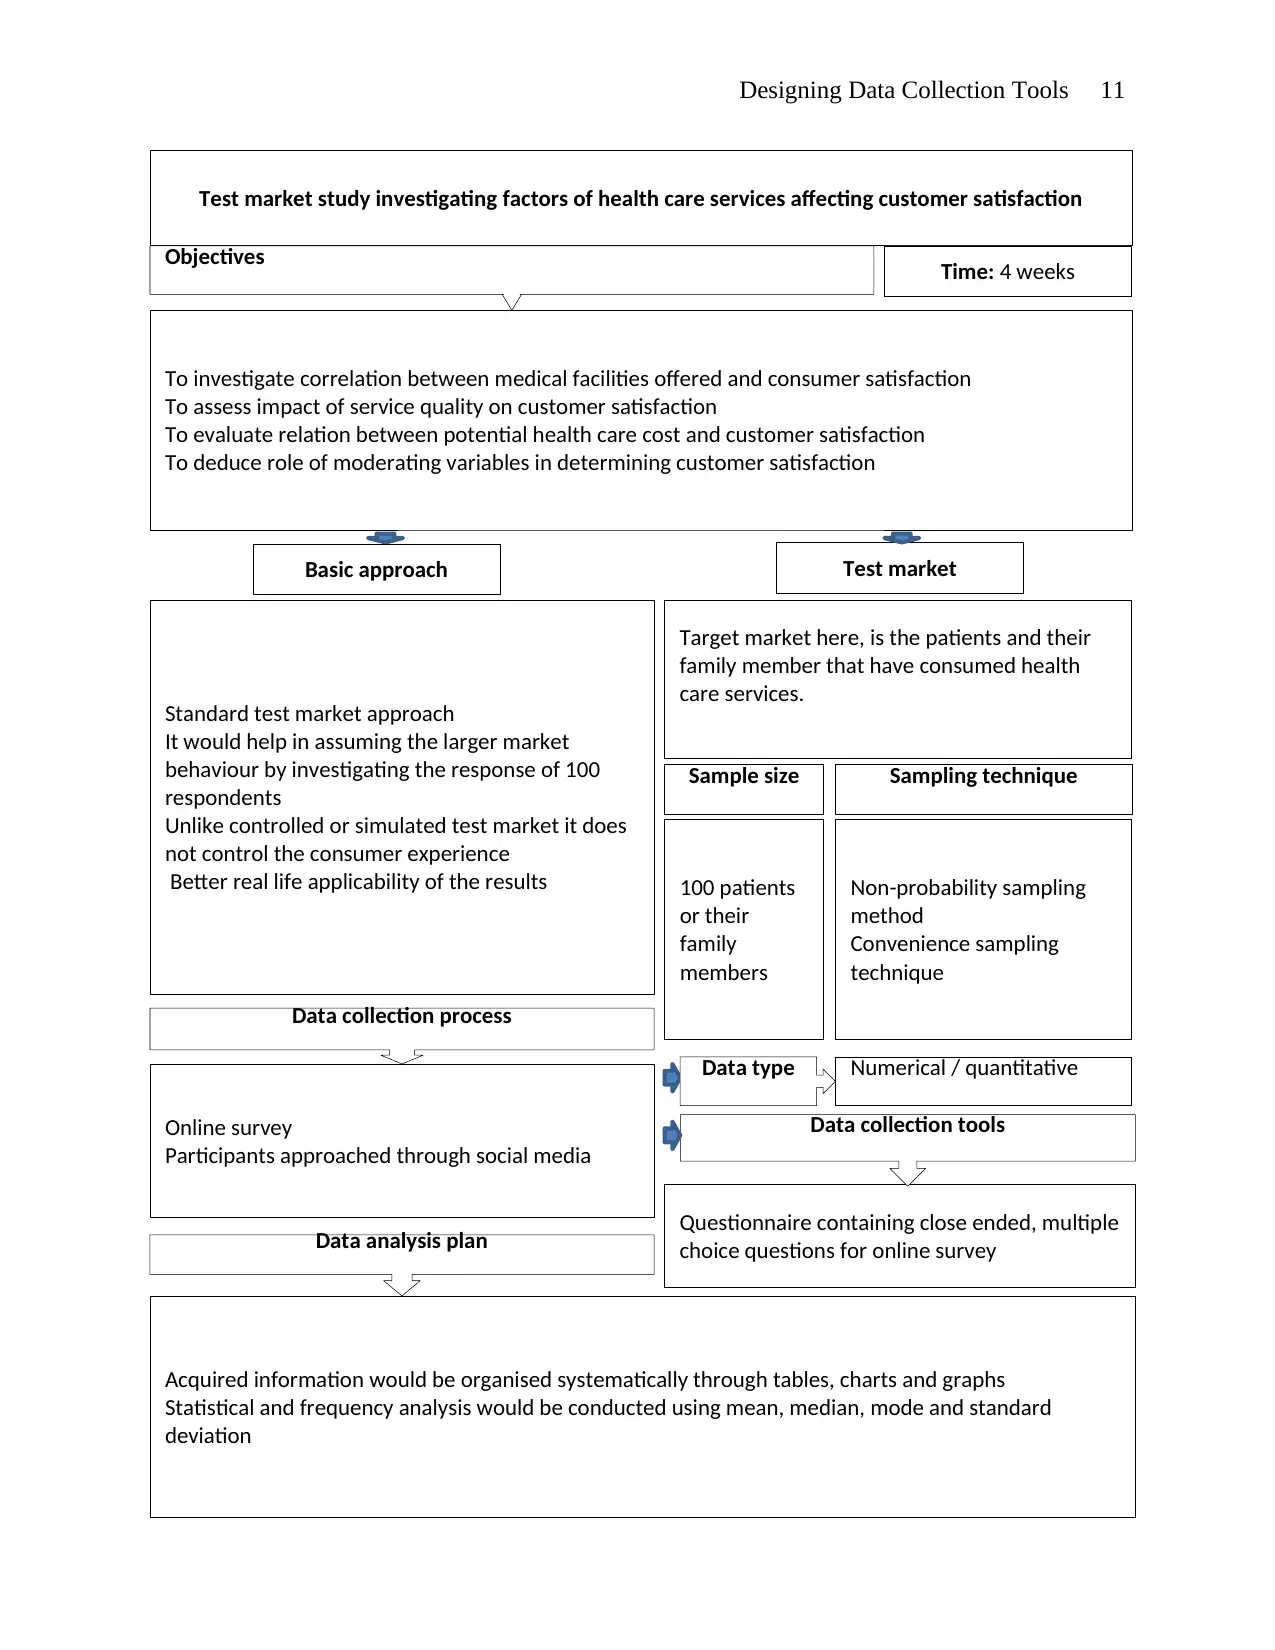
This assignment focuses on designing data collection tools to investigate the factors influencing customer satisfaction within healthcare services. The student begins with a detailed research plan, outlining objectives, timelines, and benchmarks for the study. A comprehensive survey questionnaire is then developed, incorporating various scales like dichotomous, three-point, Likert, and semantic differential scales to gather data on patient experiences, costs, service quality, and satisfaction levels. Finally, the assignment includes a test market study diagram, detailing the objectives, approach, sample size, data collection process, and analysis plan to assess consumer behavior in response to different healthcare service factors. The research aims to identify key drivers of customer satisfaction, such as service quality, cost, and waiting times, providing valuable insights for healthcare providers.
Document Page
Designing Data Collection Tools 1
DESIGNING DATA COLLECTION TOOLS FOR INVESTIGATING FACTORS
INFLUENCING CUSTOMER SATISFACTION IN HEALTH CARE SERVICES
By (Name)
Name of the class (Course)
Professor (Tutor)
Name of the School (University)
City and state where it is located
Date
tabler-icon-diamond-filled.svg

Paraphrase This Document

Need a fresh take? Get an instant paraphrase of this document with our AI Paraphraser
Document Page
Designing Data Collection Tools 2
Contents
Research plan...................................................................................................................................3
Survey questionnaire.......................................................................................................................5
Test market study.............................................................................................................................9
Reference list.................................................................................................................................12
Document Page
Designing Data Collection Tools 3
Research plan
Document Page
Designing Data Collection Tools 4
Study arguments
Search counter-arguments
Literature on consumer
satisfaction in health care
services
1st WEEK
Preliminary plan
Research problem Objectives
2nd – 8th WEEKS
Secondary data collection and
literature review
Finding theoretical approach
Find gap in literature
Theories on consumer
satisfaction
Literature on research
methods
9th – 12th WEEK
Research method and data
collection
Cost and funding
Data analysis method
Ethical consideration
Data requirement
identification
Both primary and secondary
Design selection
Research approach
Research purpose
selection
Data collection
process
Survey
Tools: Questionnaire
13th – 16th WEEK
Data analysis
Sorting relevant data
Systematic presentation
Comparison, evaluation and
interpretation
Logical deduction
17th – 18th WEEK
Conclusion and
recommendations
Identifying factors affecting
consumer satisfaction in
health care services
Recommending solutions
Linking findings to
objectives
Identifying research
limitations
Identifying future research
scope
tabler-icon-diamond-filled.svg

Paraphrase This Document

Need a fresh take? Get an instant paraphrase of this document with our AI Paraphraser
Document Page
Designing Data Collection Tools 5
Figure 1: Research plan with timeline and benchmarks
(Source: created by student)
Document Page
Designing Data Collection Tools 6
Survey questionnaire
The following questionnaire attempts to investigate issues like high out-of-pocket expenses, high
cost of health care ($24/week), service quality and long waiting time for elective procedures in
Australian health-care system affecting customer satisfaction (Australian spending habits n.d.
and Duckett 2017). Cross sectional survey questionnaire is developed, which contains close
ended multiple choice questions (Brace 2018). It features dichotomous scale, three-point scale,
Likert five-point and seven-point scale (Joshi et al. 2015 and Harpe 2015). It also features
semantic differential scale (Takahashi, Ban & Asada 2016).
Name:
Location:
Contact details: Email ID:
Q1. Please choose the age group applicable to you.
Below 20 years
Between 20-25 years
Between 26-40 years
Between 41-55 years
Above 55 years
Q2. On an average how much do you spend, annually, on health care services?
Less than $200
From $200 to $499
Document Page
Designing Data Collection Tools 7
From $500 to $999
From $1000 to $2000
Above $2000
Q3. Are you currently a consumer of any health care services?
Yes
No
Q4. Which of the following categories of health insurances are you presently covered by?
Private
Public
Neither
Q5. Which of the following do you identify as most crucial in determining your satisfaction level
concerning medical services?
Quality of services
Advanced facilities
Availability of elective procedures
Waiting time for treatment
Expenses
Q6. Please rate, effectiveness of the health care treatment availed to you.
Highly Slightly Neither Slightly Highly
Effective Ineffective
tabler-icon-diamond-filled.svg

Paraphrase This Document

Need a fresh take? Get an instant paraphrase of this document with our AI Paraphraser
Document Page
Designing Data Collection Tools 8
Q7. Please rate, as per your experience, the out-of-pocket cost of medical services.
Highly Slightly Neither Slightly Highly
Expensive Inexpensive
Q8. Using a scale of 1 to 5, where 1 means strongly agree and 5 means strongly disagree how
much do you agree that behaviour of the medical practitioners influences your satisfaction level?
1
2
3
4
5
Q9. How long did you have to wait for the treatment when you sought medical assistance?
Highly Slightly Neither Slightly Highly
Fast Slow
Q10. Which of the following changes do you think is needed for improving patient’s satisfaction
level concerning health services?
Fewer costs
Faster services
Better cooperation
Better facilities
Document Page
Designing Data Collection Tools 9
Better service quality
Others
No improvement
Document Page
Designing Data Collection Tools 10
Test market study
The test market study allows a business corporation to observe the potential market behaviour
through testing the response of a microcosm of the real market towards a service, product or
change (Korotkov, Occhiocupo and Simkin 2013 and McDaniel & Gates 2018). Such test might
be effective in testing the effect of different factors of health care services on their consumers.
The following diagram represents the structure of a test market study for this research:
tabler-icon-diamond-filled.svg

Paraphrase This Document

Need a fresh take? Get an instant paraphrase of this document with our AI Paraphraser
Document Page
Designing Data Collection Tools 11
Test market study investigating factors of health care services affecting customer satisfaction
To investigate correlation between medical facilities offered and consumer satisfaction
To assess impact of service quality on customer satisfaction
To evaluate relation between potential health care cost and customer satisfaction
To deduce role of moderating variables in determining customer satisfaction
Time: 4 weeks
Standard test market approach
It would help in assuming the larger market
behaviour by investigating the response of 100
respondents
Unlike controlled or simulated test market it does
not control the consumer experience
Better real life applicability of the results
Basic approach Test market
Target market here, is the patients and their
family member that have consumed health
care services.
Sample size Sampling technique
100 patients
or their
family
members
Non-probability sampling
method
Convenience sampling
technique
Online survey
Participants approached through social media
Numerical / quantitative
Questionnaire containing close ended, multiple
choice questions for online survey
Acquired information would be organised systematically through tables, charts and graphs
Statistical and frequency analysis would be conducted using mean, median, mode and standard
deviation
Data type
Data collection tools
Data analysis plan
Objectives
Data collection process
Document Page
Designing Data Collection Tools 12
Figure 2: Test market study diagram
(Created by student)
chevron_up_icon
1 out of 13
circle_padding
hide_on_mobile
zoom_out_icon
[object Object]