Data Driven for Business: Importance of Data Analysis and Trends
VerifiedAdded on 2022/11/30
|20
|3571
|328
AI Summary
This document discusses the importance of data analysis and trends in business decision making. It explores the impact of marketing campaigns on sales performance using econometric analysis. The findings are presented through graphs and data analysis. The document also provides steps to clean the data and justifies the analytical approach used.
Contribute Materials
Your contribution can guide someone’s learning journey. Share your
documents today.

Data driven for business
Secure Best Marks with AI Grader
Need help grading? Try our AI Grader for instant feedback on your assignments.
TABLE OF CONTENTS
INTRODUCTION...........................................................................................................................2
a) Key changes and trends leading to importance of data analysis.............................................2
b) Planning, summarizing and justifying the analytical approach...............................................3
c) Analysis...................................................................................................................................4
i. Presenting the steps to clean the data.......................................................................................4
ii. Presenting the findings............................................................................................................4
CONCLUSION................................................................................................................................8
i. Summary and Recommendations.............................................................................................8
ii. Critically evaluate the use of econometric analysis within Bangles to make effective
analysis of UK marketing campaign............................................................................................9
Summary of broad findings in Presentation.............................................................................10
REFERENCES..............................................................................................................................20
INTRODUCTION
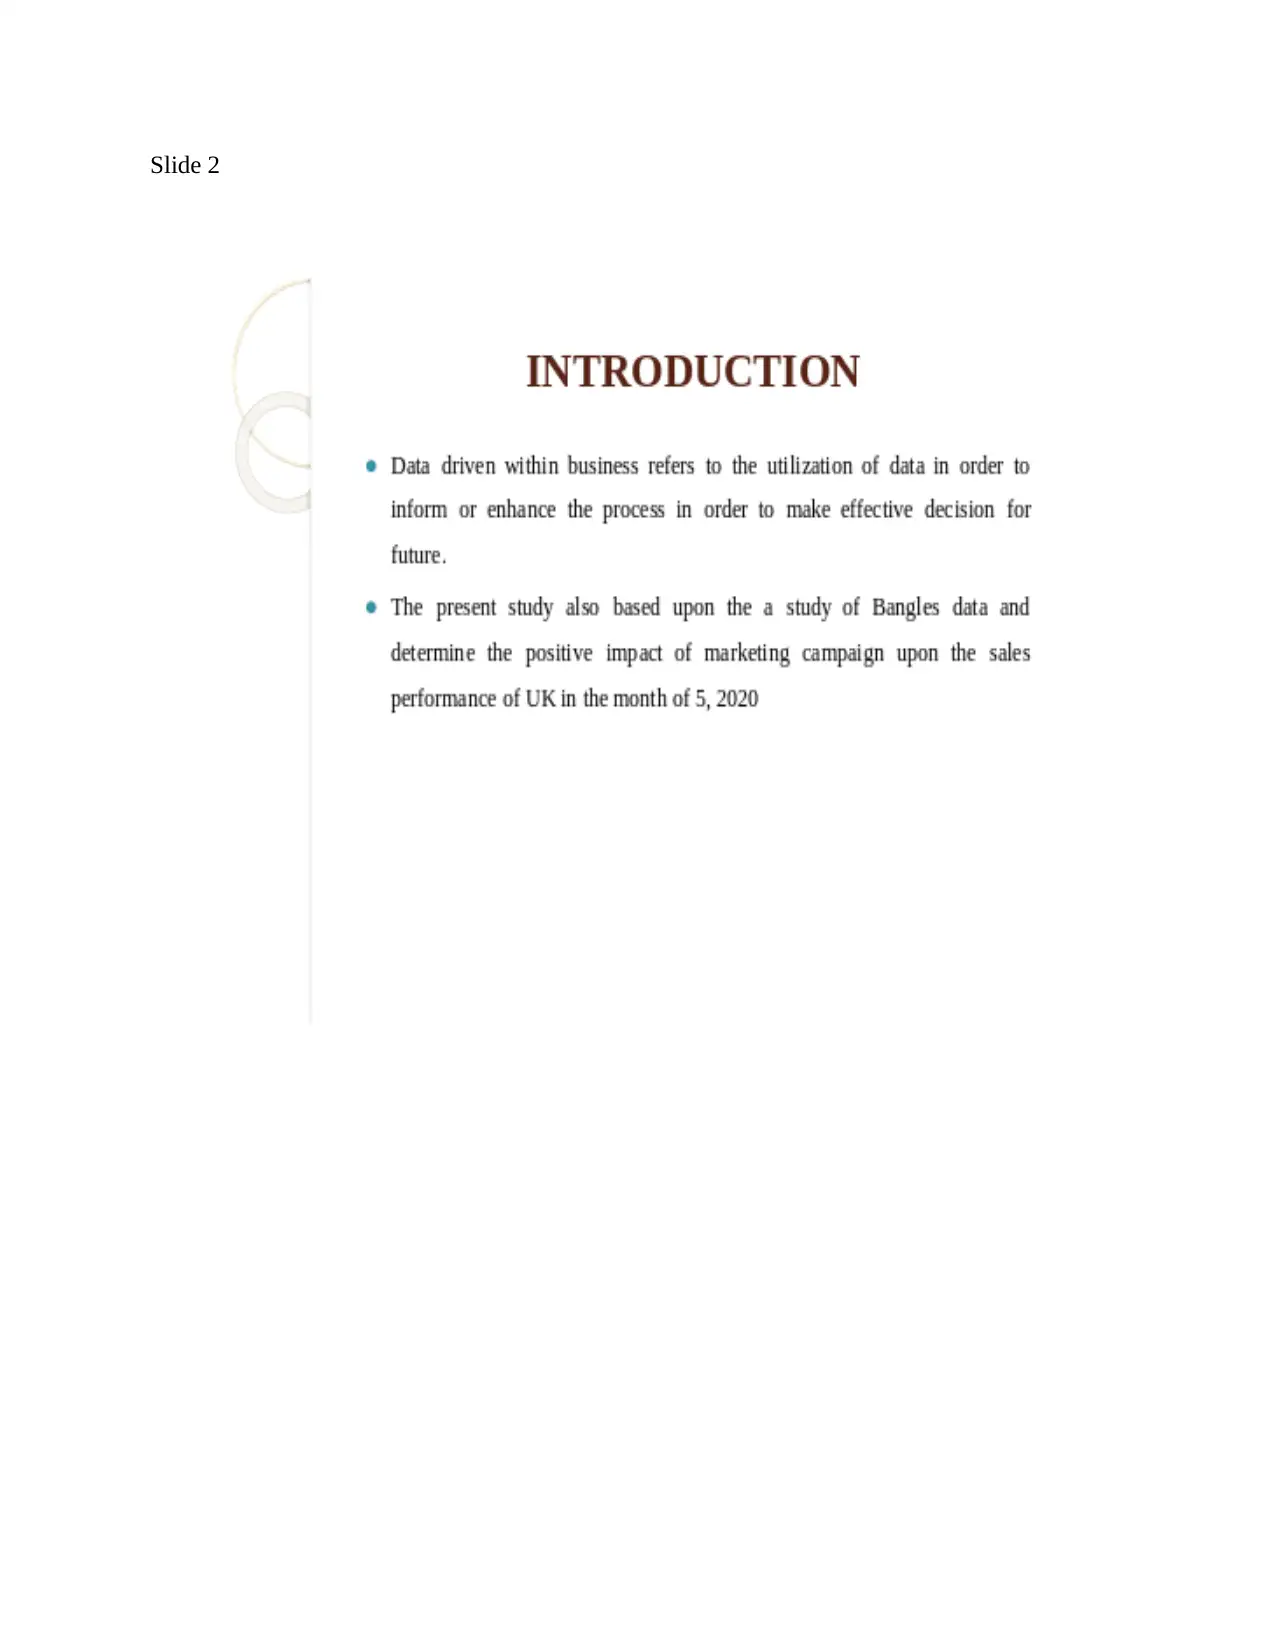
Data driven within business refers to the utilization of data in order to inform or enhance
the process in order to make effective decision for future. The present study also based upon the
a study of Bangles data and determine the positive impact of marketing campaign upon the sales
performance of UK in the month of 5, 2020. For that study will summarize the key changes and
trend that leading to increase the importance of data analysis within Bangles. Further, study will
justify the analytical approach which will used in order to answer the question. Also, by using
effective graphs and data, study will summarize the key point drawn from analysis. Lastly, it
would recommend the ways through which loopholes can be minimized and evaluating the use
of econometric analysis for UK marketing campaigns.
a) Key changes and trends leading to importance of data analysis
Data analysis helps in providing the users with the ability to identify the pattern or
trends with respect to the information given. The information gathered through this helps in
providing better knowledge to the user which results into undertaking effective and right
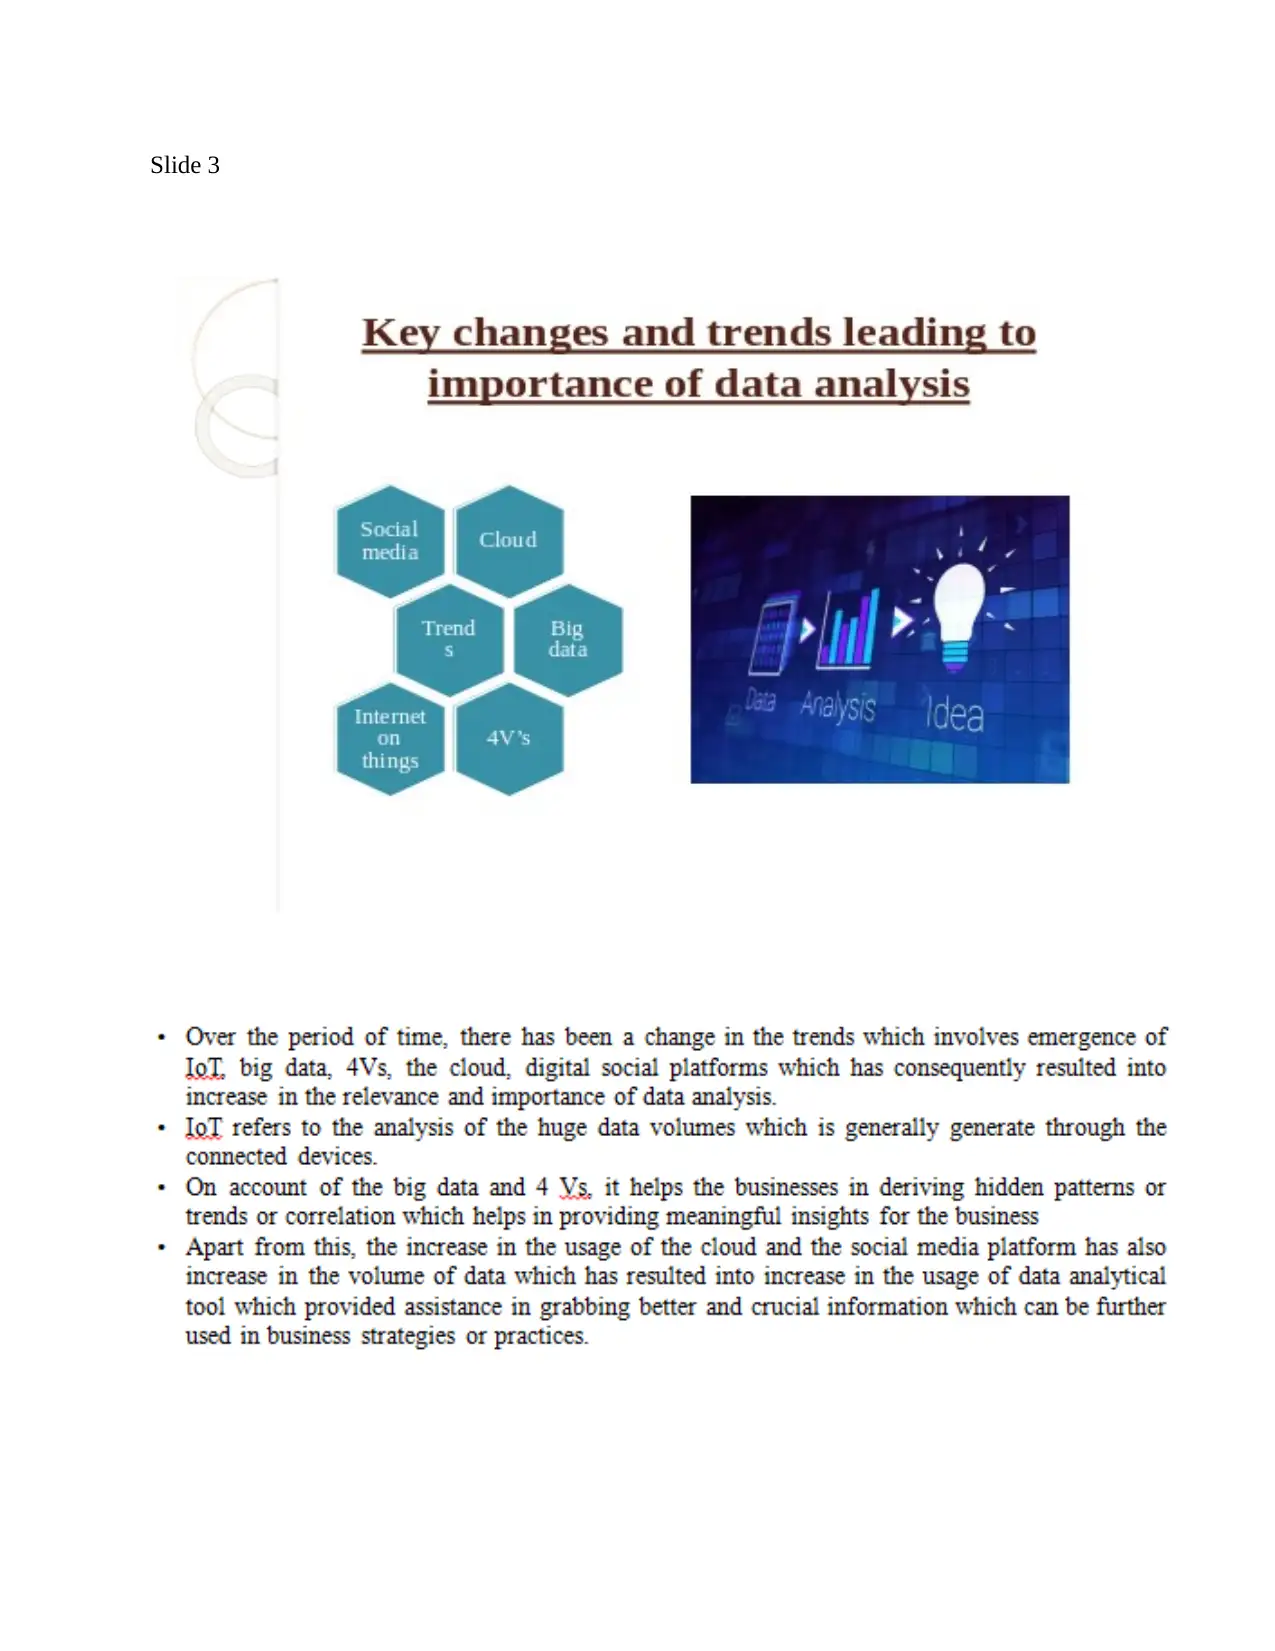
decisions with a sense of confidence. Over the period of time, there has been a change in the
trends which involves emergence of IoT, big data, 4Vs, the cloud, digital social platforms which
has consequently resulted into increase in the relevance and importance of data analysis. IoT
refers to the analysis of the huge data volumes which is generally generate through the connected
devices. A bangle organization can acquire various benefits from it like optimizing the operation,
control processes along with better engaging with the customers. The combination of IoT and
data analytics is very beneficial which results into creating favorable conditions for the
organizations pertaining to the decision making. On account of the big data and 4 Vs, it helps the
businesses in deriving hidden patterns or trends or correlation which helps in providing
meaningful insights for the business (Big Data Analytics. 2021). This has helped in identifying
the hidden pattern or the relations among the various variables which the management might not
be able to identify by mere looking at the numbers. It takes into consideration 4 dimensions
which are: volume, variety, velocity and veracity based upon which the big data is segmented.
Apart from this, the increase in the usage of the cloud and the social media platform has also
increase in the volume of data which has resulted into increase in the usage of data analytical
Data driven within business refers to the utilization of data in order to inform or enhance
the process in order to make effective decision for future. The present study also based upon the
a study of Bangles data and determine the positive impact of marketing campaign upon the sales
performance of UK in the month of 5, 2020. For that study will summarize the key changes and
trend that leading to increase the importance of data analysis within Bangles. Further, study will
justify the analytical approach which will used in order to answer the question. Also, by using
effective graphs and data, study will summarize the key point drawn from analysis. Lastly, it
would recommend the ways through which loopholes can be minimized and evaluating the use
of econometric analysis for UK marketing campaigns.
a) Key changes and trends leading to importance of data analysis
Data analysis helps in providing the users with the ability to identify the pattern or
trends with respect to the information given. The information gathered through this helps in
providing better knowledge to the user which results into undertaking effective and right
decisions with a sense of confidence. Over the period of time, there has been a change in the
trends which involves emergence of IoT, big data, 4Vs, the cloud, digital social platforms which
has consequently resulted into increase in the relevance and importance of data analysis. IoT
refers to the analysis of the huge data volumes which is generally generate through the connected
devices. A bangle organization can acquire various benefits from it like optimizing the operation,
control processes along with better engaging with the customers. The combination of IoT and
data analytics is very beneficial which results into creating favorable conditions for the
organizations pertaining to the decision making. On account of the big data and 4 Vs, it helps the
businesses in deriving hidden patterns or trends or correlation which helps in providing
meaningful insights for the business (Big Data Analytics. 2021). This has helped in identifying
the hidden pattern or the relations among the various variables which the management might not
be able to identify by mere looking at the numbers. It takes into consideration 4 dimensions
which are: volume, variety, velocity and veracity based upon which the big data is segmented.
Apart from this, the increase in the usage of the cloud and the social media platform has also
increase in the volume of data which has resulted into increase in the usage of data analytical
tool which provided assistance in grabbing better and crucial information which can be further
used in business strategies or practices.
The data analytics is adding value in every industry including bangle companies, as data
analysis helps in extracting and manipulate the data from the multiple sources in order to provide
immediate and relevant insight which supports the organization in undertaking better and quick
decisions (Data Analysis: What, How, and Why to Do Data Analysis for Your Organization.
2019). This results into adding value to the benefits in terms in formulation of better and
effective business strategies which is helps in further enhancing the performance based upon the
key ideas derived the information gathered. It helps in avoiding the unnecessary cost and make
efficient and appropriate usage of the resources.
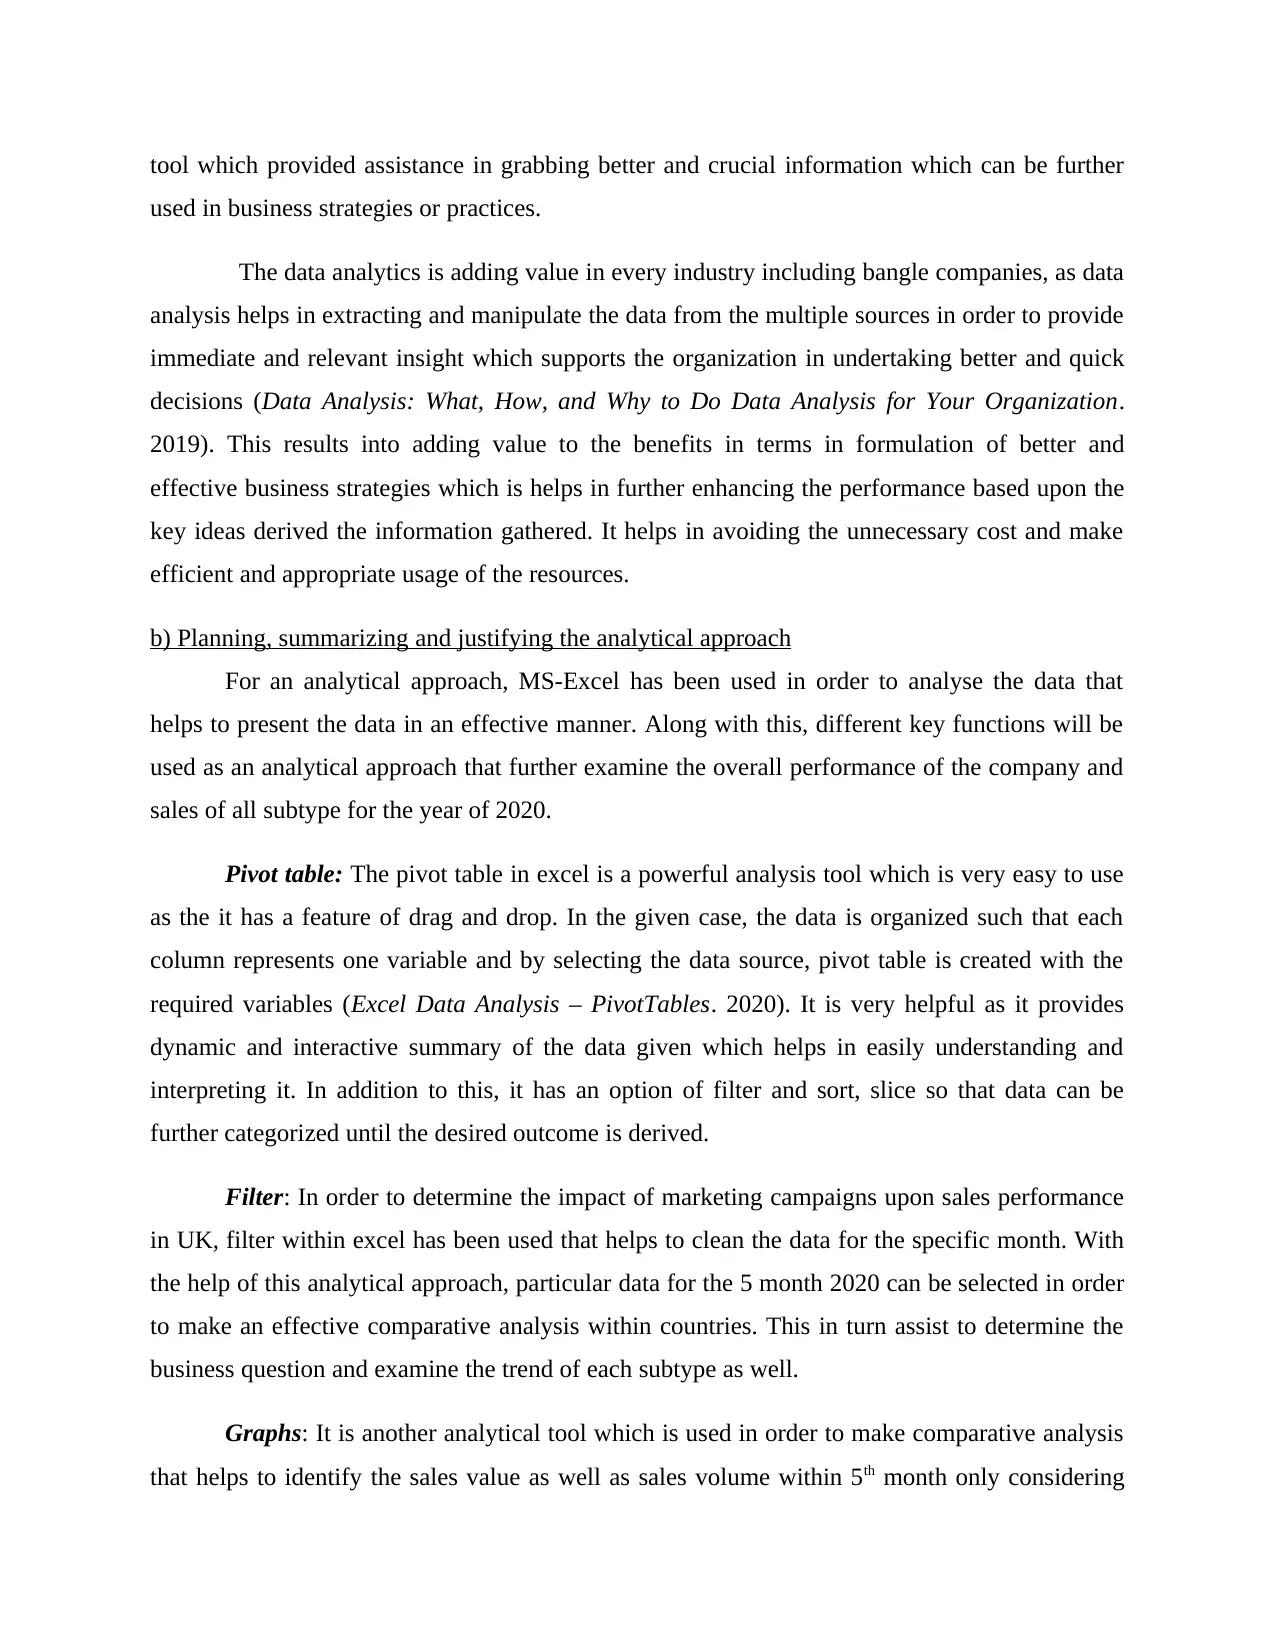
b) Planning, summarizing and justifying the analytical approach
For an analytical approach, MS-Excel has been used in order to analyse the data that
helps to present the data in an effective manner. Along with this, different key functions will be
used as an analytical approach that further examine the overall performance of the company and
sales of all subtype for the year of 2020.
Pivot table: The pivot table in excel is a powerful analysis tool which is very easy to use
as the it has a feature of drag and drop. In the given case, the data is organized such that each
column represents one variable and by selecting the data source, pivot table is created with the
required variables (Excel Data Analysis – PivotTables. 2020). It is very helpful as it provides
dynamic and interactive summary of the data given which helps in easily understanding and
interpreting it. In addition to this, it has an option of filter and sort, slice so that data can be
further categorized until the desired outcome is derived.
Filter: In order to determine the impact of marketing campaigns upon sales performance
in UK, filter within excel has been used that helps to clean the data for the specific month. With
the help of this analytical approach, particular data for the 5 month 2020 can be selected in order
to make an effective comparative analysis within countries. This in turn assist to determine the
business question and examine the trend of each subtype as well.
Graphs: It is another analytical tool which is used in order to make comparative analysis
that helps to identify the sales value as well as sales volume within 5th month only considering
used in business strategies or practices.
The data analytics is adding value in every industry including bangle companies, as data
analysis helps in extracting and manipulate the data from the multiple sources in order to provide
immediate and relevant insight which supports the organization in undertaking better and quick
decisions (Data Analysis: What, How, and Why to Do Data Analysis for Your Organization.
2019). This results into adding value to the benefits in terms in formulation of better and
effective business strategies which is helps in further enhancing the performance based upon the
key ideas derived the information gathered. It helps in avoiding the unnecessary cost and make
efficient and appropriate usage of the resources.
b) Planning, summarizing and justifying the analytical approach
For an analytical approach, MS-Excel has been used in order to analyse the data that
helps to present the data in an effective manner. Along with this, different key functions will be
used as an analytical approach that further examine the overall performance of the company and
sales of all subtype for the year of 2020.
Pivot table: The pivot table in excel is a powerful analysis tool which is very easy to use
as the it has a feature of drag and drop. In the given case, the data is organized such that each
column represents one variable and by selecting the data source, pivot table is created with the
required variables (Excel Data Analysis – PivotTables. 2020). It is very helpful as it provides
dynamic and interactive summary of the data given which helps in easily understanding and
interpreting it. In addition to this, it has an option of filter and sort, slice so that data can be
further categorized until the desired outcome is derived.
Filter: In order to determine the impact of marketing campaigns upon sales performance
in UK, filter within excel has been used that helps to clean the data for the specific month. With
the help of this analytical approach, particular data for the 5 month 2020 can be selected in order
to make an effective comparative analysis within countries. This in turn assist to determine the
business question and examine the trend of each subtype as well.
Graphs: It is another analytical tool which is used in order to make comparative analysis
that helps to identify the sales value as well as sales volume within 5th month only considering
Secure Best Marks with AI Grader
Need help grading? Try our AI Grader for instant feedback on your assignments.
each subtype (Hossain and Hossain, 2021). Along with this, it is also analysed that through
comparative graphs, the data can be presented in an effective manner which assist to answer the
business question. Along with this, Bangles can determine the impact of sales volume upon the
overall performance of company.
c) Analysis
i. Presenting the steps to clean the data
Following steps will be used in order to clean the data, as mentioned below:
Step 1: using pivot table, entire data will be selected and drag the elements of table to its
respective areas such that market has been drag to row, months in column etc. This will helps to
determine the comparative analysis of all countries within entire year
Step 2: in order to clear the data, use filter from home tab and select the data for the month of 5th,
2020 within all countries. This in turn assists to examine sales value and volume of each subtype
for 5th month by comparing all countries.
Step 3: By selecting the data, graphs must be drawn that helps to present the findings in an
effective manner.
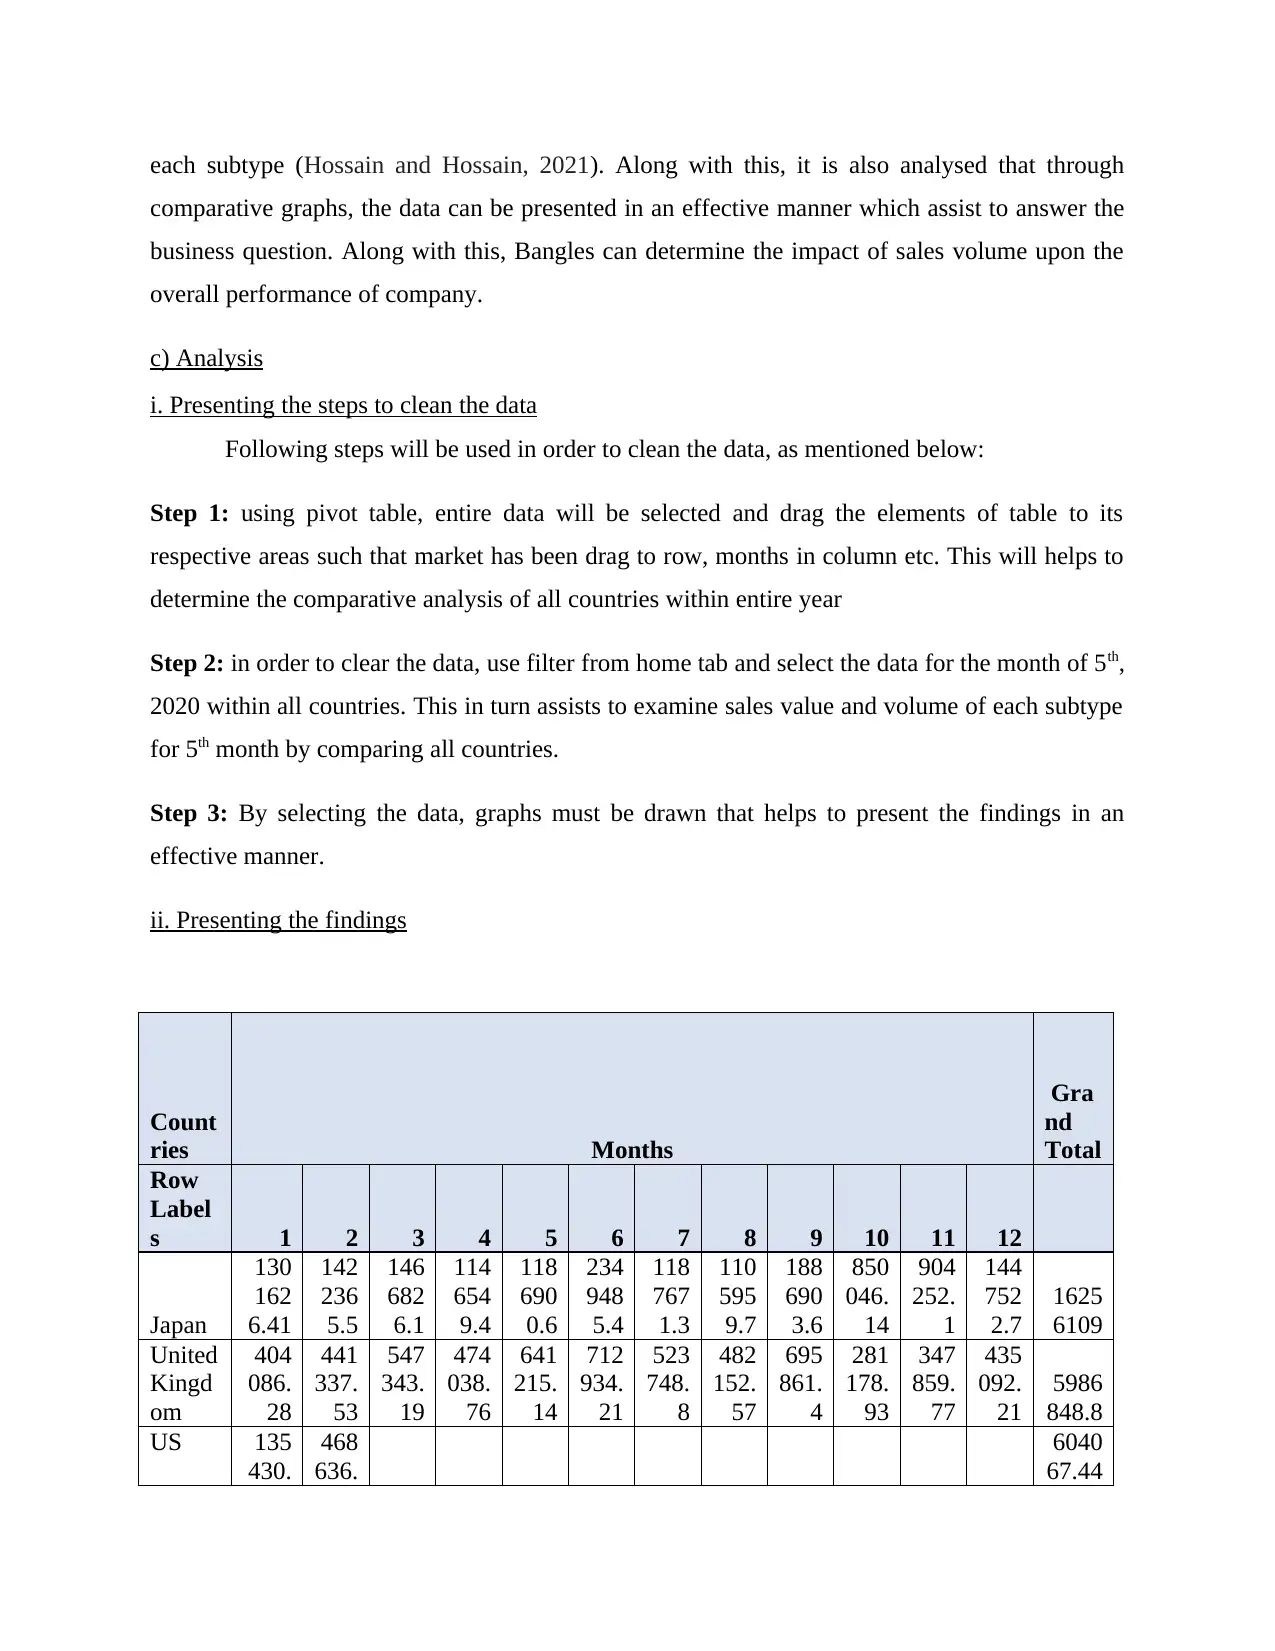
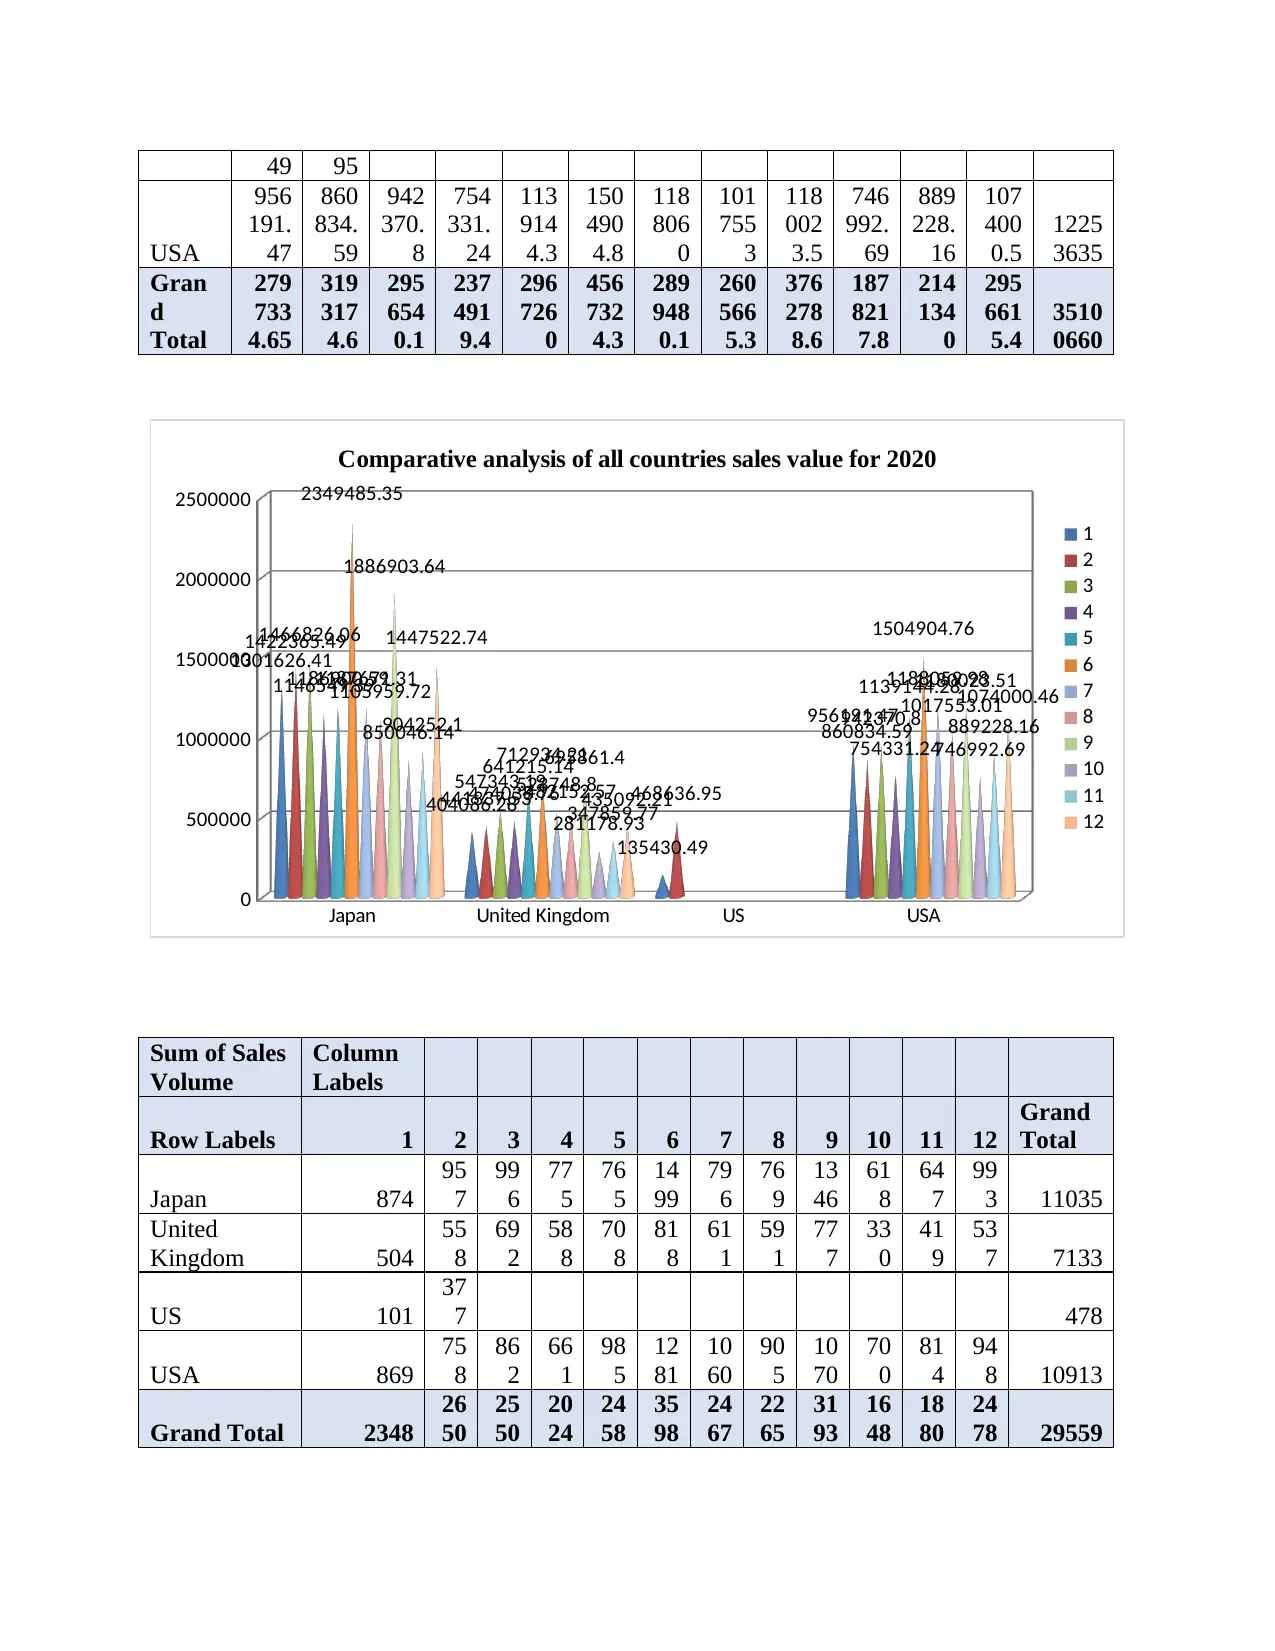
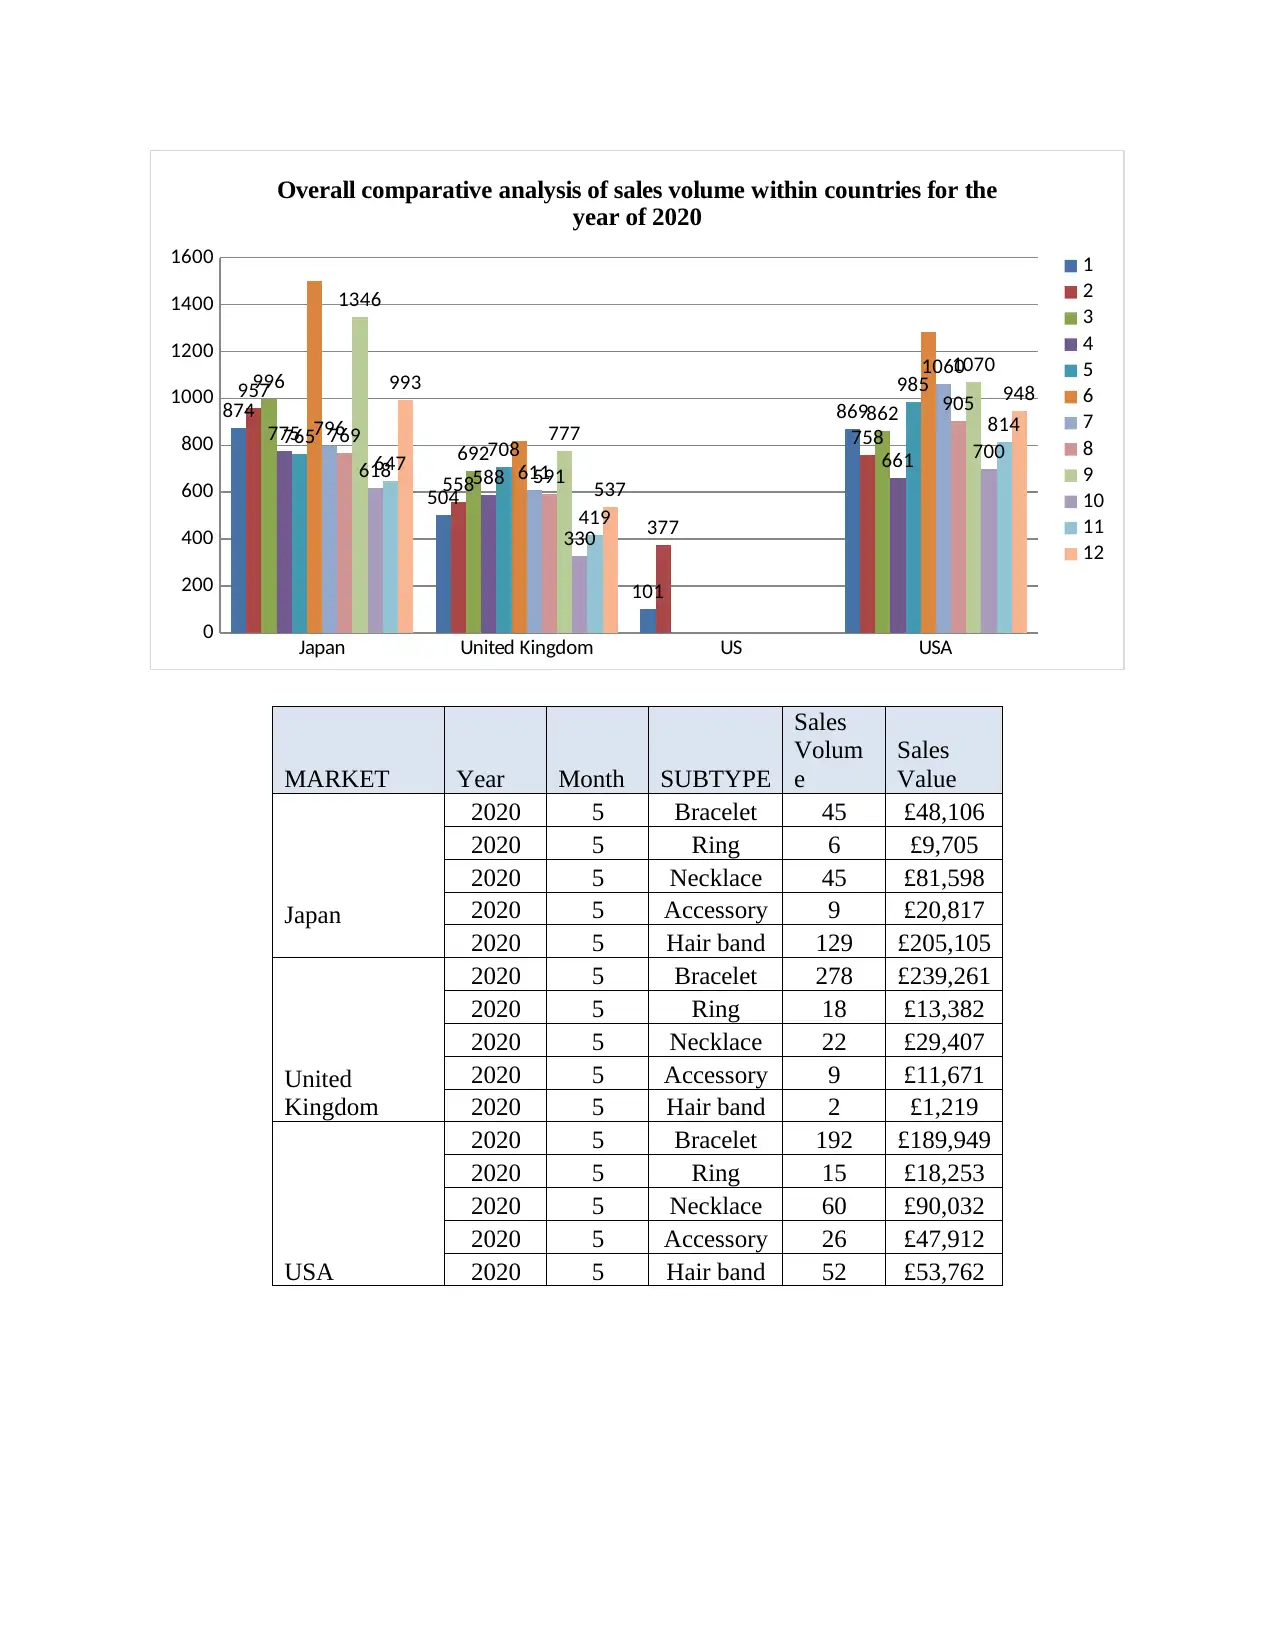
ii. Presenting the findings
Count
ries Months
Gra
nd
Total
Row
Label
s 1 2 3 4 5 6 7 8 9 10 11 12
Japan
130
162
6.41
142
236
5.5
146
682
6.1
114
654
9.4
118
690
0.6
234
948
5.4
118
767
1.3
110
595
9.7
188
690
3.6
850
046.
14
904
252.
1
144
752
2.7
1625
6109
United
Kingd
om
404
086.
28
441
337.
53
547
343.
19
474
038.
76
641
215.
14
712
934.
21
523
748.
8
482
152.
57
695
861.
4
281
178.
93
347
859.
77
435
092.
21
5986
848.8
US 135
430.
468
636.
6040
67.44
comparative graphs, the data can be presented in an effective manner which assist to answer the
business question. Along with this, Bangles can determine the impact of sales volume upon the
overall performance of company.
c) Analysis
i. Presenting the steps to clean the data
Following steps will be used in order to clean the data, as mentioned below:
Step 1: using pivot table, entire data will be selected and drag the elements of table to its
respective areas such that market has been drag to row, months in column etc. This will helps to
determine the comparative analysis of all countries within entire year
Step 2: in order to clear the data, use filter from home tab and select the data for the month of 5th,
2020 within all countries. This in turn assists to examine sales value and volume of each subtype
for 5th month by comparing all countries.
Step 3: By selecting the data, graphs must be drawn that helps to present the findings in an
effective manner.
ii. Presenting the findings
Count
ries Months
Gra
nd
Total
Row
Label
s 1 2 3 4 5 6 7 8 9 10 11 12
Japan
130
162
6.41
142
236
5.5
146
682
6.1
114
654
9.4
118
690
0.6
234
948
5.4
118
767
1.3
110
595
9.7
188
690
3.6
850
046.
14
904
252.
1
144
752
2.7
1625
6109
United
Kingd
om
404
086.
28
441
337.
53
547
343.
19
474
038.
76
641
215.
14
712
934.
21
523
748.
8
482
152.
57
695
861.
4
281
178.
93
347
859.
77
435
092.
21
5986
848.8
US 135
430.
468
636.
6040
67.44
49 95
USA
956
191.
47
860
834.
59
942
370.
8
754
331.
24
113
914
4.3
150
490
4.8
118
806
0
101
755
3
118
002
3.5
746
992.
69
889
228.
16
107
400
0.5
1225
3635
Gran
d
Total
279
733
4.65
319
317
4.6
295
654
0.1
237
491
9.4
296
726
0
456
732
4.3
289
948
0.1
260
566
5.3
376
278
8.6
187
821
7.8
214
134
0
295
661
5.4
3510
0660
Japan United Kingdom US USA
0
500000
1000000
1500000
2000000
2500000
1301626.41
404086.28
135430.49
956191.47
1422365.49
441337.53 468636.95
860834.59
1466826.06
547343.19
942370.8
1146549.39
474038.76
754331.24
1186900.59
641215.14
1139144.28
2349485.35
712934.21
1504904.76
1187671.31
523748.8
1188059.98
1105959.72
482152.57
1017553.01
1886903.64
695861.4
1180023.51
850046.14
281178.93
746992.69
904252.1
347859.77
889228.16
1447522.74
435092.21
1074000.46
Comparative analysis of all countries sales value for 2020
1
2
3
4
5
6
7
8
9
10
11
12
Sum of Sales
Volume
Column
Labels
Row Labels 1 2 3 4 5 6 7 8 9 10 11 12
Grand
Total
Japan 874
95
7
99
6
77
5
76
5
14
99
79
6
76
9
13
46
61
8
64
7
99
3 11035
United
Kingdom 504
55
8
69
2
58
8
70
8
81
8
61
1
59
1
77
7
33
0
41
9
53
7 7133
US 101
37
7 478
USA 869
75
8
86
2
66
1
98
5
12
81
10
60
90
5
10
70
70
0
81
4
94
8 10913
Grand Total 2348
26
50
25
50
20
24
24
58
35
98
24
67
22
65
31
93
16
48
18
80
24
78 29559
Japan United Kingdom US USA
0
200
400
600
800
1000
1200
1400
1600
874
504
101
869
957
558
377
758
996
692
862
775
588 661
765 708
985
796
611
1060
769
591
905
1346
777
1070
618
330
700
647
419
814
993
537
948
Overall comparative analysis of sales volume within countries for the
year of 2020
1
2
3
4
5
6
7
8
9
10
11
12
MARKET Year Month SUBTYPE
Sales
Volum
e
Sales
Value
Japan
2020 5 Bracelet 45 £48,106
2020 5 Ring 6 £9,705
2020 5 Necklace 45 £81,598
2020 5 Accessory 9 £20,817
2020 5 Hair band 129 £205,105
United
Kingdom
2020 5 Bracelet 278 £239,261
2020 5 Ring 18 £13,382
2020 5 Necklace 22 £29,407
2020 5 Accessory 9 £11,671
2020 5 Hair band 2 £1,219
USA
2020 5 Bracelet 192 £189,949
2020 5 Ring 15 £18,253
2020 5 Necklace 60 £90,032
2020 5 Accessory 26 £47,912
2020 5 Hair band 52 £53,762
Paraphrase This Document
Need a fresh take? Get an instant paraphrase of this document with our AI Paraphraser
Bracelet Ring Necklace Accessory Hair band
-
50
100
150
200
250
300
45
6
45
9
129
278
18 22 9 2
192
15
60
26
52
Comparative analysis of sales volume for the 5th month,
2020
Japan
UK
USA
Bracelet Ring Necklace Accessory Hair band
£0
£50,000
£100,000
£150,000
£200,000
£250,000
£48,106
£9,705
£81,598
£20,817
£205,105
£239,261
£13,382
£29,407
£11,671 £1,219
£189,949
£18,253
£90,032
£47,912 £53,762
Comparative analysis of sales value for 5th month, 2020
Japan
UK
USA
Key findings:
Through the comparative analysis of all countries, it has been analyzed from sales
volume and sales value that within Japan, there is a fluctuating trend for the month of 1, 2
and 3. However, sales volume of each subtype decreases after 4 month due to not
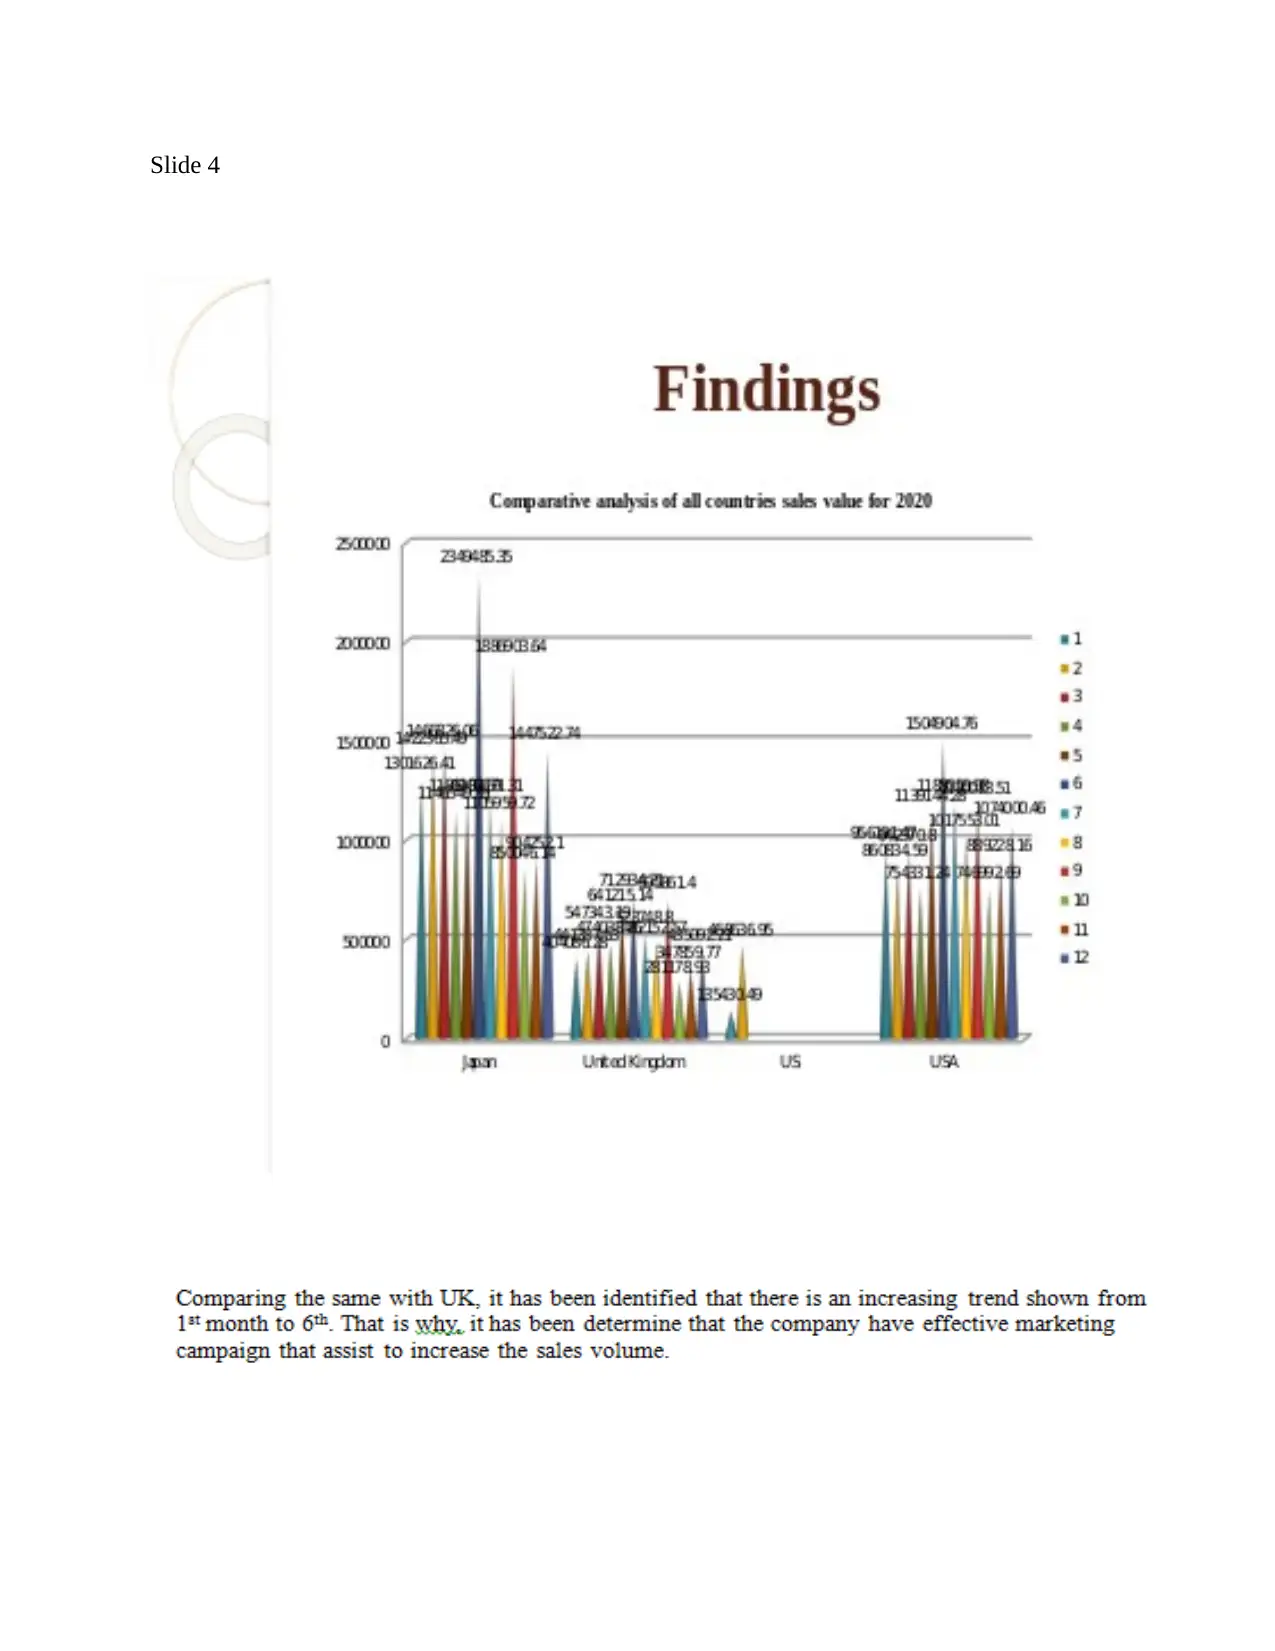
focusing upon marketing campaigns. On the other side, comparing the same with UK, it
has been identified that there is an increasing trend shown from 1st month to 6th. That is
-
50
100
150
200
250
300
45
6
45
9
129
278
18 22 9 2
192
15
60
26
52
Comparative analysis of sales volume for the 5th month,
2020
Japan
UK
USA
Bracelet Ring Necklace Accessory Hair band
£0
£50,000
£100,000
£150,000
£200,000
£250,000
£48,106
£9,705
£81,598
£20,817
£205,105
£239,261
£13,382
£29,407
£11,671 £1,219
£189,949
£18,253
£90,032
£47,912 £53,762
Comparative analysis of sales value for 5th month, 2020
Japan
UK
USA
Key findings:
Through the comparative analysis of all countries, it has been analyzed from sales
volume and sales value that within Japan, there is a fluctuating trend for the month of 1, 2
and 3. However, sales volume of each subtype decreases after 4 month due to not
focusing upon marketing campaigns. On the other side, comparing the same with UK, it
has been identified that there is an increasing trend shown from 1st month to 6th. That is
why, it has been determine that the company have effective marketing campaign that
assist to increase the sales volume. Further, data also reflected from USA entails that the
sales volume increases in 5th month and there is an increasing trend which shows the
positive impact of marketing campaign over the sales.
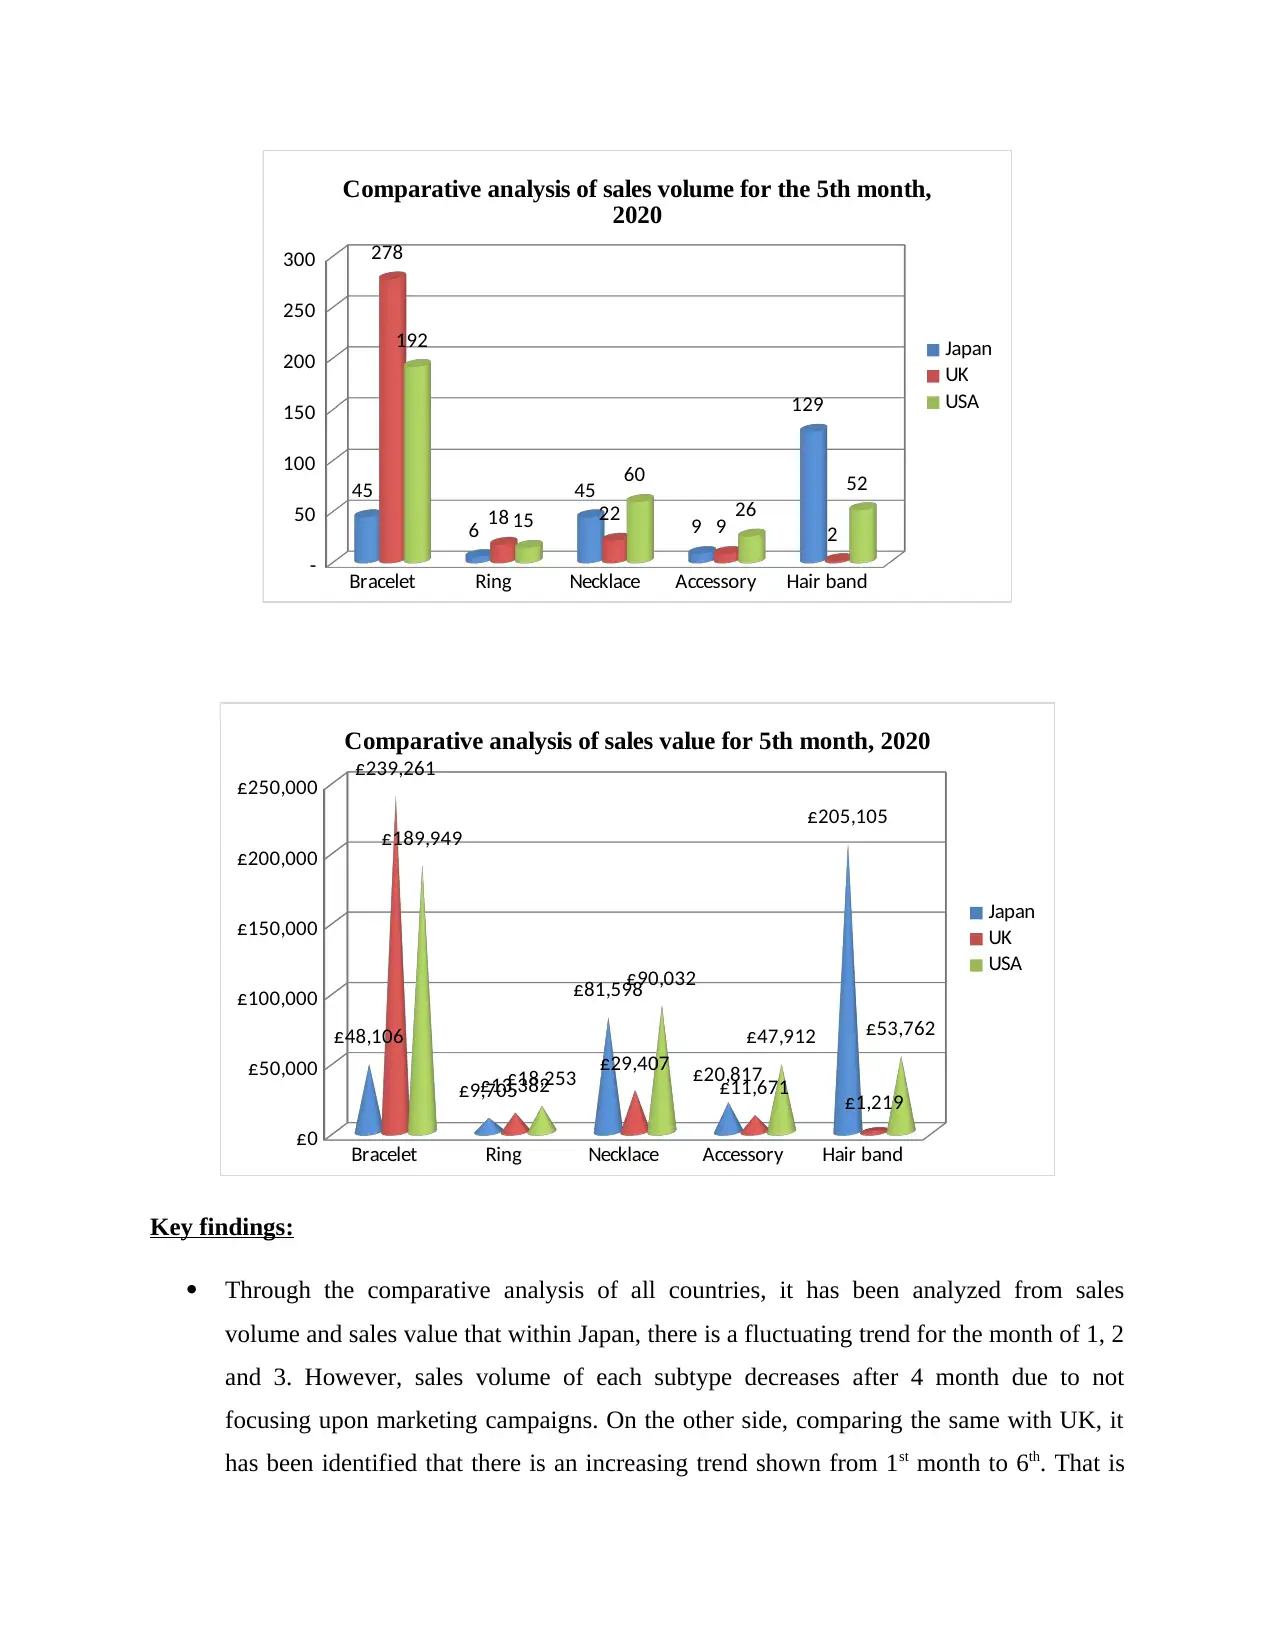
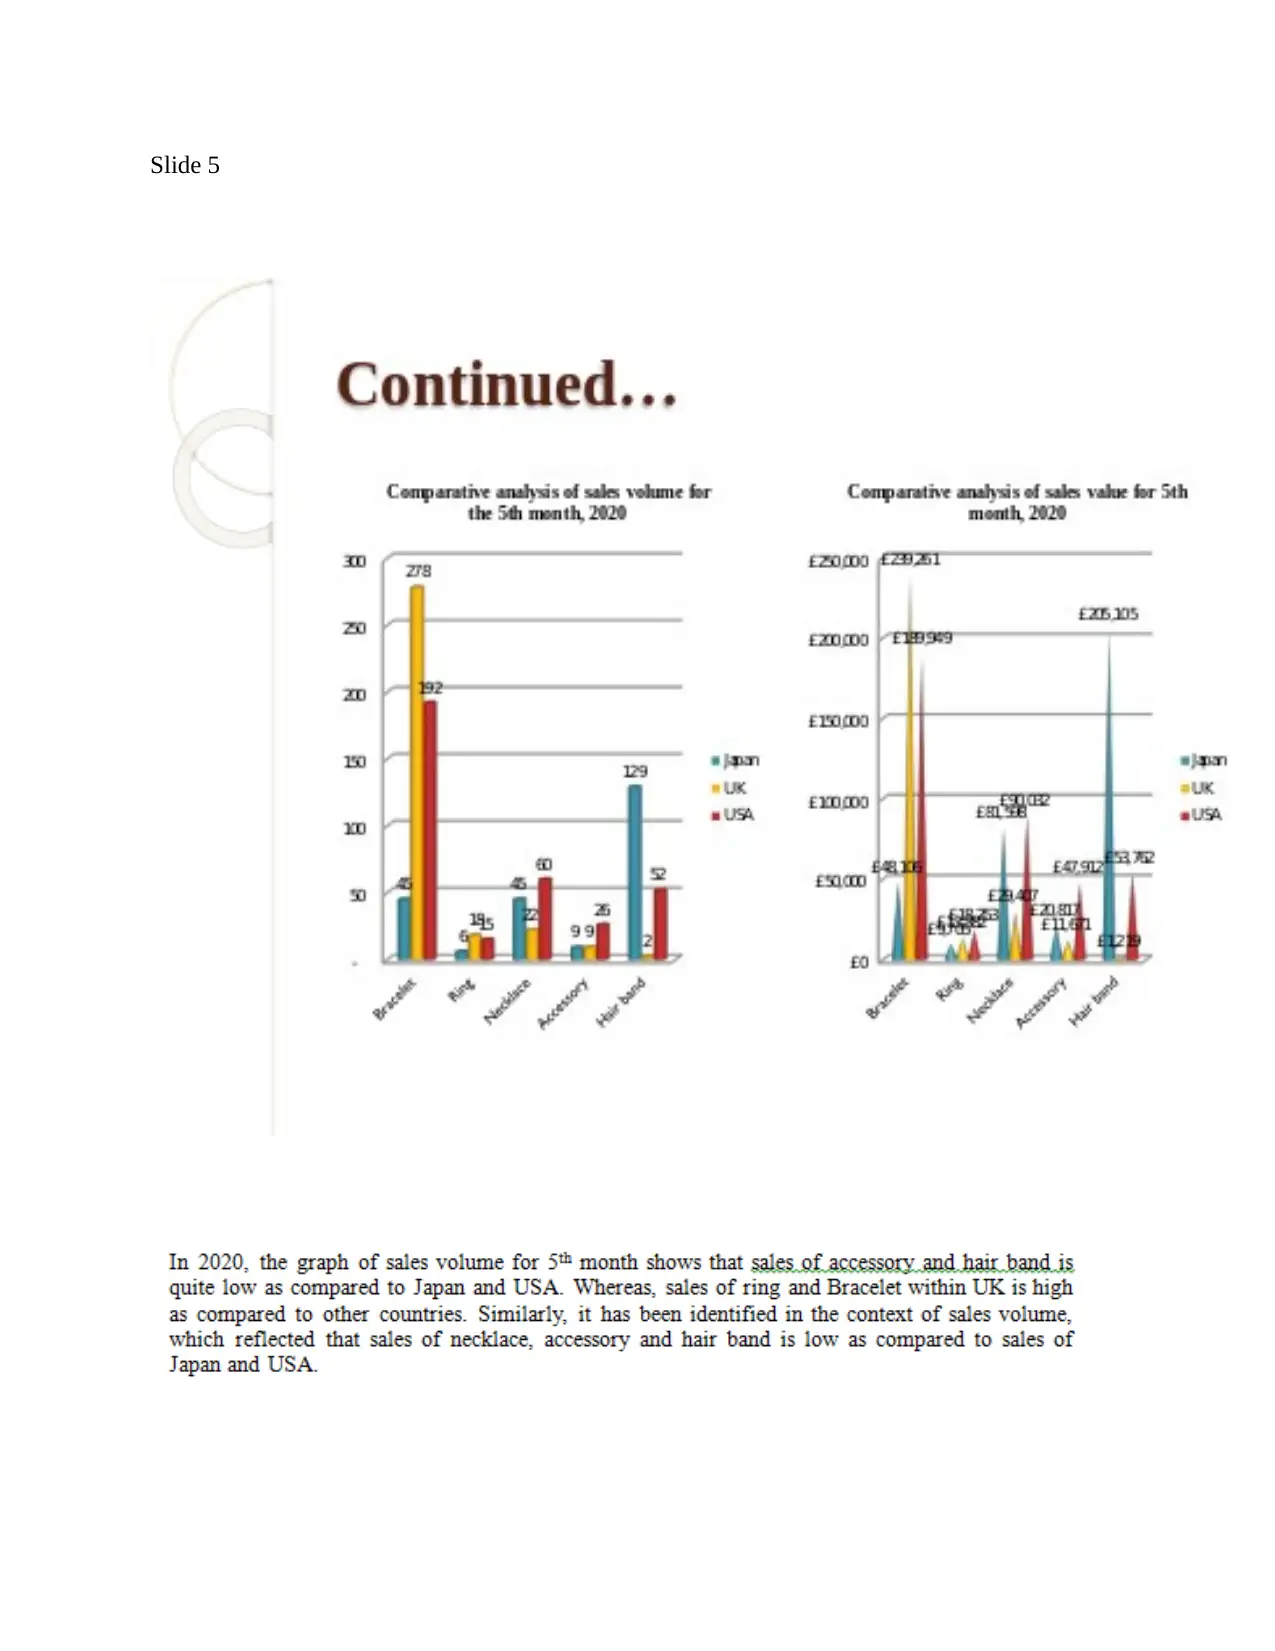
In 2020, the graph of sales volume for 5th month shows that sales of accessory and hair
band is quite low as compared to Japan and USA. Whereas, sales of ring and Bracelet
within UK is high as compared to other countries. Similarly, it has been identified in the
context of sales volume, which reflected that sales of necklace, accessory and hair band is
low as compared to sales of Japan and USA.
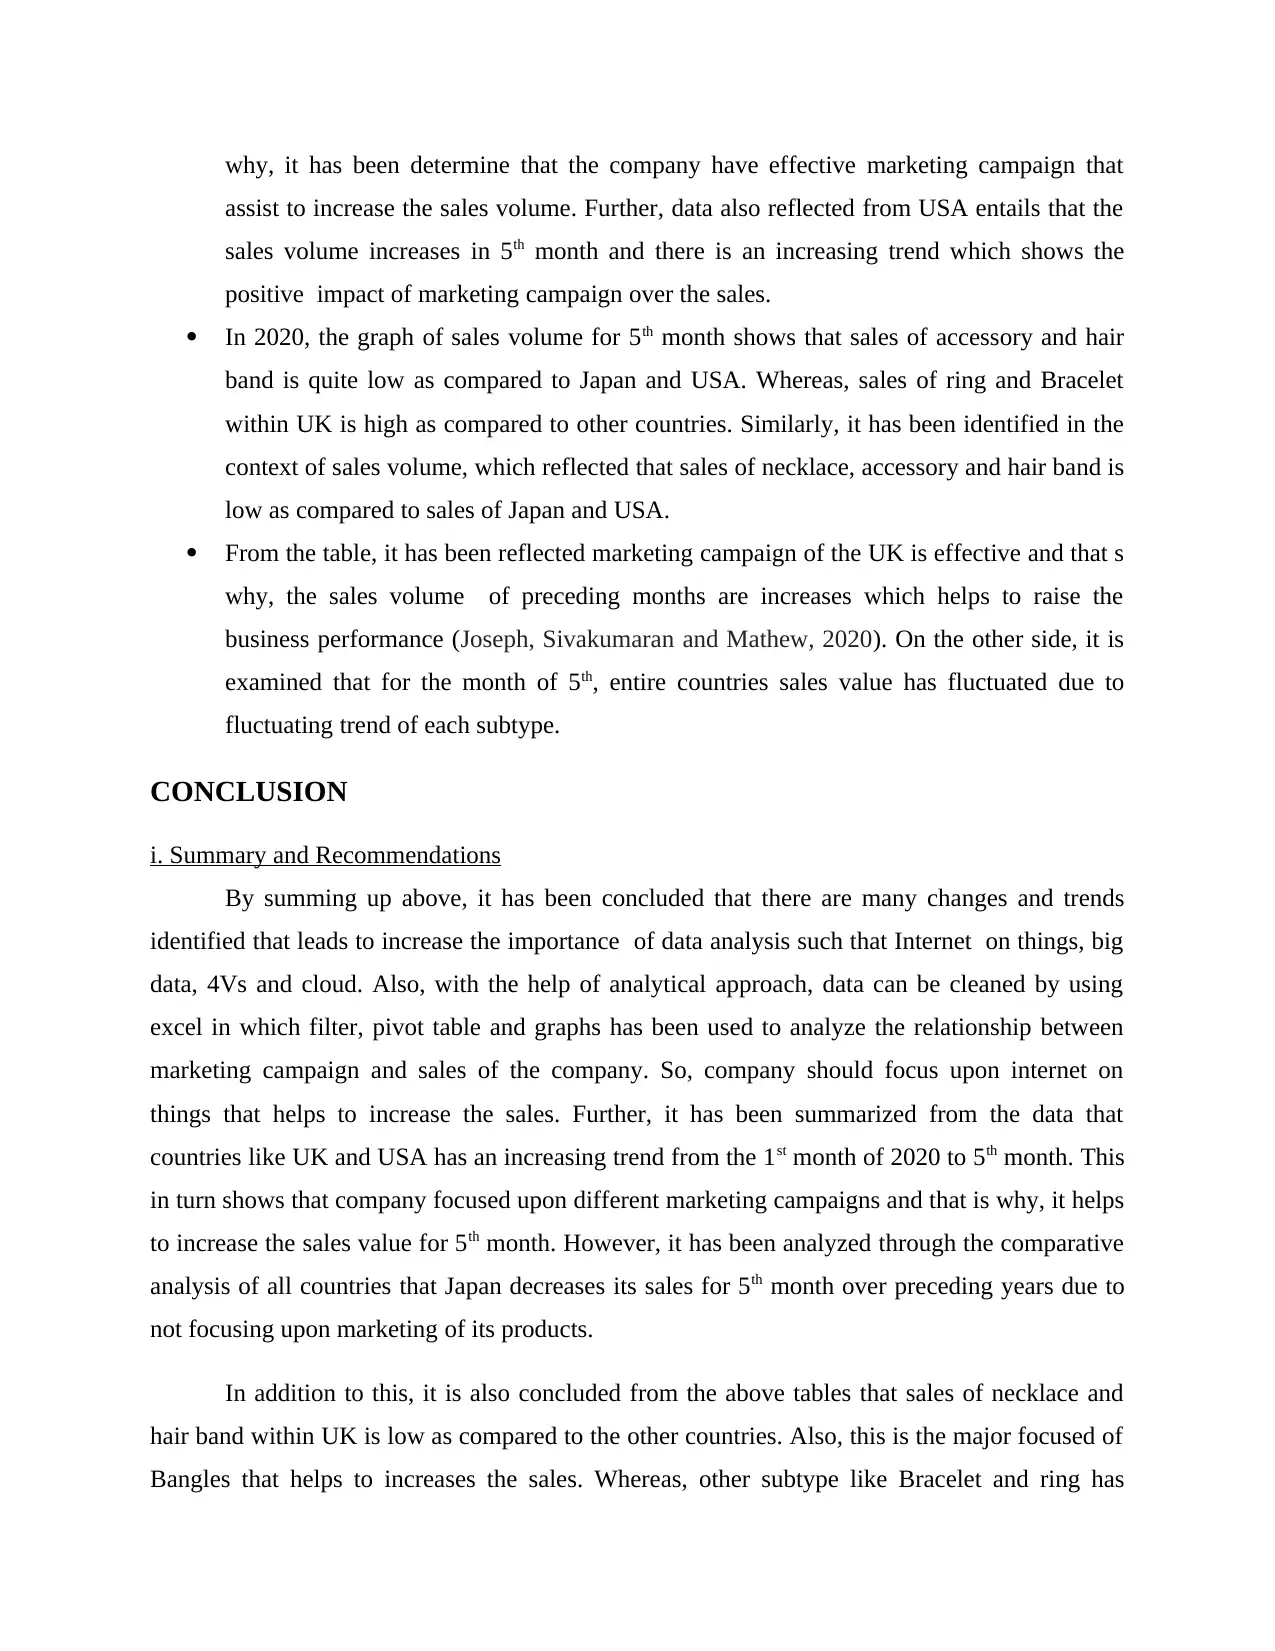
From the table, it has been reflected marketing campaign of the UK is effective and that s
why, the sales volume of preceding months are increases which helps to raise the
business performance (Joseph, Sivakumaran and Mathew, 2020). On the other side, it is
examined that for the month of 5th, entire countries sales value has fluctuated due to
fluctuating trend of each subtype.
CONCLUSION
i. Summary and Recommendations
By summing up above, it has been concluded that there are many changes and trends
identified that leads to increase the importance of data analysis such that Internet on things, big
data, 4Vs and cloud. Also, with the help of analytical approach, data can be cleaned by using
excel in which filter, pivot table and graphs has been used to analyze the relationship between
marketing campaign and sales of the company. So, company should focus upon internet on
things that helps to increase the sales. Further, it has been summarized from the data that
countries like UK and USA has an increasing trend from the 1st month of 2020 to 5th month. This
in turn shows that company focused upon different marketing campaigns and that is why, it helps
to increase the sales value for 5th month. However, it has been analyzed through the comparative
analysis of all countries that Japan decreases its sales for 5th month over preceding years due to
not focusing upon marketing of its products.
In addition to this, it is also concluded from the above tables that sales of necklace and
hair band within UK is low as compared to the other countries. Also, this is the major focused of
Bangles that helps to increases the sales. Whereas, other subtype like Bracelet and ring has
assist to increase the sales volume. Further, data also reflected from USA entails that the
sales volume increases in 5th month and there is an increasing trend which shows the
positive impact of marketing campaign over the sales.
In 2020, the graph of sales volume for 5th month shows that sales of accessory and hair
band is quite low as compared to Japan and USA. Whereas, sales of ring and Bracelet
within UK is high as compared to other countries. Similarly, it has been identified in the
context of sales volume, which reflected that sales of necklace, accessory and hair band is
low as compared to sales of Japan and USA.
From the table, it has been reflected marketing campaign of the UK is effective and that s
why, the sales volume of preceding months are increases which helps to raise the
business performance (Joseph, Sivakumaran and Mathew, 2020). On the other side, it is
examined that for the month of 5th, entire countries sales value has fluctuated due to
fluctuating trend of each subtype.
CONCLUSION
i. Summary and Recommendations
By summing up above, it has been concluded that there are many changes and trends
identified that leads to increase the importance of data analysis such that Internet on things, big
data, 4Vs and cloud. Also, with the help of analytical approach, data can be cleaned by using
excel in which filter, pivot table and graphs has been used to analyze the relationship between
marketing campaign and sales of the company. So, company should focus upon internet on
things that helps to increase the sales. Further, it has been summarized from the data that
countries like UK and USA has an increasing trend from the 1st month of 2020 to 5th month. This
in turn shows that company focused upon different marketing campaigns and that is why, it helps
to increase the sales value for 5th month. However, it has been analyzed through the comparative
analysis of all countries that Japan decreases its sales for 5th month over preceding years due to
not focusing upon marketing of its products.
In addition to this, it is also concluded from the above tables that sales of necklace and
hair band within UK is low as compared to the other countries. Also, this is the major focused of
Bangles that helps to increases the sales. Whereas, other subtype like Bracelet and ring has
higher sales as compared to other countries because customer wants to invest on such items as
compared to others. Though there is a positive trend identified within the starting month to 5th
month within UK so that it causes positive relationship between sales volume and other subtype
die to change in time.
Recommendations
From the above, it has been analyzed that there is a need to focus upon sales of those
products which has low sales for the month of 5th, 2020. So it is recommended to the Bangles
that it must use effective marketing tools in order to attract the customers like, social media in
which Facebook and Twitter can be used to draw attention of many customers. Also, it is to be
recommended to the start selling product online because it helps to increase the sales volume and
raise the performance of the company as well.
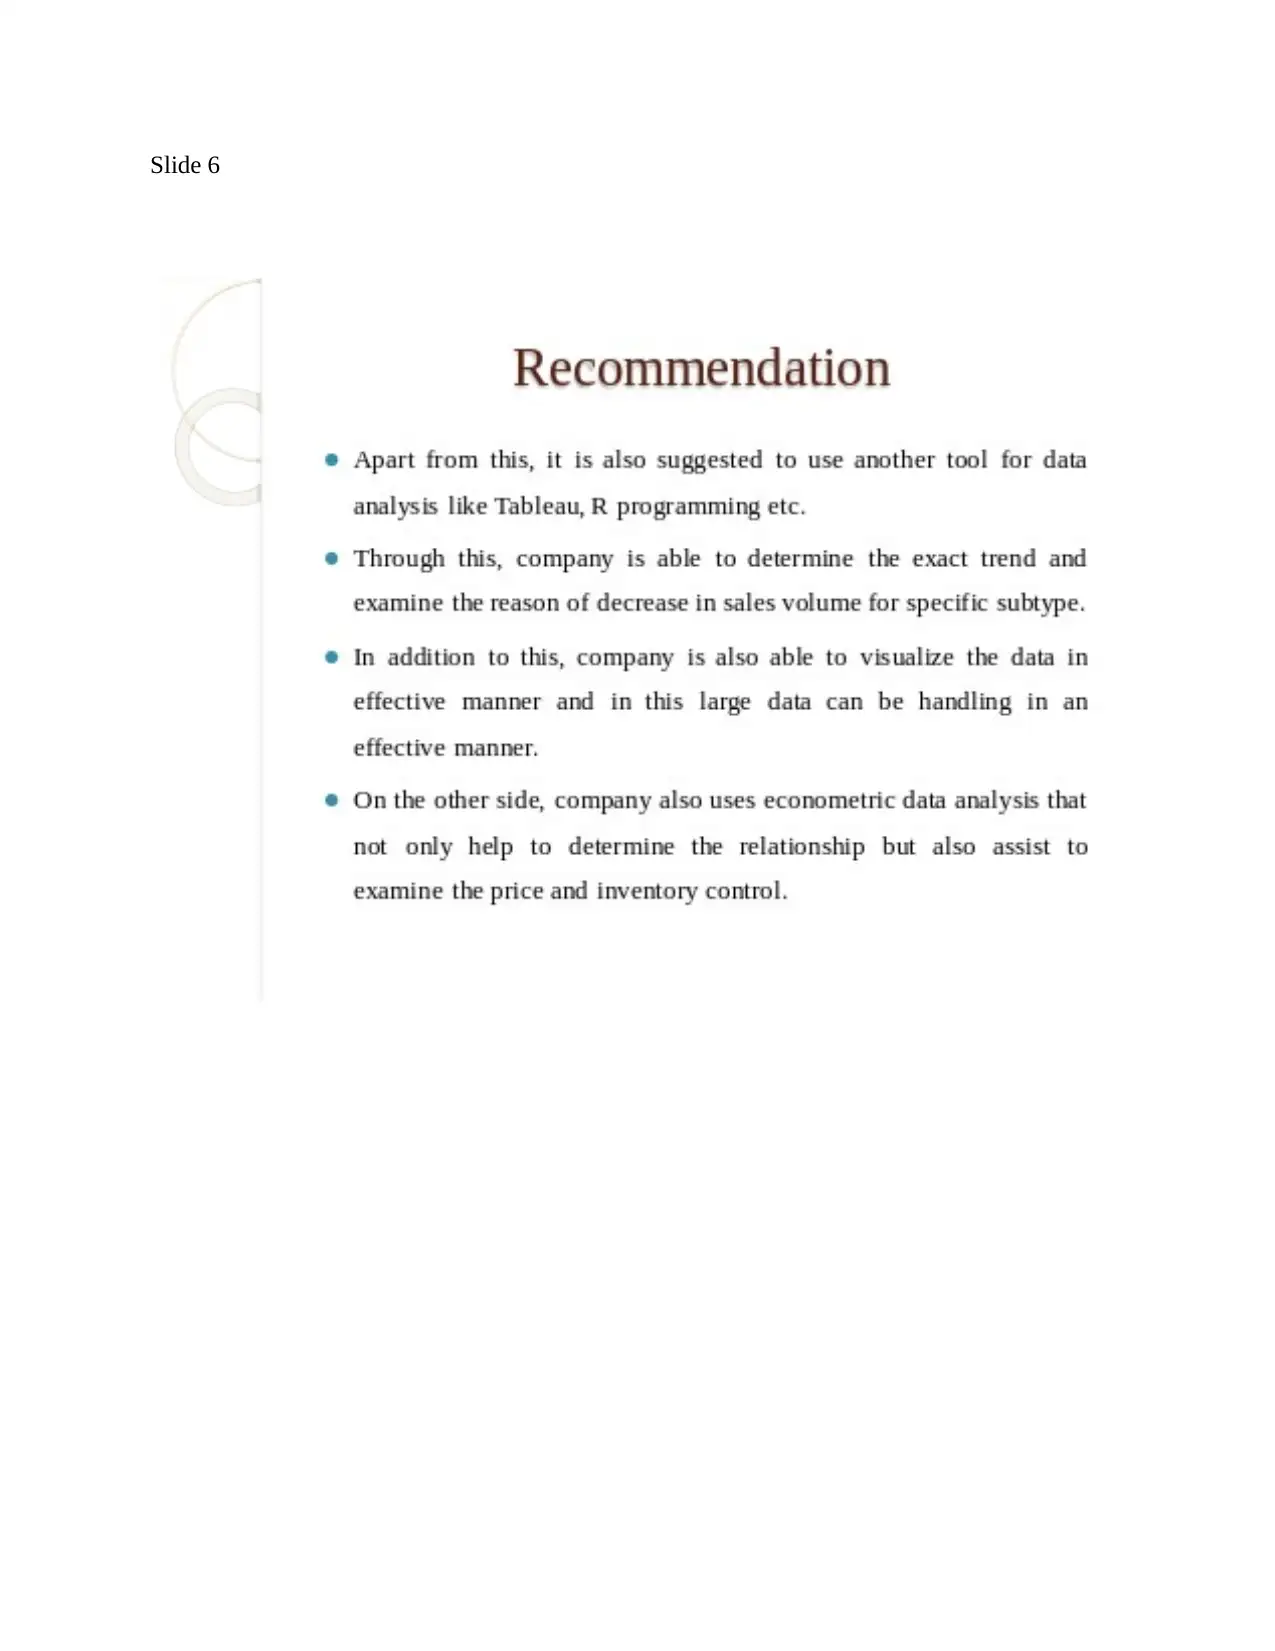
Apart from this, it is also suggested to use another tool for data analysis like Tableau, R
programming etc. Through this, company is able to determine the exact trend and examine the
reason of decrease in sales volume for specific subtype. In addition to this, company is also able
to visualize the data in effective manner and in this large data can be handling in an effective
manner (Turkanik and Johnson, 2020). That is why, it is suggested to the use advance technique
software in order to analyses the data and also hire the expertise in order to generate the results in
effective manner. On the other side, company also uses econometric data analysis that not only
help to determine the relationship but also assist to examine the price and inventory control.
Overall, it has been analyzed that with the help of effective tools, data can be presented in more
presentable manner as compared to using excel.
ii. Critically evaluate the use of econometric analysis within Bangles to make effective analysis
of UK marketing campaign
In order to determine the effectiveness of UK marketing campaign, econometric analysis
can be used in order to analyze the data in effective manner. It is one of the highly used statistical
method that helps to test economic theory. Such that it is mostly used to study the income effect
using an observable data (Zubaidi, Anderson and Hernandez, 2020). Similarly, in the context of
give data to determine the impact of marketing campaign upon sales, this advance technology
can be used in effective manner. In addition to this, the statistical analysis is used in order to
compared to others. Though there is a positive trend identified within the starting month to 5th
month within UK so that it causes positive relationship between sales volume and other subtype
die to change in time.
Recommendations
From the above, it has been analyzed that there is a need to focus upon sales of those
products which has low sales for the month of 5th, 2020. So it is recommended to the Bangles
that it must use effective marketing tools in order to attract the customers like, social media in
which Facebook and Twitter can be used to draw attention of many customers. Also, it is to be
recommended to the start selling product online because it helps to increase the sales volume and
raise the performance of the company as well.
Apart from this, it is also suggested to use another tool for data analysis like Tableau, R
programming etc. Through this, company is able to determine the exact trend and examine the
reason of decrease in sales volume for specific subtype. In addition to this, company is also able
to visualize the data in effective manner and in this large data can be handling in an effective
manner (Turkanik and Johnson, 2020). That is why, it is suggested to the use advance technique
software in order to analyses the data and also hire the expertise in order to generate the results in
effective manner. On the other side, company also uses econometric data analysis that not only
help to determine the relationship but also assist to examine the price and inventory control.
Overall, it has been analyzed that with the help of effective tools, data can be presented in more
presentable manner as compared to using excel.
ii. Critically evaluate the use of econometric analysis within Bangles to make effective analysis
of UK marketing campaign
In order to determine the effectiveness of UK marketing campaign, econometric analysis
can be used in order to analyze the data in effective manner. It is one of the highly used statistical
method that helps to test economic theory. Such that it is mostly used to study the income effect
using an observable data (Zubaidi, Anderson and Hernandez, 2020). Similarly, in the context of
give data to determine the impact of marketing campaign upon sales, this advance technology
can be used in effective manner. In addition to this, the statistical analysis is used in order to
Secure Best Marks with AI Grader
Need help grading? Try our AI Grader for instant feedback on your assignments.
derive the relationship between variables and to make effective decision for the welfare of a
company.
Moreover, it has been analyzed that to examine the impact upon sales due to UK
marketing campaigns, Bangles must use econometric analysis that assists to make effectual
decision. It is also used in the quantitative data set and state the relationship between the both
variables that assist to make further decision. Through this data analysis, it will help company to
determine the economic forecasting which assist company to make effectual decision for the
welfare of the firm (Le and Sarkodie, 2020). That is why, this method has been opted that assist
to make effective decision even on prices, inventory as well as production. Whereas, unctions
used in the excel does not provide help in such things. With the help of econometric data
analysis, Bangles can use such power tools which can drive the business ahead and also helps in
smarter decision-making. Along with this, it also assist to determine the ways through which
sales of the company increases and optimization of cost which is not possible another data
analysis tool. Overall, it has been assist to make effectual decision for the welfare of the Bangles
and make better decision making as well.
However, it has been critically evaluated that for relying too heavily on the interpretation
of raw data without linking to the established economic theory which do not define the casual
relationship. That is why, most of the experts do not use such method because it cause opposite
impact upon the results (Awad and Alazzeh, 2020). Also, the process of using econometric data
analysis is quite costly and time consuming process that delays the project findings. However, in
the context of the present scenario, Bangles can use this data analysis in order to generate the
findings in effectual manner such that it helps to determine the effectiveness of UK marketing
campaigns upon the sales volume.
Summary of broad findings in Presentation
Slide 1
Slide 2
Paraphrase This Document
Need a fresh take? Get an instant paraphrase of this document with our AI Paraphraser
Slide 3
Slide 4

Secure Best Marks with AI Grader
Need help grading? Try our AI Grader for instant feedback on your assignments.
Slide 5
Slide 6

Slide 7
Paraphrase This Document
Need a fresh take? Get an instant paraphrase of this document with our AI Paraphraser
REFERENCES
Books and Journals
Awad, I.M. and Alazzeh, W., 2020. Using currency demand to estimate the Palestine
underground economy: An econometric analysis. Palgrave Communications. 6(1). pp.1-
11.
Hossain, E. and Hossain, E., 2021. MS Excel in Engineering Data. Excel Crash Course for
Engineers, pp.169-242.
Joseph, J., Sivakumaran, B. and Mathew, S., 2020. Does Loyalty Matter? Impact of Brand
Loyalty and Sales Promotion on Brand Equity. Journal of Promotion Management. 26(4).
pp.524-543.
Le, H.P. and Sarkodie, S.A., 2020. Dynamic linkage between renewable and conventional energy
use, environmental quality and economic growth: evidence from Emerging Market and
Developing Economies. Energy Reports. 6. pp.965-973.
Turkanik, G. and Johnson, J., 2020, September. Sales and Marketing Automation and New
Customer Conversion in International Markets. In The Tenth International Conference on
Engaged Management Scholarship.
Zubaidi, H.A., Anderson, J.C. and Hernandez, S., 2020. Understanding roundabout safety
through the application of advanced econometric techniques. International journal of
transportation science and technology. 9(4). pp.309-321.
Online
Data Analysis: What, How, and Why to Do Data Analysis for Your Organization. 2019. [Online].
Available Through:< https://www.import.io/post/business-data-analysis-what-how-why/ >.
Big Data Analytics. 2021. [Online]. Available Through:<
https://www.sas.com/en_in/insights/analytics/big-data-analytics.html#:~:text=Why%20is
%20big%20data%20analytics,higher%20profits%20and%20happier%20customers.>.
Excel Data Analysis – PivotTables. 2020. [Online]. Available Through:<
https://www.tutorialspoint.com/excel_data_analysis/excel_data_analysis_pivottables.htm>.
1 out of 20
Related Documents


Your All-in-One AI-Powered Toolkit for Academic Success.
+13062052269
info@desklib.com
Available 24*7 on WhatsApp / Email
![[object Object]](/_next/static/media/star-bottom.7253800d.svg)
Unlock your academic potential
© 2024 | Zucol Services PVT LTD | All rights reserved.