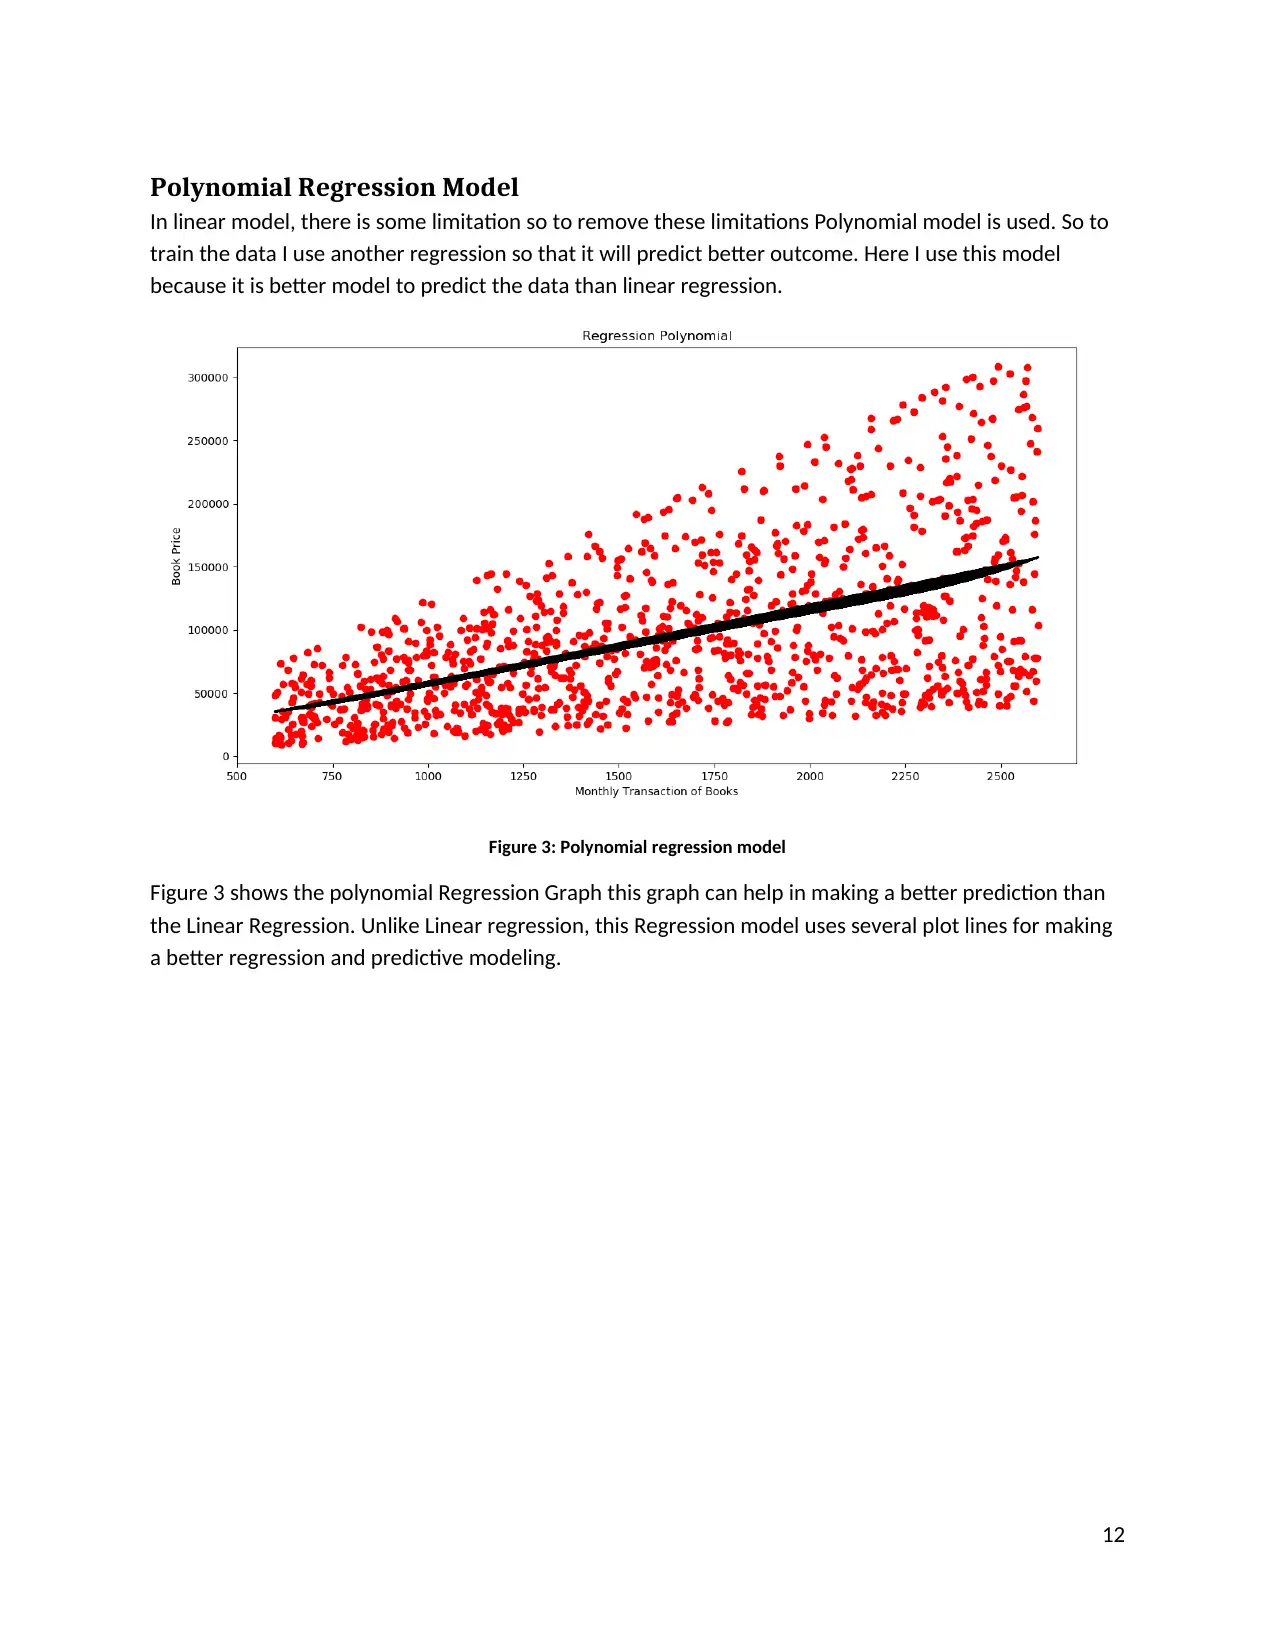
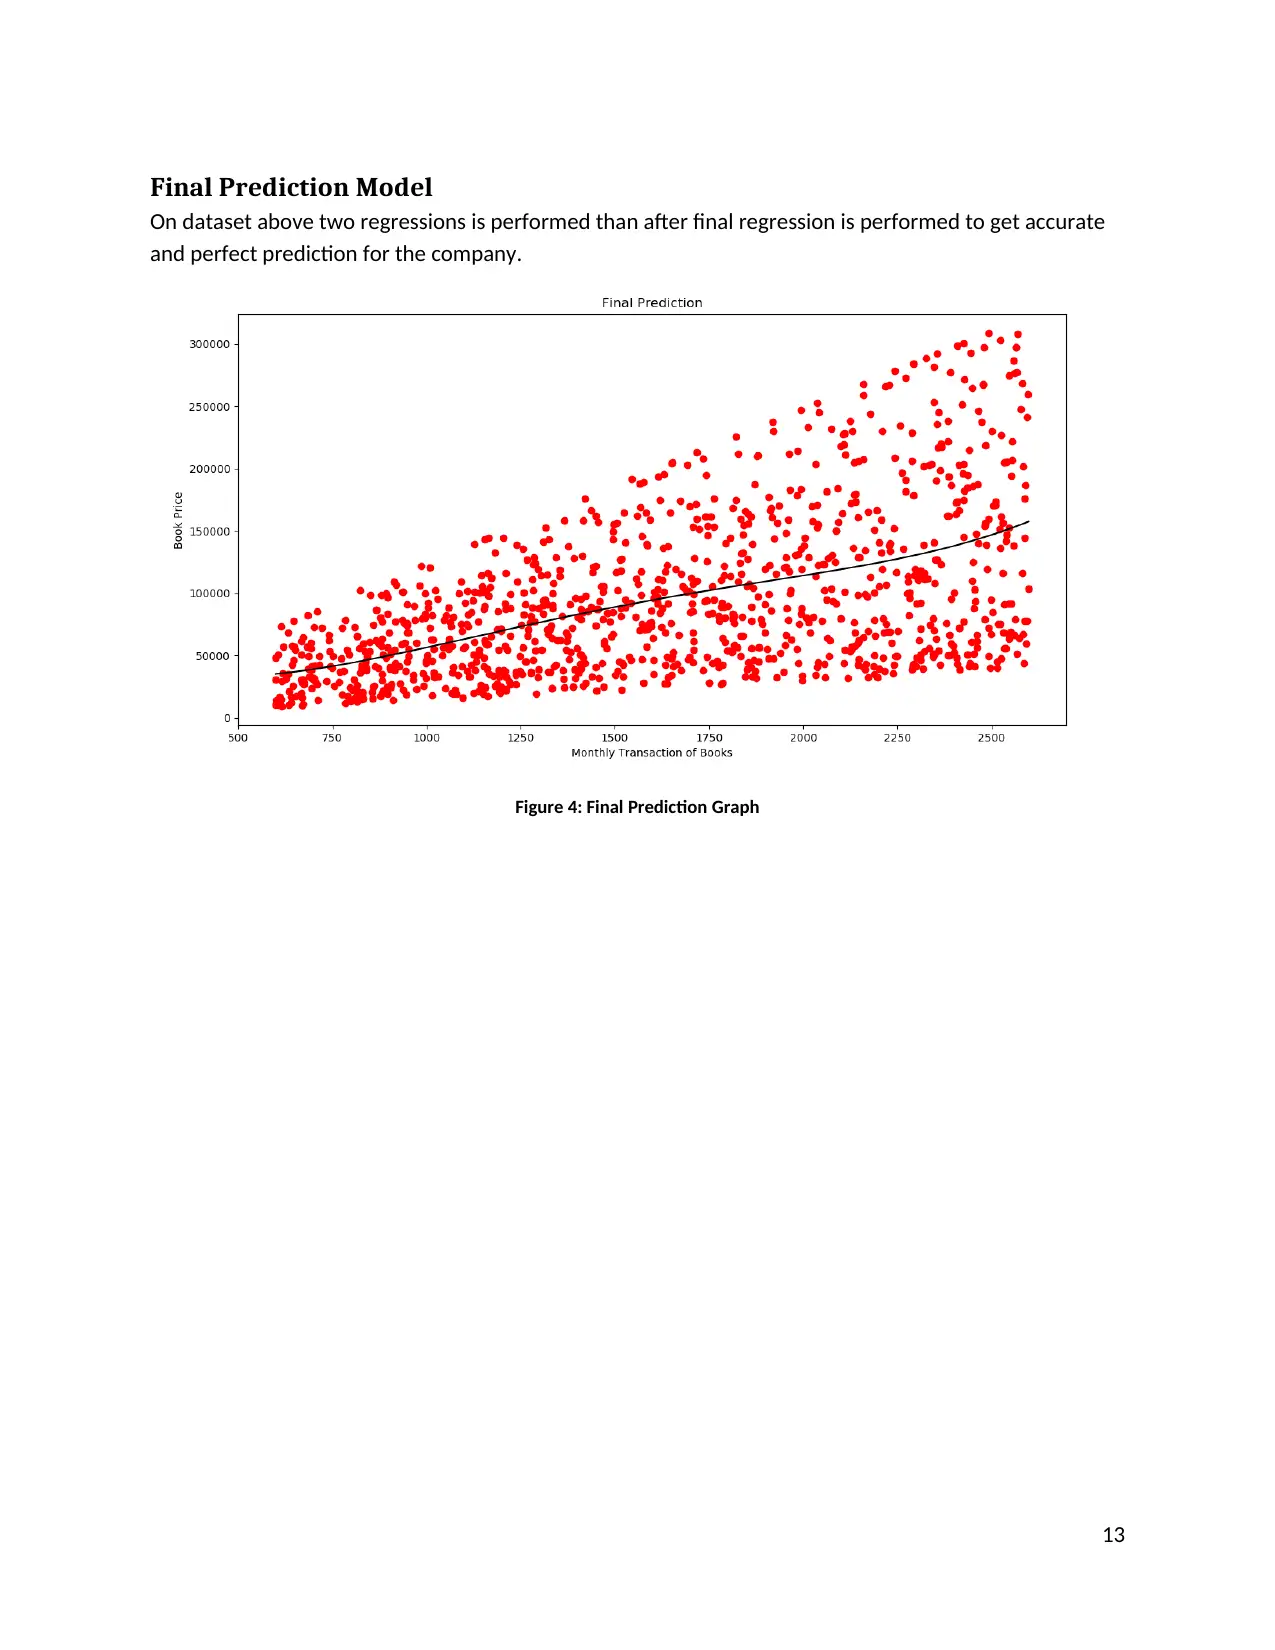
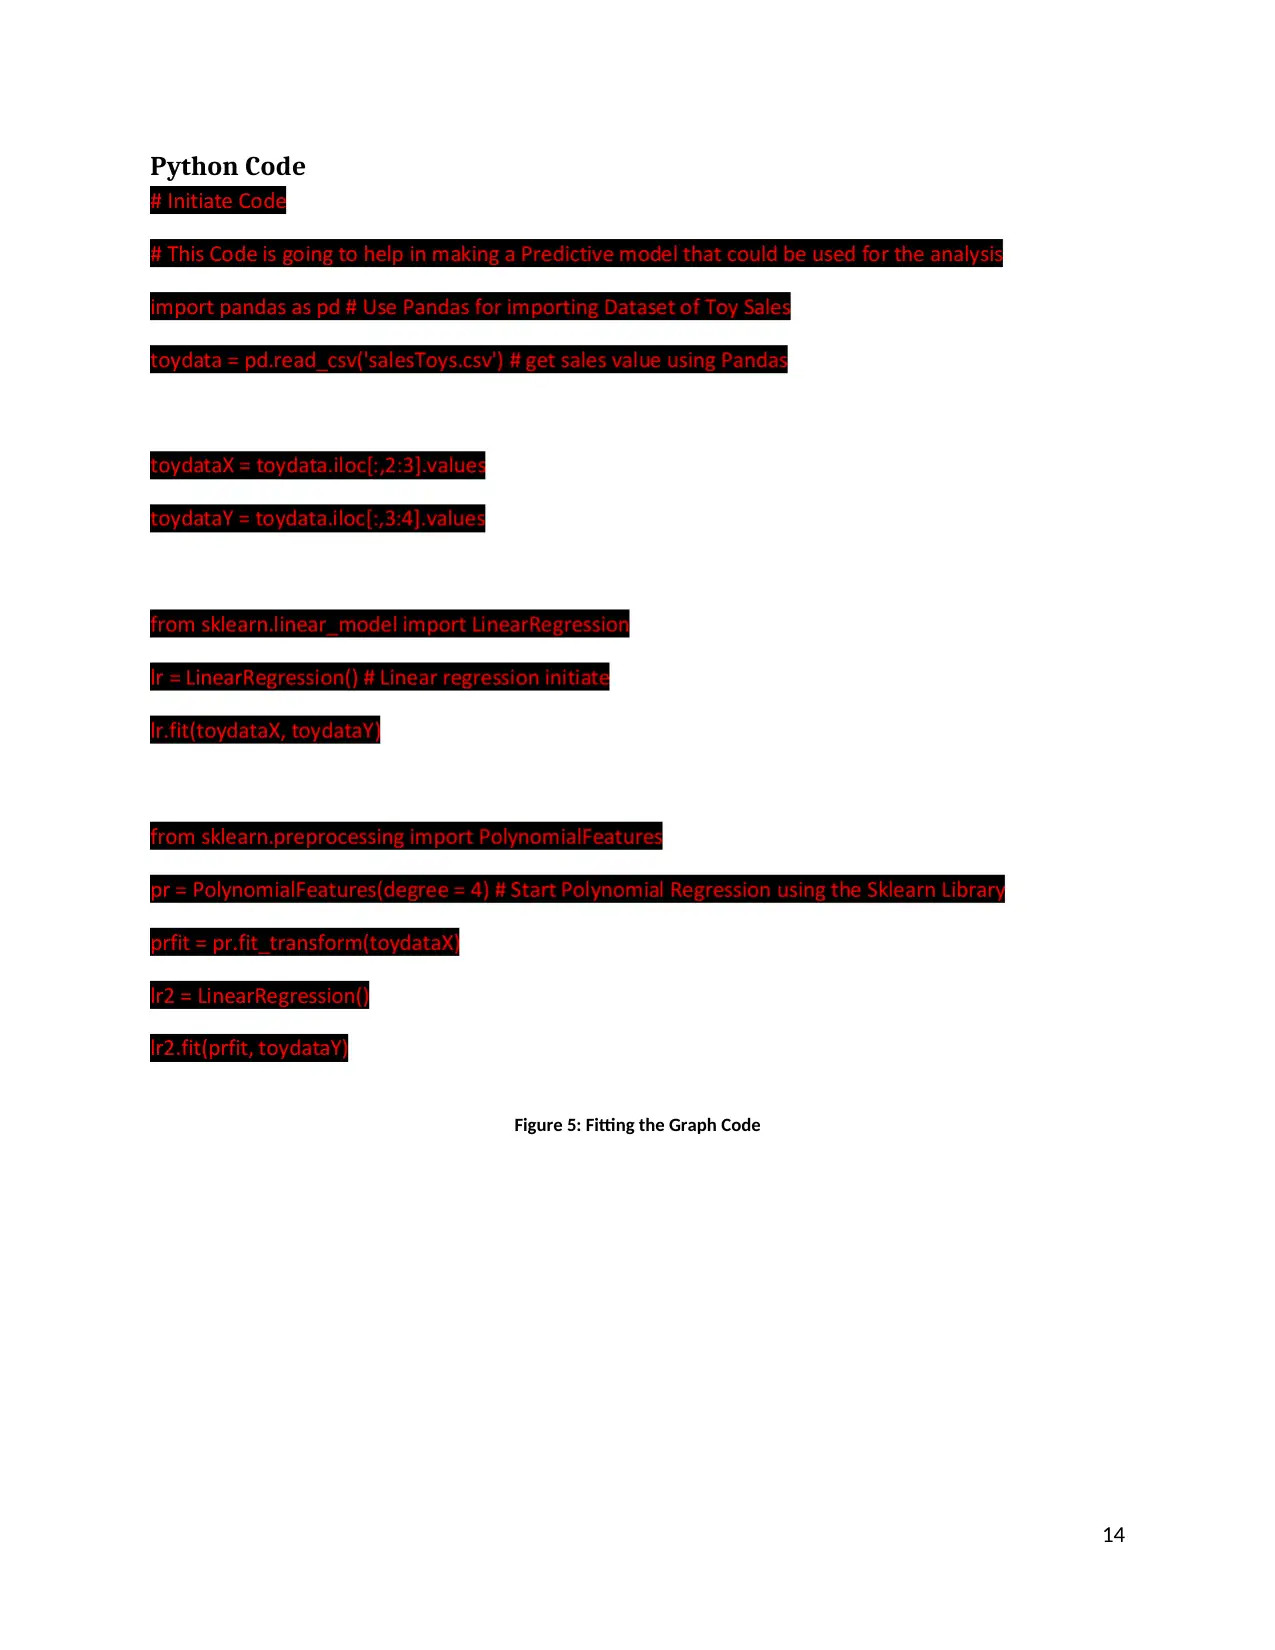
Data-Driven Strategies for E-Commerce Success: A Case Study of Toys Sales
Added on 2024-06-04
23 Pages3117 Words182 Views
Statistics and Probability
|
|
|
ICT_706
![Data-Driven Strategies for E-Commerce Success: A Case Study of Toys Sales_1](/_next/image/?url=https%3A%2F%2Fdesklib.com%2Fmedia%2Fdocument%2Fpages%2F2024-06-04%2Fdata-driven-strategies-for-e-commerce-success-a-case-study-of-toys-sales-page-1.webp&w=3840&q=10)
Executive Summary
There is an E- Commerce Company. This E-commerce company currently faces loss in their business.
This company is market leader in different product segments. Product segments are books, household’s
items, latest gadgets, and cloths. Everyday competition is increasing. The company faces many issues.
And slowly company profile is decreases.
So to identify the company problem we need an expert who will understand the data and define some
relation between them by analyzing some pattern or methodology used in this report. I am a data
scientist of the company, the director wishes me to identify or analyze the data of previous month sale.
They want some great idea from me like which field is need to be target? What are the customer
demands? Which product will give higher priority? Furthermore, the company wants some great plan
which will help in improving more profit and again have control over the market.
Here we use python programming. In python programming, some process is use to extract the data.
Here regression model is used that will help in to identify the sale of next month and also help in to
make a plan to improve profit.
Dataset is created from starting which has some desired attributes. Also, this dataset helps in developing
models and in analyzing the things. Some regressions are used on the dataset to train the data which
will help in predicting more exact result. At last, the prediction is very accurate which approximately
92% is. This approximation is much more efficient.
I recommend an idea to the company which will include high speed to deliver the data and also give
priority to selected toys which will help in generating more profits also remove those toys from stock
which do not demand more frequently. Also, track the whole system to improve efficiency.
1
![Data-Driven Strategies for E-Commerce Success: A Case Study of Toys Sales_2](/_next/image/?url=https%3A%2F%2Fdesklib.com%2Fmedia%2Fdocument%2Fpages%2F2024-06-04%2Fdata-driven-strategies-for-e-commerce-success-a-case-study-of-toys-sales-page-2.webp&w=3840&q=10)
Table of Contents
Executive Summary.....................................................................................................................................2
Assumptions taken for the analysis of this are:...........................................................................................5
Company background..................................................................................................................................6
Introduction.................................................................................................................................................7
Research Methodology................................................................................................................................8
Methodology types:................................................................................................................................8
Quantitative Research:........................................................................................................................8
Qualitative Research................................................................................................................................8
Analytical Findings.....................................................................................................................................10
Dataset:.................................................................................................................................................10
Data mining:..........................................................................................................................................11
Data clustering.......................................................................................................................................11
Predictive Modeling...................................................................................................................................12
Linear Regression Model.......................................................................................................................12
Polynomial Regression Model...............................................................................................................13
Final Prediction Model...........................................................................................................................14
Python Code..........................................................................................................................................15
Recommendations from Analysis..............................................................................................................16
Recommendation One...........................................................................................................................16
Recommendation Two..........................................................................................................................16
Recommendation Three........................................................................................................................16
Recommendation Four..........................................................................................................................16
Recommendations for the Company.........................................................................................................17
Implementation plan for the recommendations.......................................................................................18
Python Code for the Test and Training Analysis........................................................................................19
Conclusion:................................................................................................................................................21
References.................................................................................................................................................22
Appendix...................................................................................................................................................23
Implemented Python code for the data analysis...................................................................................23
2
![Data-Driven Strategies for E-Commerce Success: A Case Study of Toys Sales_3](/_next/image/?url=https%3A%2F%2Fdesklib.com%2Fmedia%2Fdocument%2Fpages%2F2024-06-04%2Fdata-driven-strategies-for-e-commerce-success-a-case-study-of-toys-sales-page-3.webp&w=3840&q=10)
List of Figures
Figure 1: Toys Sales Dataset......................................................................................................................10
Figure 2: Linear regression Model.............................................................................................................12
Figure 3: Polynomial regression model.....................................................................................................13
Figure 4: Final Prediction Graph................................................................................................................14
Figure 5: Fitting the Graph Code................................................................................................................15
Figure 6: Python Code for Test and Training Splitting................................................................................19
Figure 7: Plot for the Training Data...........................................................................................................20
Figure 8: Plot for the Test Data..................................................................................................................20
3
![Data-Driven Strategies for E-Commerce Success: A Case Study of Toys Sales_4](/_next/image/?url=https%3A%2F%2Fdesklib.com%2Fmedia%2Fdocument%2Fpages%2F2024-06-04%2Fdata-driven-strategies-for-e-commerce-success-a-case-study-of-toys-sales-page-4.webp&w=3840&q=10)
Assumptions taken for the analysis of this are:
To generate desired result following assumptions are made:
Firstly, database is created using some dummy values
Toys segment is used to create dataset
Some dummy Geographical location is used to deliver the data by company.
This database contains many unique Toys from various companies
For delivery purpose, a system is used
Here a person is also needed to deliver the Toys at needed place
4
![Data-Driven Strategies for E-Commerce Success: A Case Study of Toys Sales_5](/_next/image/?url=https%3A%2F%2Fdesklib.com%2Fmedia%2Fdocument%2Fpages%2F2024-06-04%2Fdata-driven-strategies-for-e-commerce-success-a-case-study-of-toys-sales-page-5.webp&w=3840&q=10)
End of preview
Want to access all the pages? Upload your documents or become a member.
Related Documents
Data Analytics for Sales Optimization in an E-commerce Camera Companylg...
|25
|3377
|113
E-commerce Sales Optimization: A Data-Driven Approach to Profit Maximizationlg...
|17
|2066
|154
Data Analytics Research Project: Enhancing E-commerce Performance Through Predictive Modelinglg...
|18
|1969
|258
Boosting E-commerce Sales: Data-Driven Strategies for Profitabilitylg...
|24
|2692
|279
Data Analytics for E-commerce Profit Enhancement: A Case Study of a Book Segmentlg...
|22
|2665
|57
Handwritten Digit Classification and Sample Complexity using Kernel Perceptronlg...
|8
|1975
|279