Report on Data Handling: Excel Functions and Statistical Analysis
VerifiedAdded on 2023/06/18
|17
|3441
|305
Report
AI Summary
This report provides a comprehensive overview of data handling, focusing on the effectiveness of Excel functions in analyzing data. It discusses the various uses of Excel, including data mining techniques, error removal, and statistical function application. The report also explores the use of charts for data visualization, highlighting different chart types and their applications in presenting data effectively. Furthermore, the report includes a statistical analysis of customer data from Smile Clinic, examining gender distribution, age statistics (mean, median, mode), and rice consumption habits. The report also contrasts the advantages and disadvantages of using SPSS versus Excel for data analysis. This assignment solution is available on Desklib, a platform offering a wide range of study tools and solved assignments for students.
Data Handling 2
Paraphrase This Document
Need a fresh take? Get an instant paraphrase of this document with our AI Paraphraser
TABLE OF CONTENTS
INTRODUCTION...........................................................................................................................3
PART 1............................................................................................................................................3
Effectiveness of excel functions in analysing data......................................................................3
Use of excel.....................................................................................................................................3
PART 2............................................................................................................................................7
Number of male and female customers of Smile Clinic..............................................................7
Mean, mode, median of the ages.................................................................................................8
Numbers of people who eat rice along with mean, median and mode......................................11
Examples of clustering..............................................................................................................13
Most common data mining methods used in businesses...........................................................14
Advantages and disadvantages of SPSS over excel..................................................................14
REFERENCES................................................................................................................................1
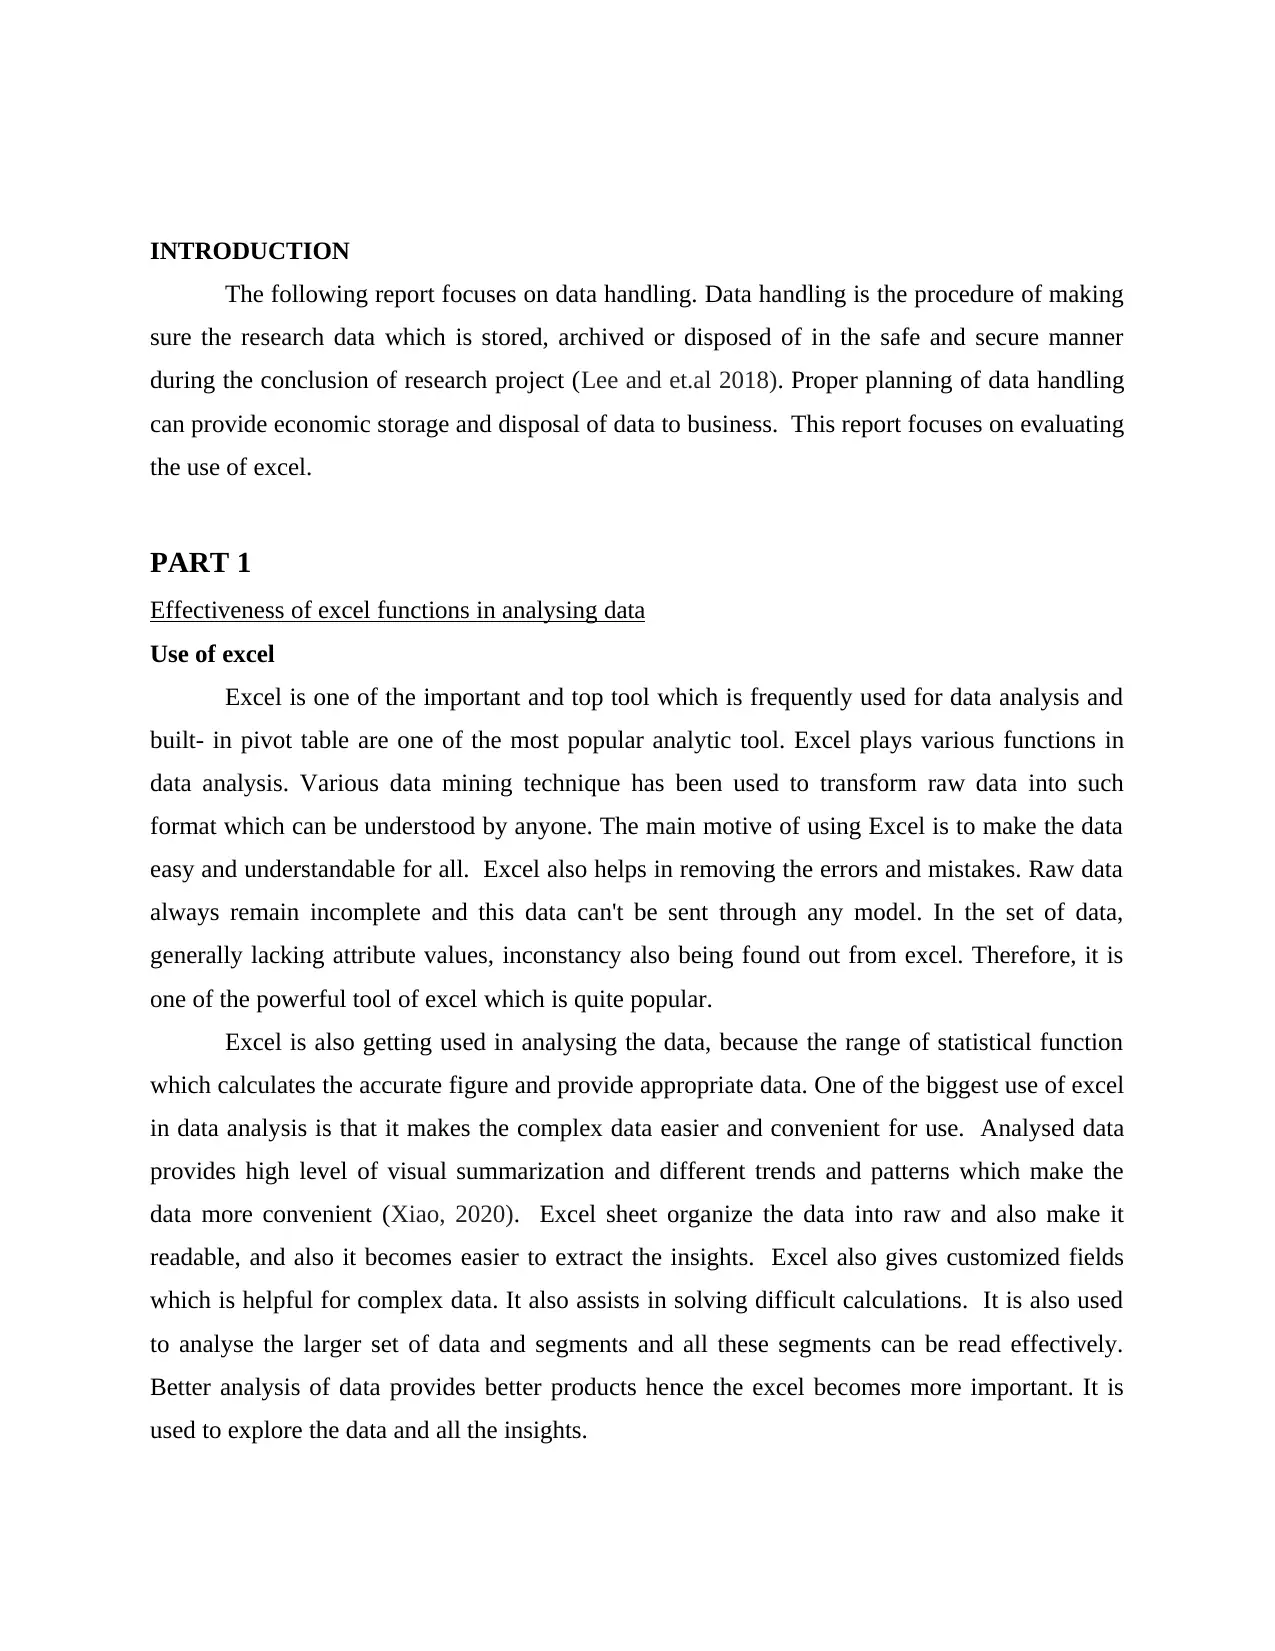
INTRODUCTION
The following report focuses on data handling. Data handling is the procedure of making
sure the research data which is stored, archived or disposed of in the safe and secure manner
during the conclusion of research project (Lee and et.al 2018). Proper planning of data handling
can provide economic storage and disposal of data to business. This report focuses on evaluating
the use of excel.
PART 1
Effectiveness of excel functions in analysing data
Use of excel
Excel is one of the important and top tool which is frequently used for data analysis and
built- in pivot table are one of the most popular analytic tool. Excel plays various functions in
data analysis. Various data mining technique has been used to transform raw data into such
format which can be understood by anyone. The main motive of using Excel is to make the data
easy and understandable for all. Excel also helps in removing the errors and mistakes. Raw data
always remain incomplete and this data can't be sent through any model. In the set of data,
generally lacking attribute values, inconstancy also being found out from excel. Therefore, it is
one of the powerful tool of excel which is quite popular.
Excel is also getting used in analysing the data, because the range of statistical function
which calculates the accurate figure and provide appropriate data. One of the biggest use of excel
in data analysis is that it makes the complex data easier and convenient for use. Analysed data
provides high level of visual summarization and different trends and patterns which make the
data more convenient (Xiao, 2020). Excel sheet organize the data into raw and also make it
readable, and also it becomes easier to extract the insights. Excel also gives customized fields
which is helpful for complex data. It also assists in solving difficult calculations. It is also used
to analyse the larger set of data and segments and all these segments can be read effectively.
Better analysis of data provides better products hence the excel becomes more important. It is
used to explore the data and all the insights.
⊘ This is a preview!⊘
Do you want full access?
Subscribe today to unlock all pages.
Trusted by 1+ million students worldwide
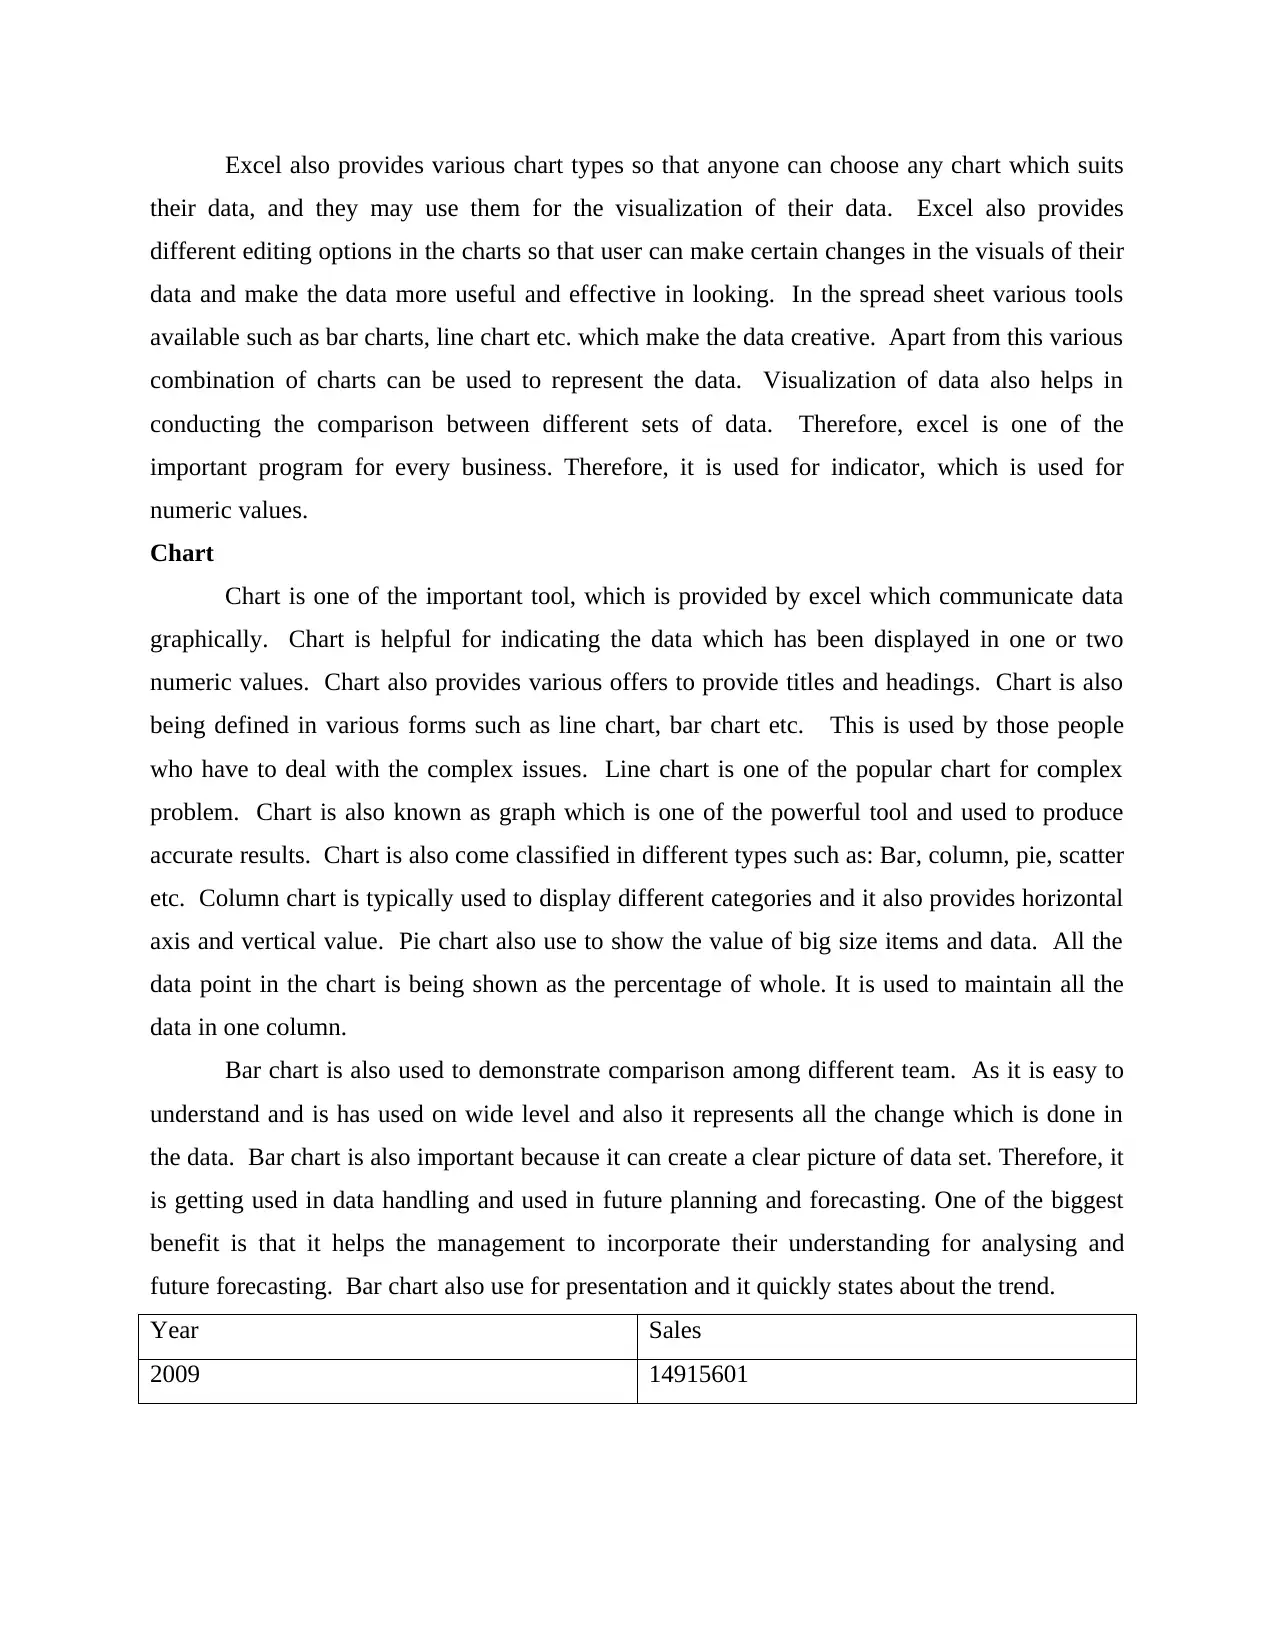
Excel also provides various chart types so that anyone can choose any chart which suits
their data, and they may use them for the visualization of their data. Excel also provides
different editing options in the charts so that user can make certain changes in the visuals of their
data and make the data more useful and effective in looking. In the spread sheet various tools
available such as bar charts, line chart etc. which make the data creative. Apart from this various
combination of charts can be used to represent the data. Visualization of data also helps in
conducting the comparison between different sets of data. Therefore, excel is one of the
important program for every business. Therefore, it is used for indicator, which is used for
numeric values.
Chart
Chart is one of the important tool, which is provided by excel which communicate data
graphically. Chart is helpful for indicating the data which has been displayed in one or two
numeric values. Chart also provides various offers to provide titles and headings. Chart is also
being defined in various forms such as line chart, bar chart etc. This is used by those people
who have to deal with the complex issues. Line chart is one of the popular chart for complex
problem. Chart is also known as graph which is one of the powerful tool and used to produce
accurate results. Chart is also come classified in different types such as: Bar, column, pie, scatter
etc. Column chart is typically used to display different categories and it also provides horizontal
axis and vertical value. Pie chart also use to show the value of big size items and data. All the
data point in the chart is being shown as the percentage of whole. It is used to maintain all the
data in one column.
Bar chart is also used to demonstrate comparison among different team. As it is easy to
understand and is has used on wide level and also it represents all the change which is done in
the data. Bar chart is also important because it can create a clear picture of data set. Therefore, it
is getting used in data handling and used in future planning and forecasting. One of the biggest
benefit is that it helps the management to incorporate their understanding for analysing and
future forecasting. Bar chart also use for presentation and it quickly states about the trend.
Year Sales
2009 14915601
Paraphrase This Document
Need a fresh take? Get an instant paraphrase of this document with our AI Paraphraser
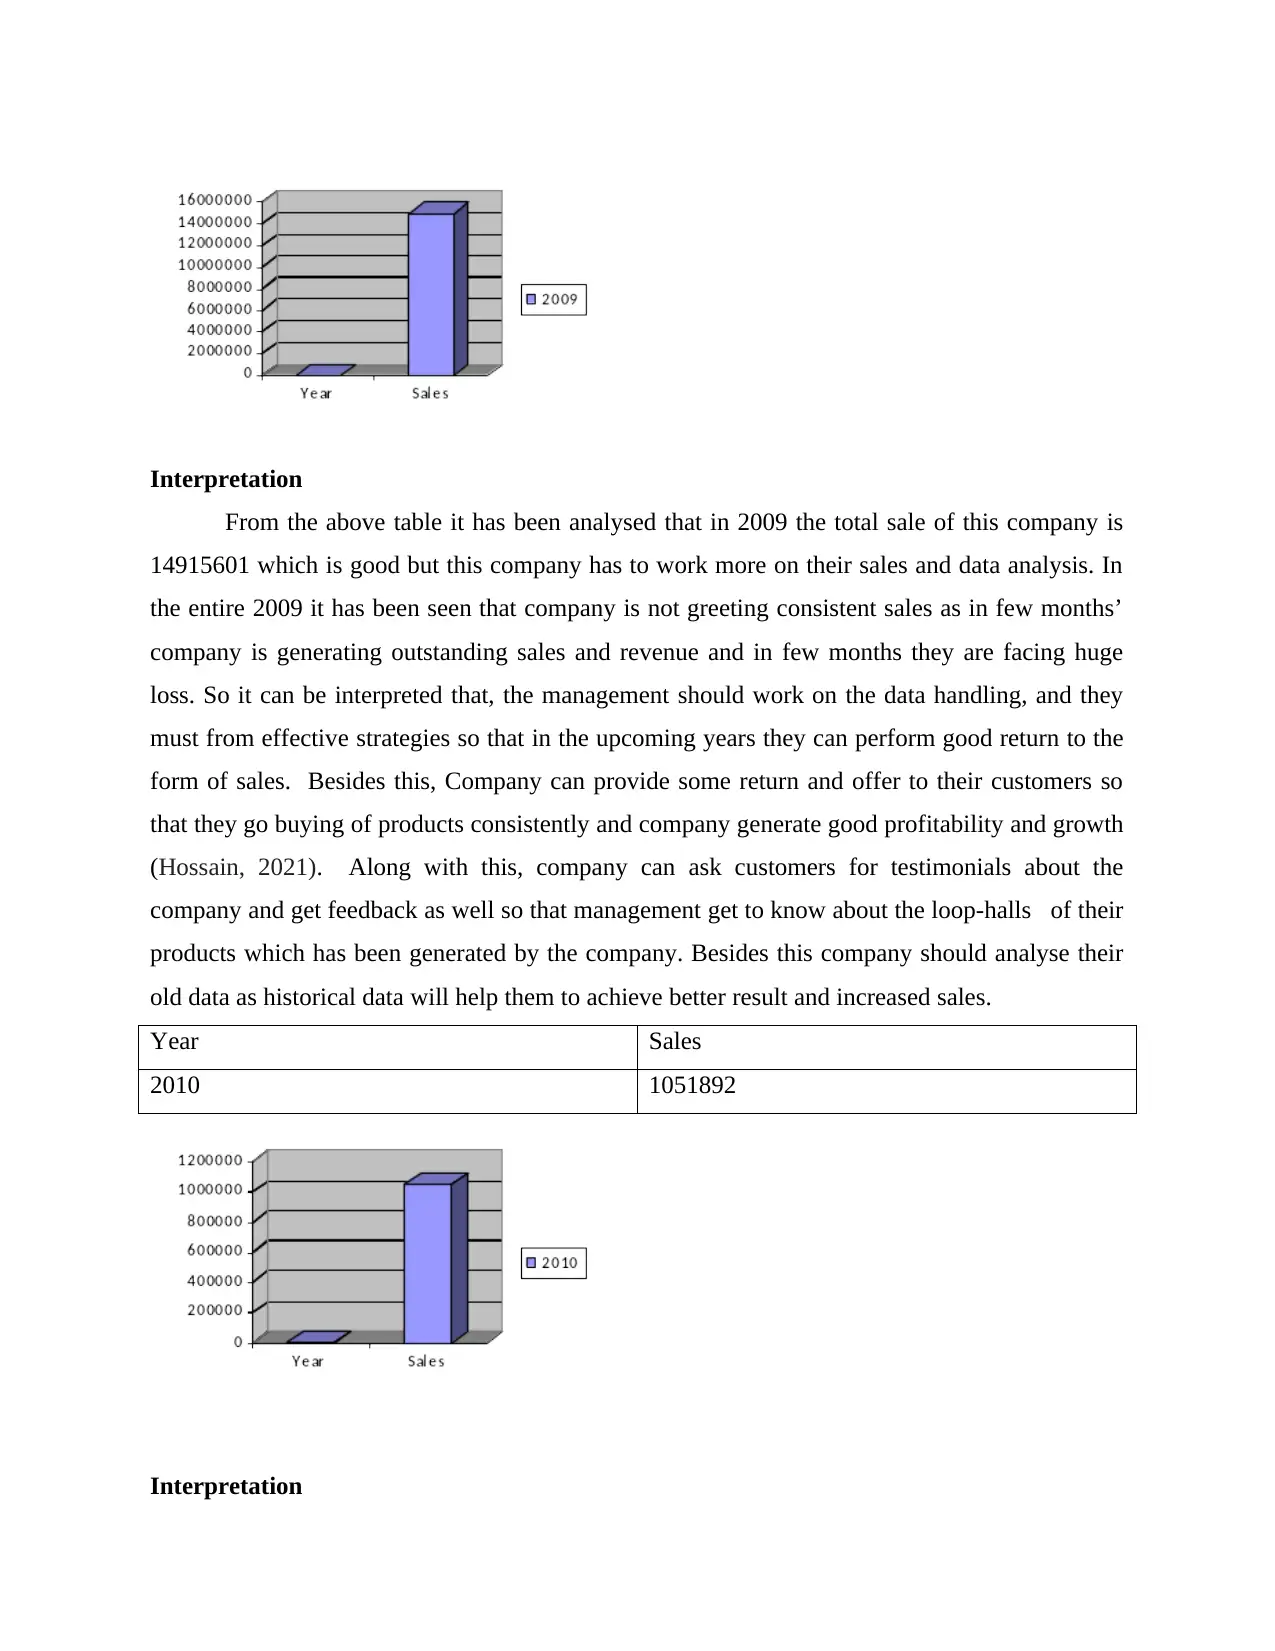
Interpretation
From the above table it has been analysed that in 2009 the total sale of this company is
14915601 which is good but this company has to work more on their sales and data analysis. In
the entire 2009 it has been seen that company is not greeting consistent sales as in few months’
company is generating outstanding sales and revenue and in few months they are facing huge
loss. So it can be interpreted that, the management should work on the data handling, and they
must from effective strategies so that in the upcoming years they can perform good return to the
form of sales. Besides this, Company can provide some return and offer to their customers so
that they go buying of products consistently and company generate good profitability and growth
(Hossain, 2021). Along with this, company can ask customers for testimonials about the
company and get feedback as well so that management get to know about the loop-halls of their
products which has been generated by the company. Besides this company should analyse their
old data as historical data will help them to achieve better result and increased sales.
Year Sales
2010 1051892
Interpretation
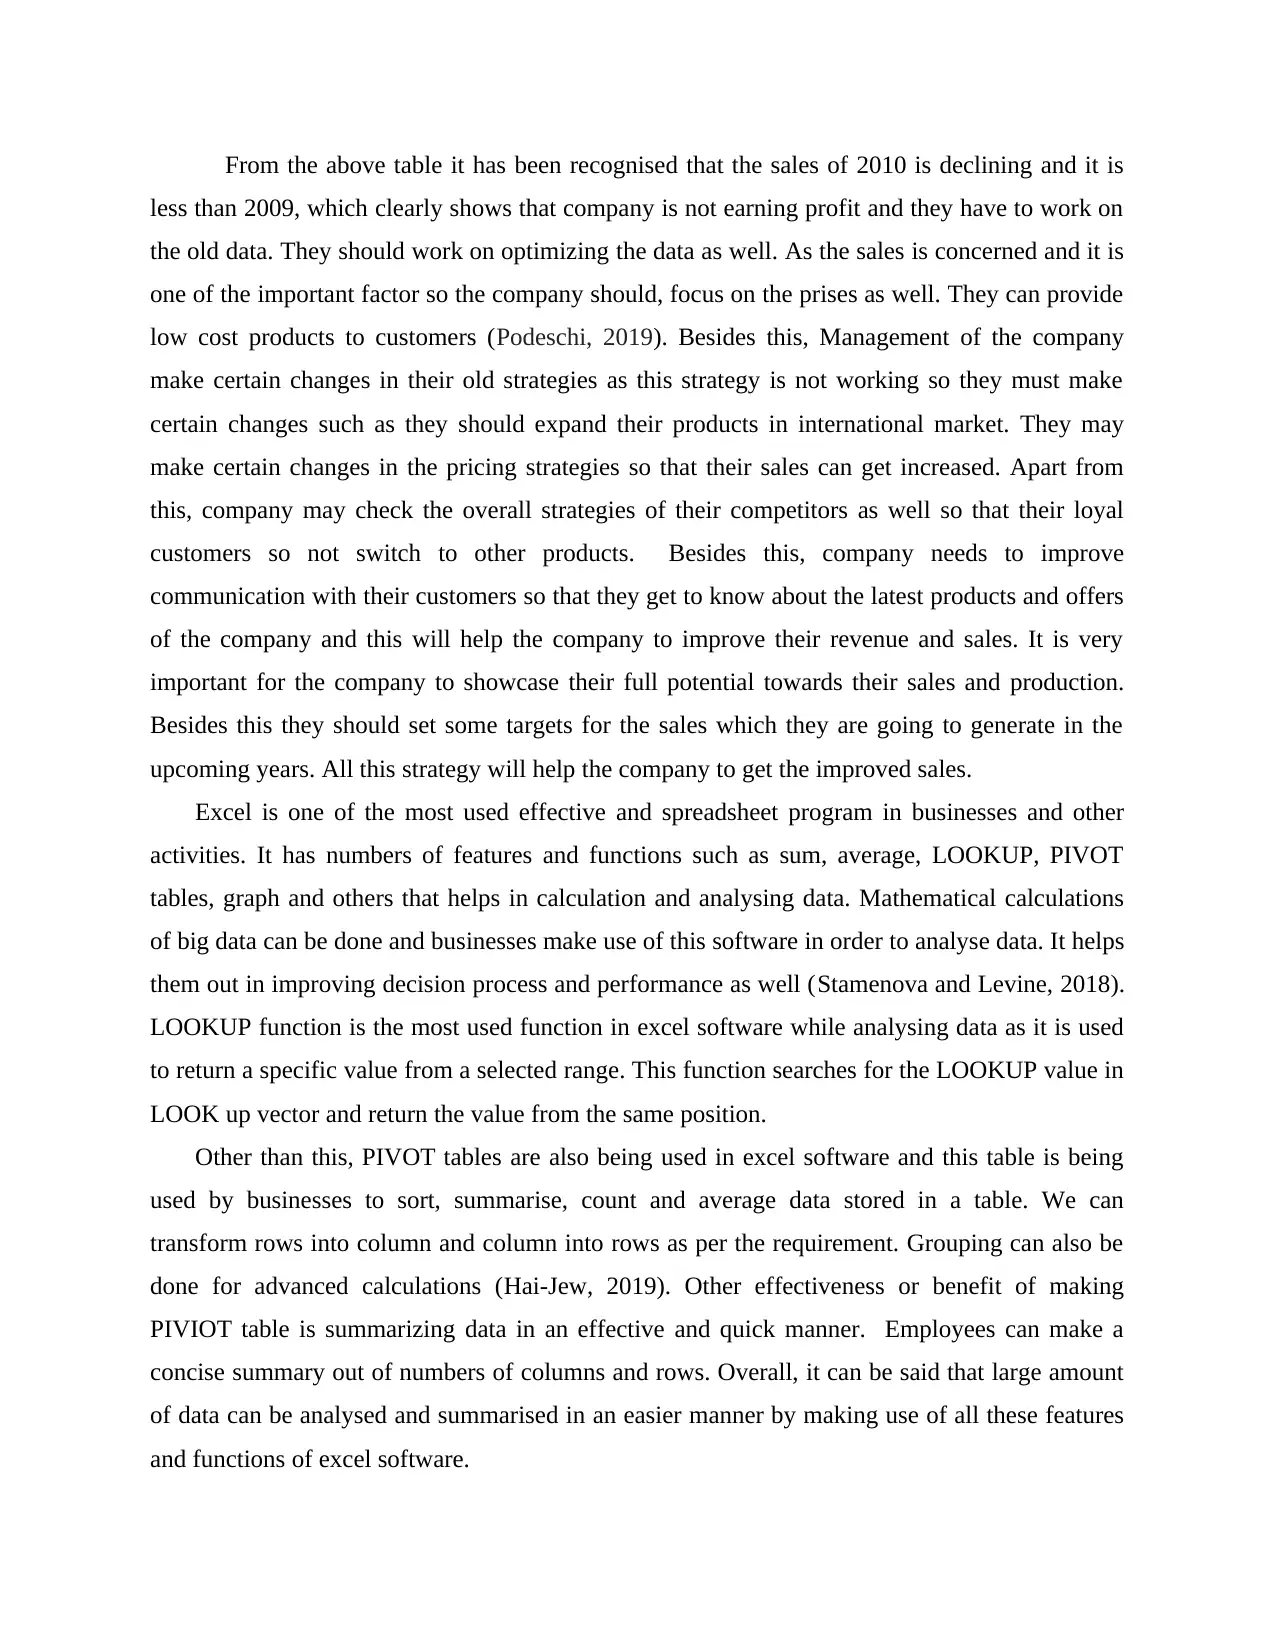
From the above table it has been recognised that the sales of 2010 is declining and it is
less than 2009, which clearly shows that company is not earning profit and they have to work on
the old data. They should work on optimizing the data as well. As the sales is concerned and it is
one of the important factor so the company should, focus on the prises as well. They can provide
low cost products to customers (Podeschi, 2019). Besides this, Management of the company
make certain changes in their old strategies as this strategy is not working so they must make
certain changes such as they should expand their products in international market. They may
make certain changes in the pricing strategies so that their sales can get increased. Apart from
this, company may check the overall strategies of their competitors as well so that their loyal
customers so not switch to other products. Besides this, company needs to improve
communication with their customers so that they get to know about the latest products and offers
of the company and this will help the company to improve their revenue and sales. It is very
important for the company to showcase their full potential towards their sales and production.
Besides this they should set some targets for the sales which they are going to generate in the
upcoming years. All this strategy will help the company to get the improved sales.
Excel is one of the most used effective and spreadsheet program in businesses and other
activities. It has numbers of features and functions such as sum, average, LOOKUP, PIVOT
tables, graph and others that helps in calculation and analysing data. Mathematical calculations
of big data can be done and businesses make use of this software in order to analyse data. It helps
them out in improving decision process and performance as well (Stamenova and Levine, 2018).
LOOKUP function is the most used function in excel software while analysing data as it is used
to return a specific value from a selected range. This function searches for the LOOKUP value in
LOOK up vector and return the value from the same position.
Other than this, PIVOT tables are also being used in excel software and this table is being
used by businesses to sort, summarise, count and average data stored in a table. We can
transform rows into column and column into rows as per the requirement. Grouping can also be
done for advanced calculations (Hai-Jew, 2019). Other effectiveness or benefit of making
PIVIOT table is summarizing data in an effective and quick manner. Employees can make a
concise summary out of numbers of columns and rows. Overall, it can be said that large amount
of data can be analysed and summarised in an easier manner by making use of all these features
and functions of excel software.
⊘ This is a preview!⊘
Do you want full access?
Subscribe today to unlock all pages.
Trusted by 1+ million students worldwide
PART 2
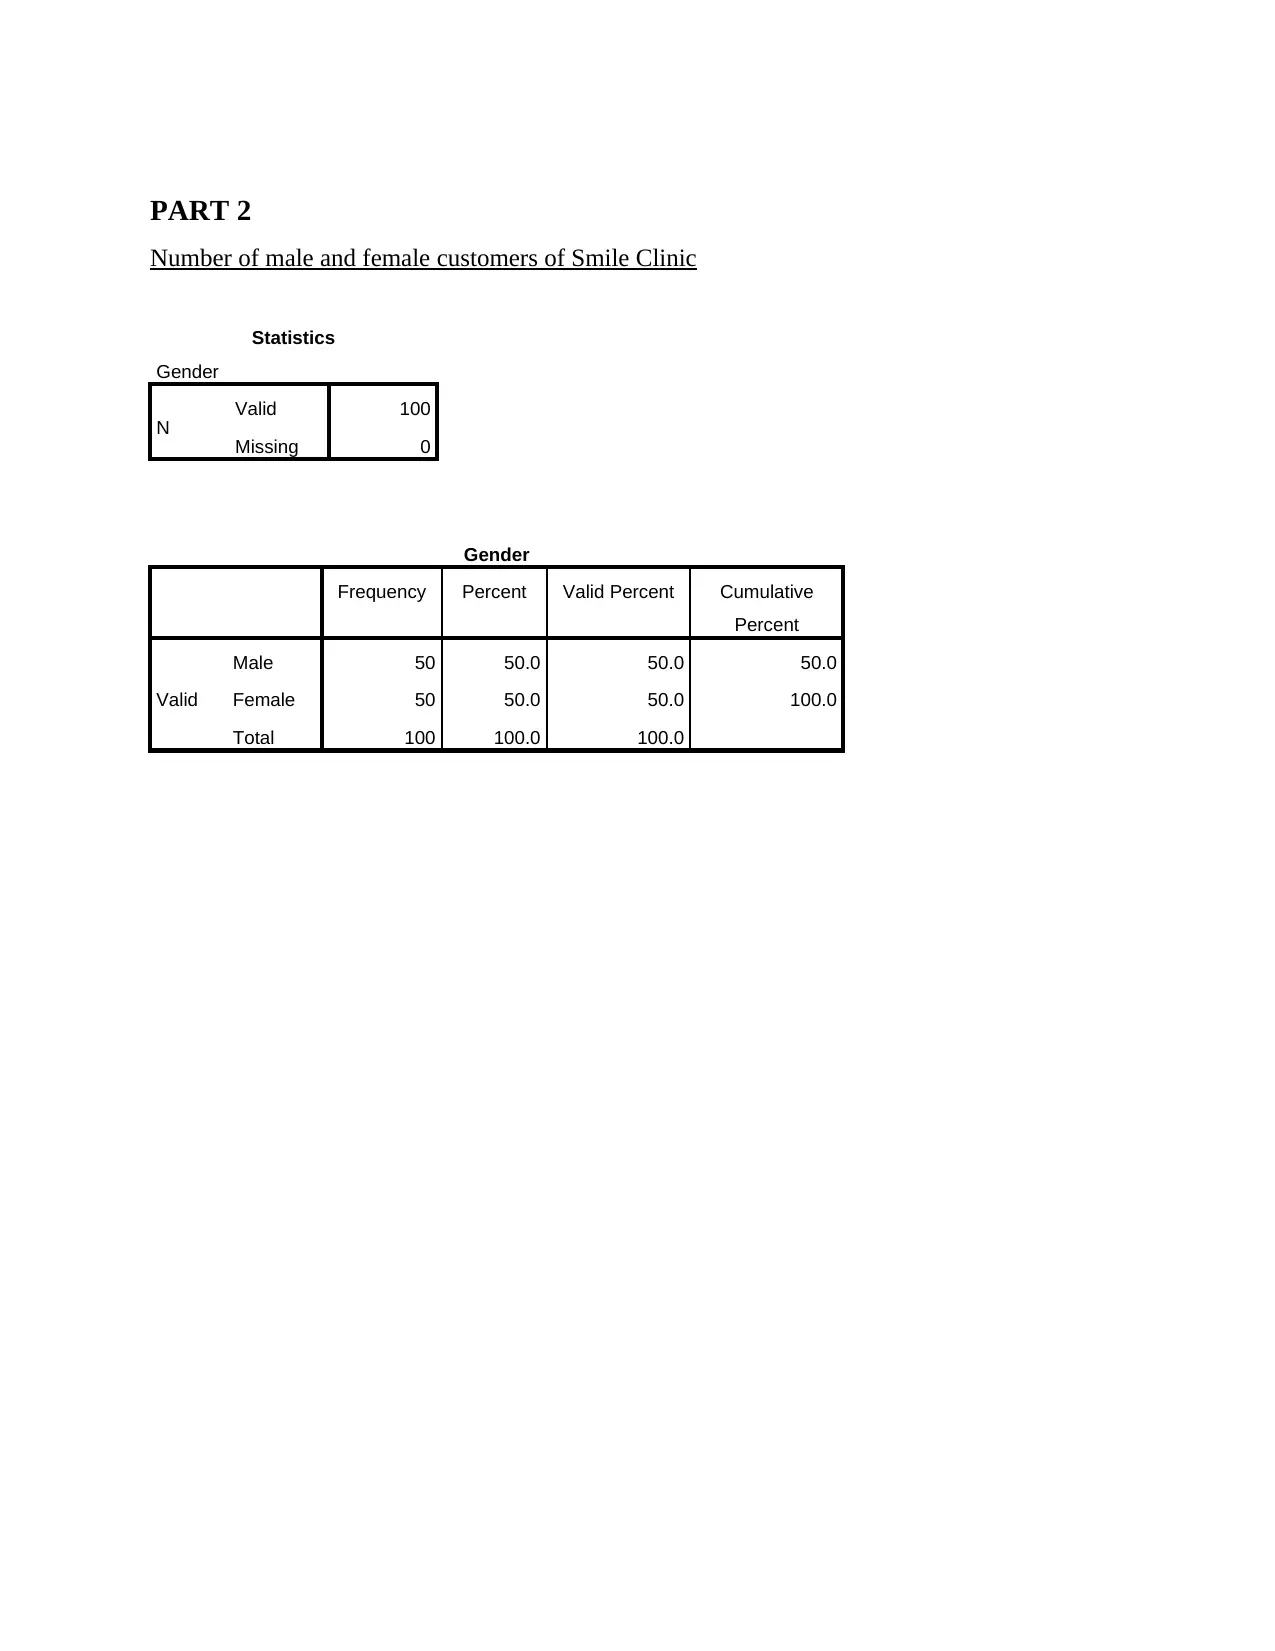
Number of male and female customers of Smile Clinic
Statistics
Gender
N Valid 100
Missing 0
Gender
Frequency Percent Valid Percent Cumulative
Percent
Valid
Male 50 50.0 50.0 50.0
Female 50 50.0 50.0 100.0
Total 100 100.0 100.0
Number of male and female customers of Smile Clinic
Statistics
Gender
N Valid 100
Missing 0
Gender
Frequency Percent Valid Percent Cumulative
Percent
Valid
Male 50 50.0 50.0 50.0
Female 50 50.0 50.0 100.0
Total 100 100.0 100.0
Paraphrase This Document
Need a fresh take? Get an instant paraphrase of this document with our AI Paraphraser
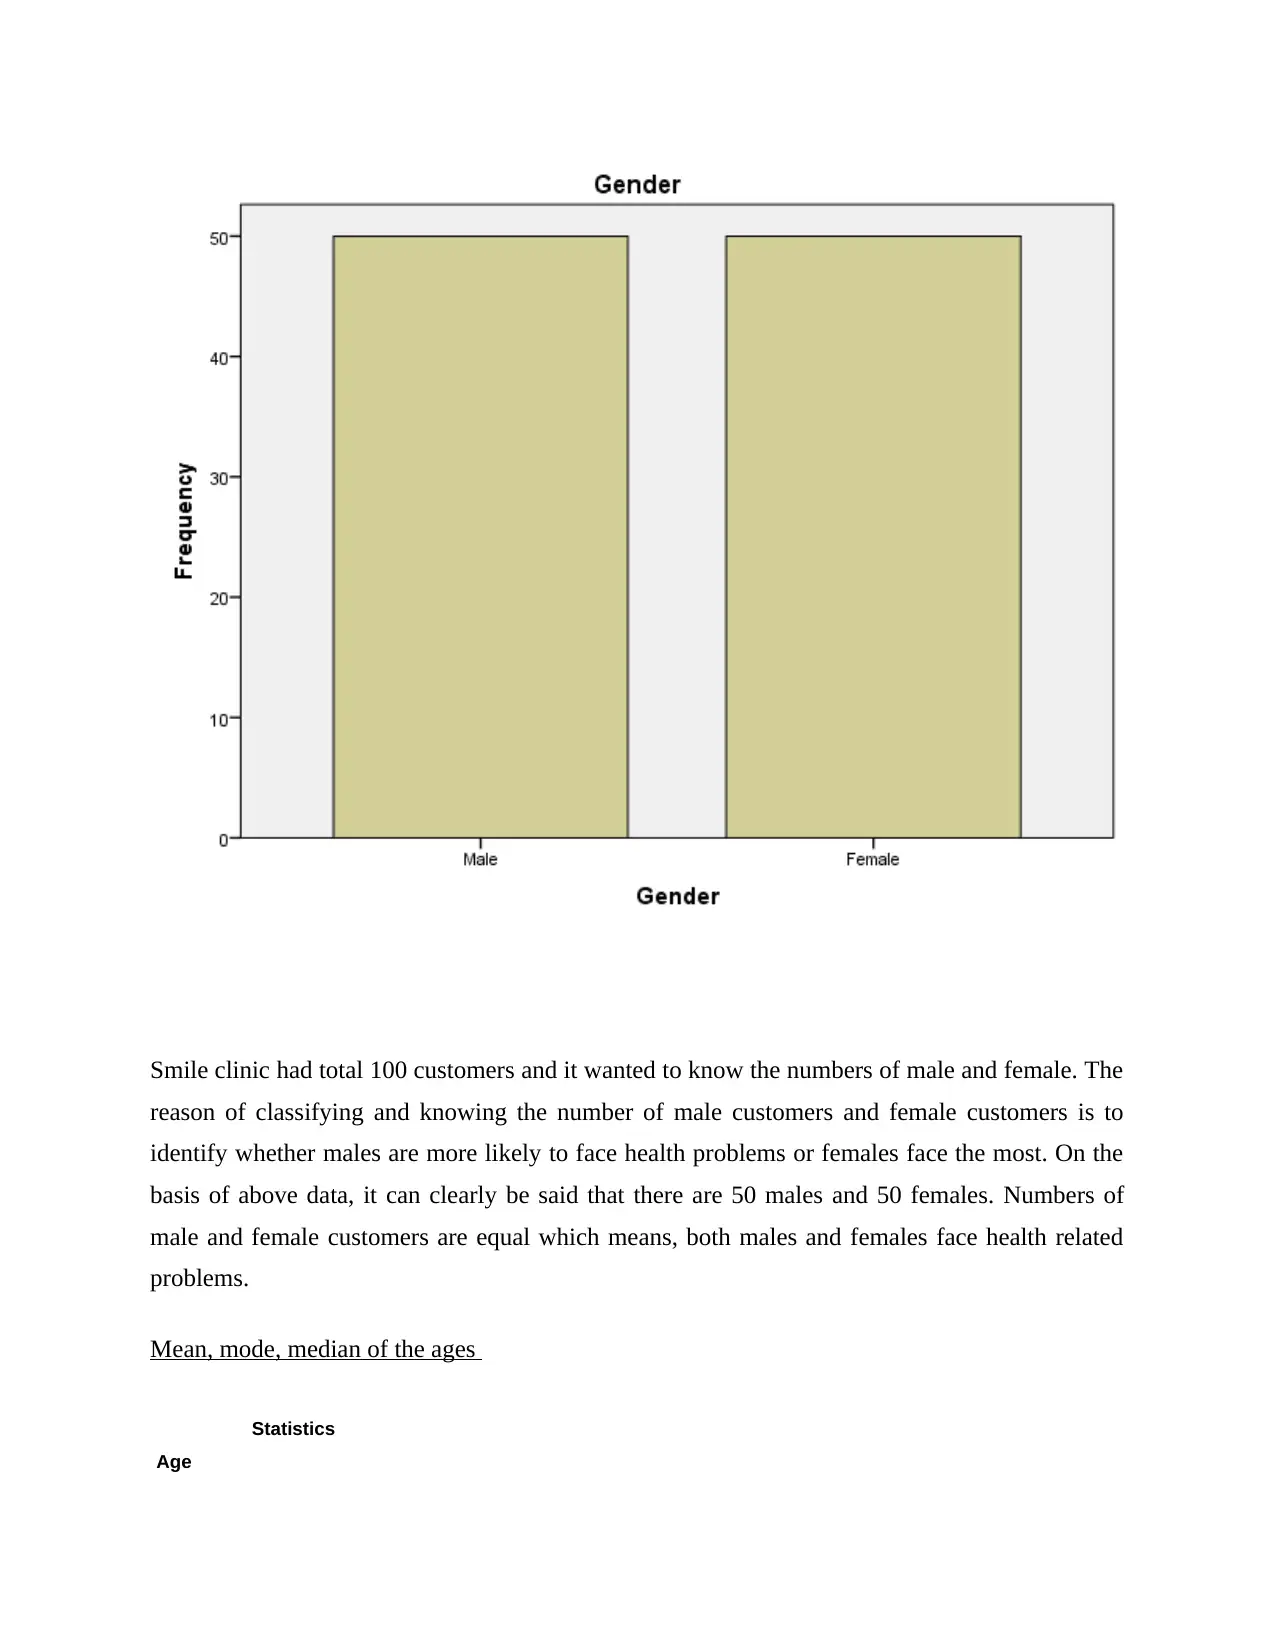
Smile clinic had total 100 customers and it wanted to know the numbers of male and female. The
reason of classifying and knowing the number of male customers and female customers is to
identify whether males are more likely to face health problems or females face the most. On the
basis of above data, it can clearly be said that there are 50 males and 50 females. Numbers of
male and female customers are equal which means, both males and females face health related
problems.
Mean, mode, median of the ages
Statistics
Age
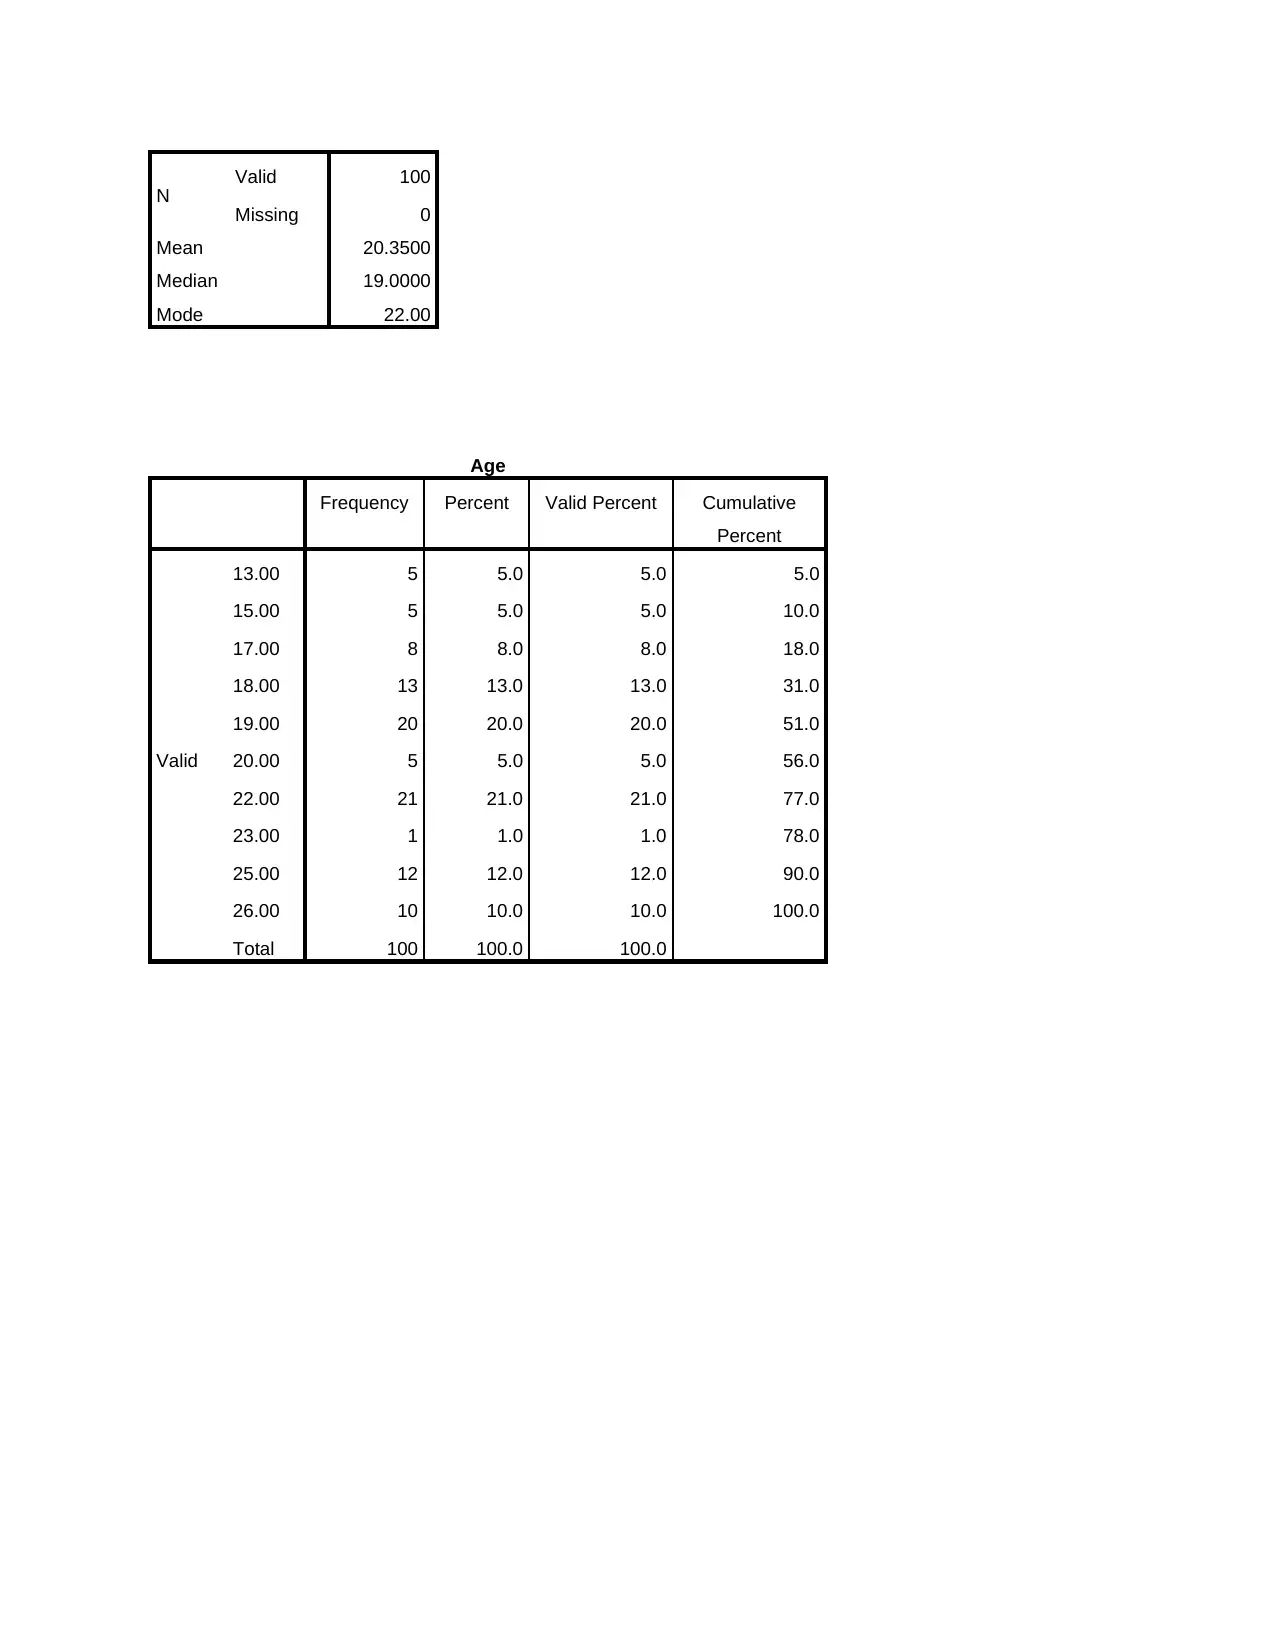
N Valid 100
Missing 0
Mean 20.3500
Median 19.0000
Mode 22.00
Age
Frequency Percent Valid Percent Cumulative
Percent
Valid
13.00 5 5.0 5.0 5.0
15.00 5 5.0 5.0 10.0
17.00 8 8.0 8.0 18.0
18.00 13 13.0 13.0 31.0
19.00 20 20.0 20.0 51.0
20.00 5 5.0 5.0 56.0
22.00 21 21.0 21.0 77.0
23.00 1 1.0 1.0 78.0
25.00 12 12.0 12.0 90.0
26.00 10 10.0 10.0 100.0
Total 100 100.0 100.0
⊘ This is a preview!⊘
Do you want full access?
Subscribe today to unlock all pages.
Trusted by 1+ million students worldwide
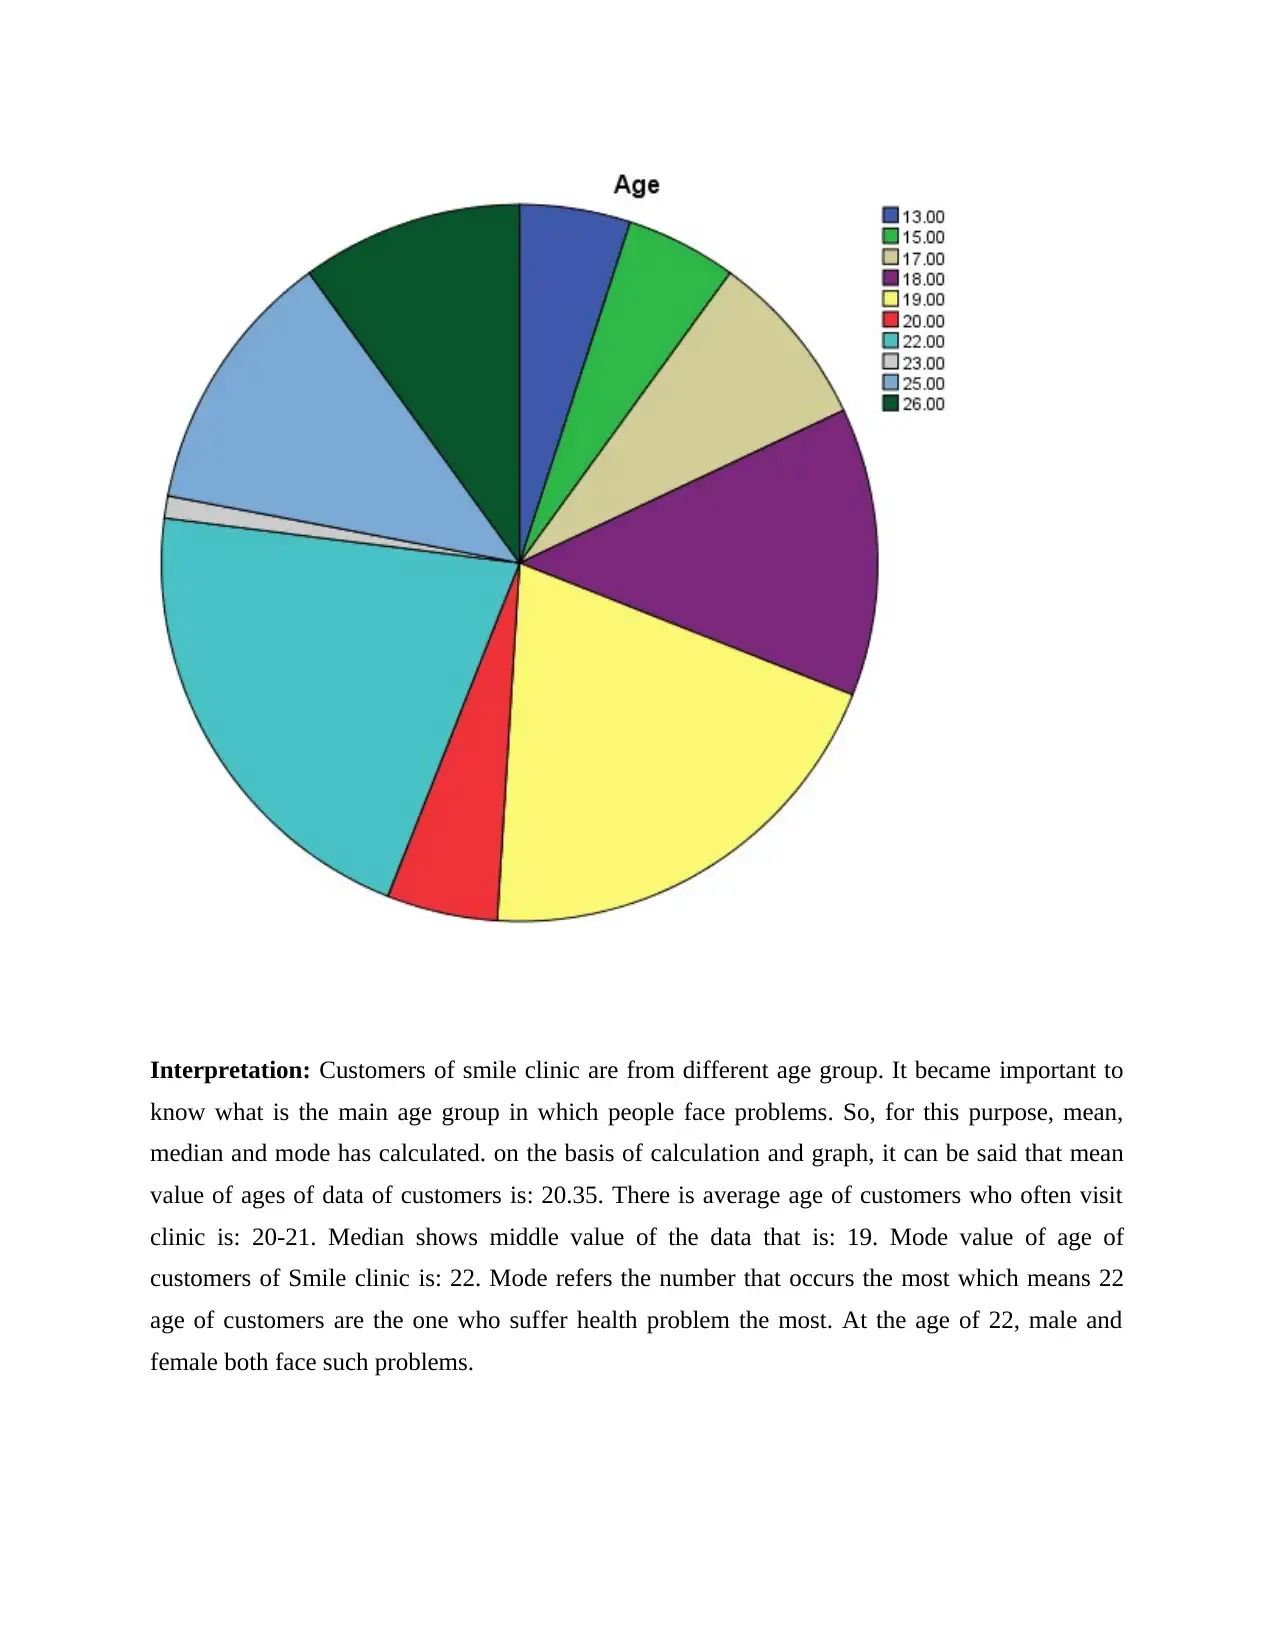
Interpretation: Customers of smile clinic are from different age group. It became important to
know what is the main age group in which people face problems. So, for this purpose, mean,
median and mode has calculated. on the basis of calculation and graph, it can be said that mean
value of ages of data of customers is: 20.35. There is average age of customers who often visit
clinic is: 20-21. Median shows middle value of the data that is: 19. Mode value of age of
customers of Smile clinic is: 22. Mode refers the number that occurs the most which means 22
age of customers are the one who suffer health problem the most. At the age of 22, male and
female both face such problems.
Paraphrase This Document
Need a fresh take? Get an instant paraphrase of this document with our AI Paraphraser
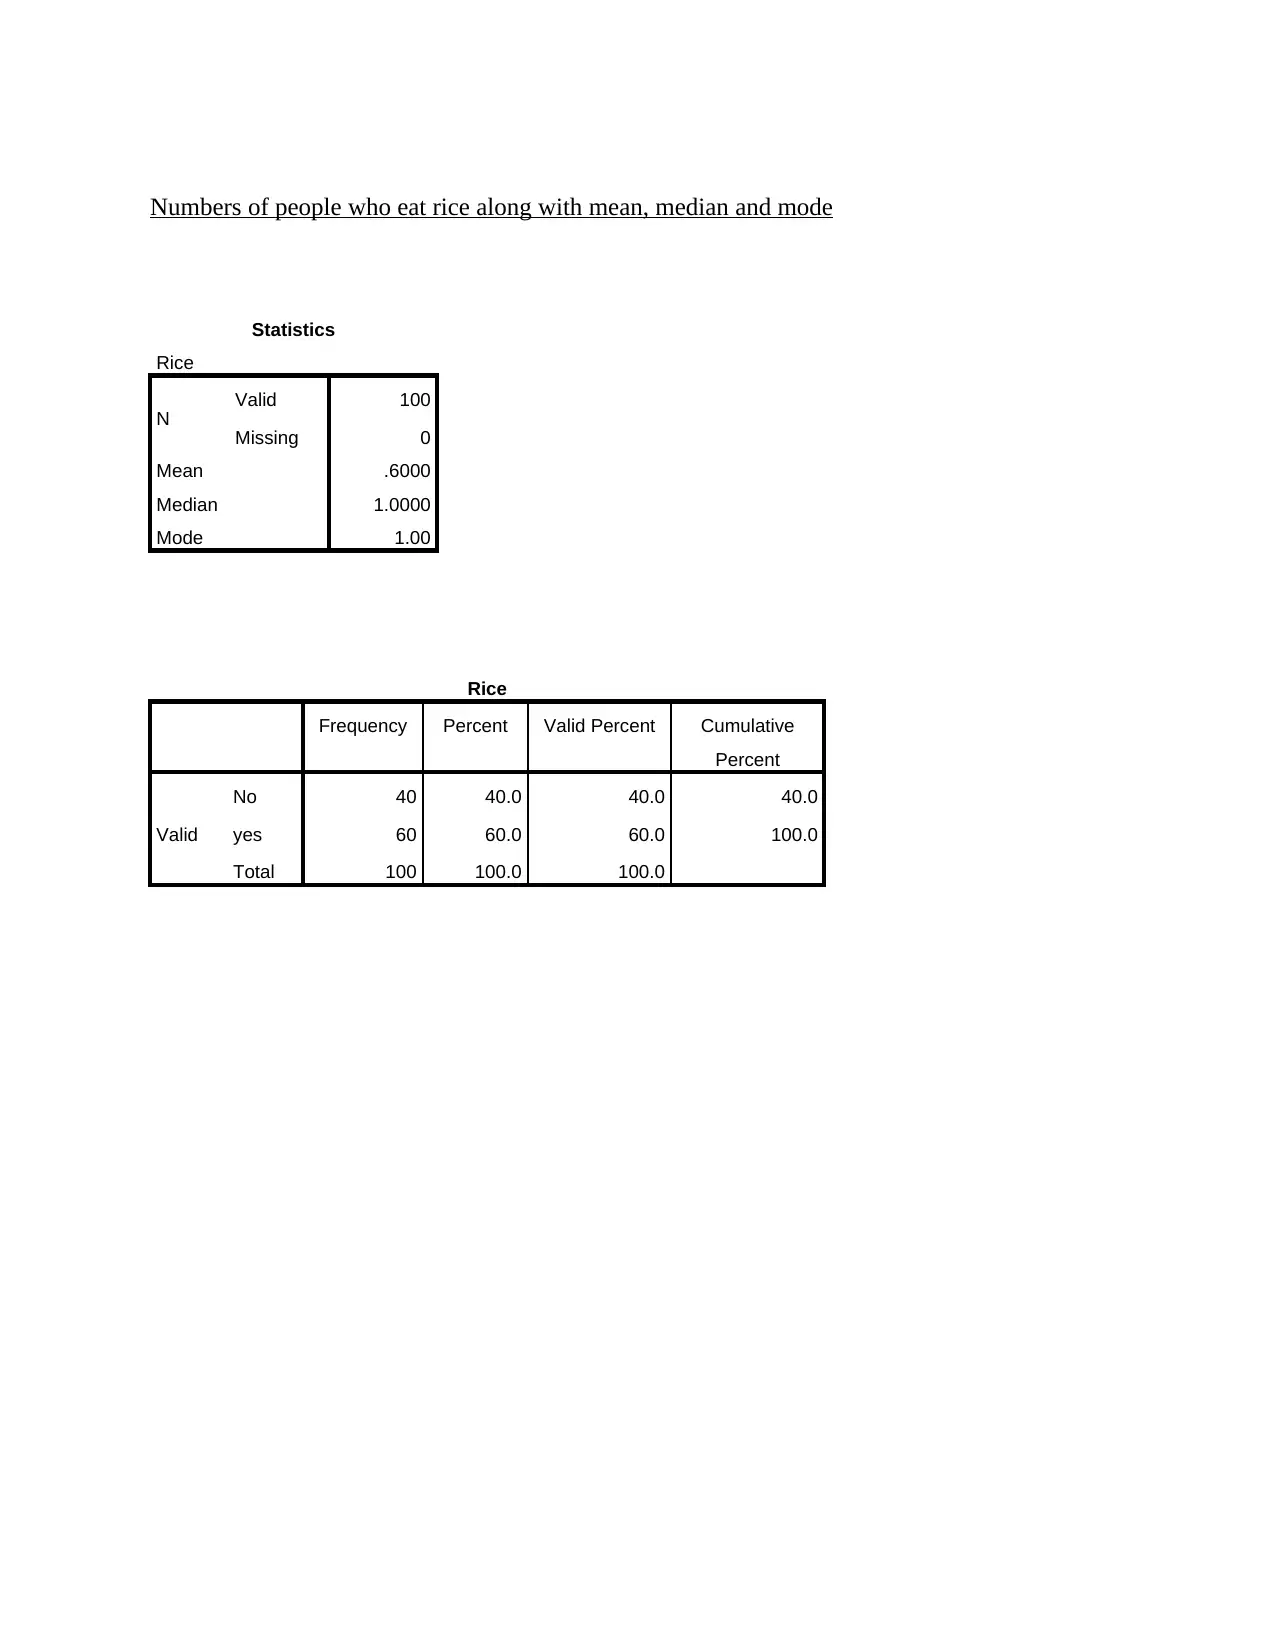
Numbers of people who eat rice along with mean, median and mode
Statistics
Rice
N Valid 100
Missing 0
Mean .6000
Median 1.0000
Mode 1.00
Rice
Frequency Percent Valid Percent Cumulative
Percent
Valid
No 40 40.0 40.0 40.0
yes 60 60.0 60.0 100.0
Total 100 100.0 100.0
Statistics
Rice
N Valid 100
Missing 0
Mean .6000
Median 1.0000
Mode 1.00
Rice
Frequency Percent Valid Percent Cumulative
Percent
Valid
No 40 40.0 40.0 40.0
yes 60 60.0 60.0 100.0
Total 100 100.0 100.0
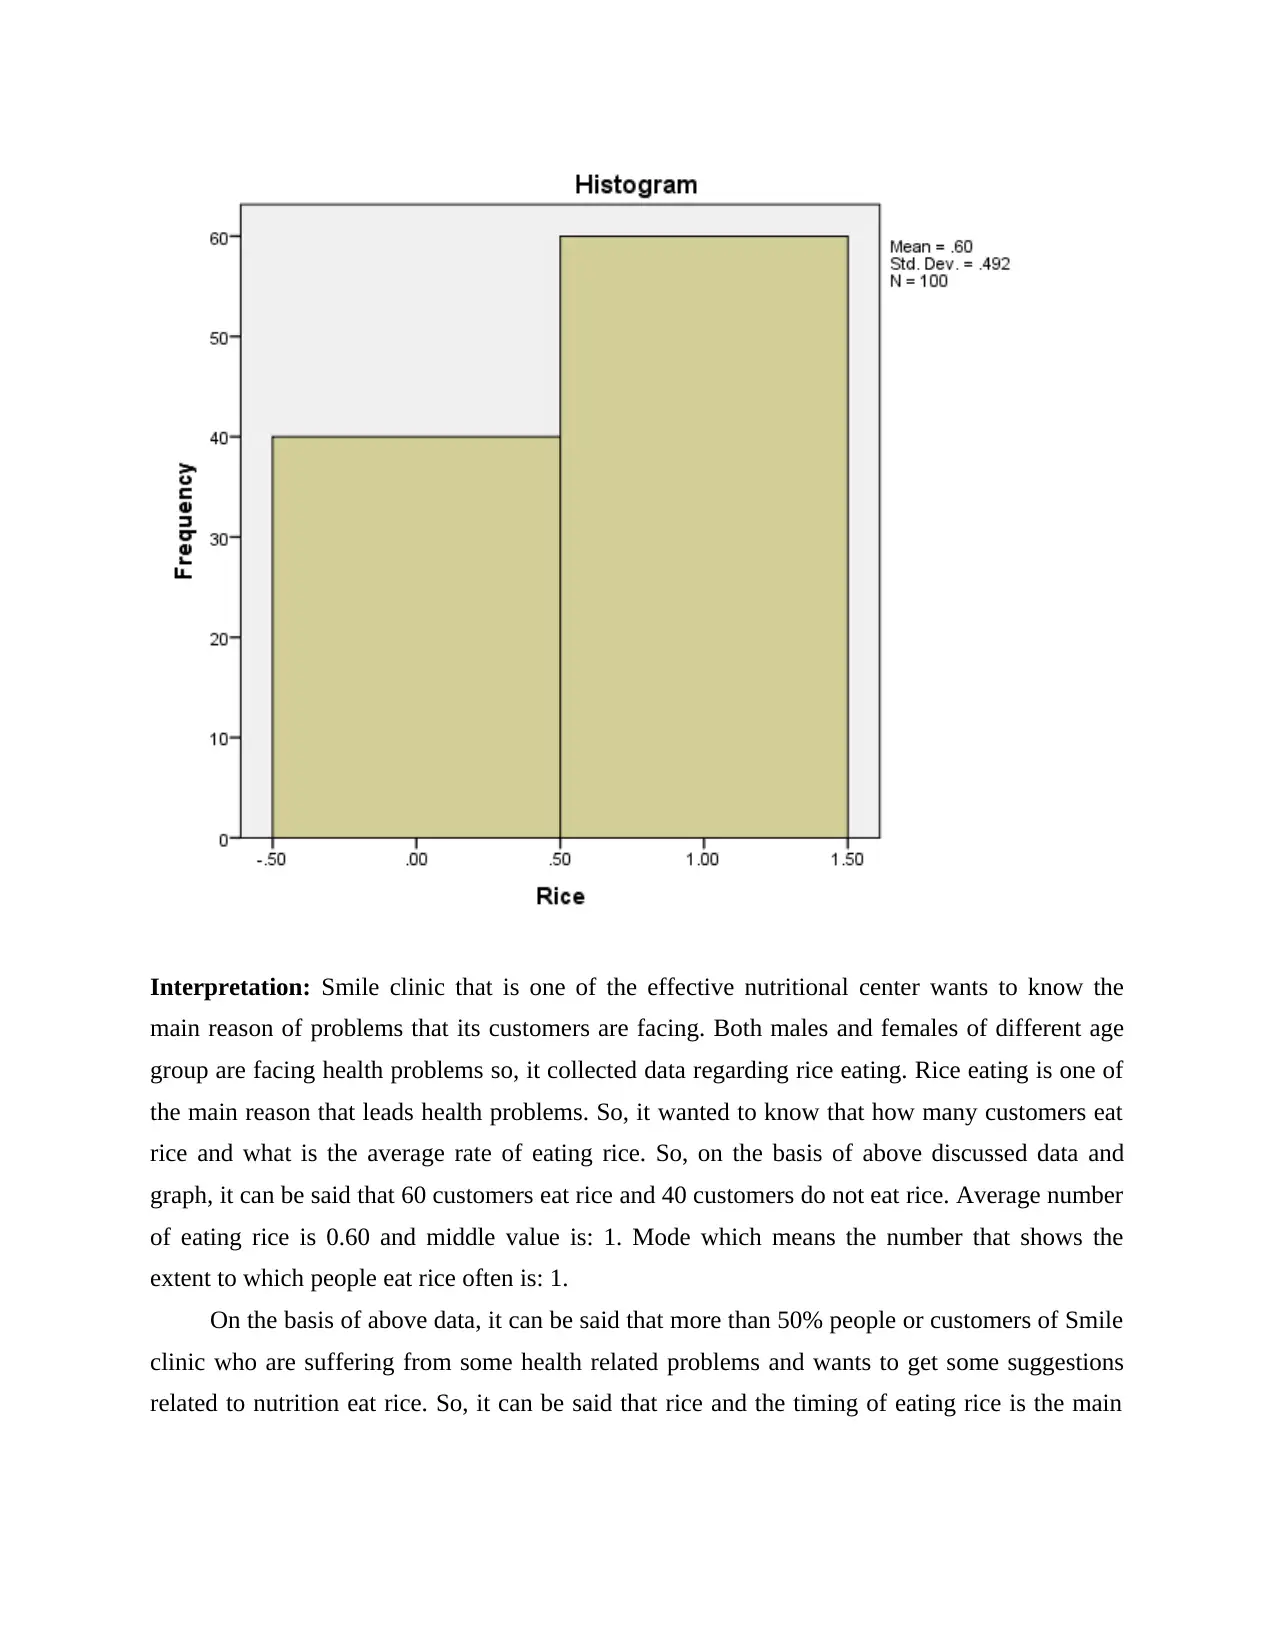
Interpretation: Smile clinic that is one of the effective nutritional center wants to know the
main reason of problems that its customers are facing. Both males and females of different age
group are facing health problems so, it collected data regarding rice eating. Rice eating is one of
the main reason that leads health problems. So, it wanted to know that how many customers eat
rice and what is the average rate of eating rice. So, on the basis of above discussed data and
graph, it can be said that 60 customers eat rice and 40 customers do not eat rice. Average number
of eating rice is 0.60 and middle value is: 1. Mode which means the number that shows the
extent to which people eat rice often is: 1.
On the basis of above data, it can be said that more than 50% people or customers of Smile
clinic who are suffering from some health related problems and wants to get some suggestions
related to nutrition eat rice. So, it can be said that rice and the timing of eating rice is the main
⊘ This is a preview!⊘
Do you want full access?
Subscribe today to unlock all pages.
Trusted by 1+ million students worldwide
1 out of 17
Related Documents


Your All-in-One AI-Powered Toolkit for Academic Success.
+13062052269
info@desklib.com
Available 24*7 on WhatsApp / Email
![[object Object]](/_next/static/media/star-bottom.7253800d.svg)
Unlock your academic potential
Copyright © 2020–2026 A2Z Services. All Rights Reserved. Developed and managed by ZUCOL.