Data Handling and Business Intelligence
VerifiedAdded on 2023/01/05
|13
|3321
|38
AI Summary
This document provides a comprehensive guide on data handling and business intelligence. It covers the uses of different excel formulas, data mining methods, advantages and disadvantages of SPSS, and more. The document also includes statistical analysis and correlation tests.
Contribute Materials
Your contribution can guide someone’s learning journey. Share your
documents today.

DATA HANDLING AND
BUSINESS INTELLIGENCE
BUSINESS INTELLIGENCE
Secure Best Marks with AI Grader
Need help grading? Try our AI Grader for instant feedback on your assignments.
Contents
PART 1............................................................................................................................................3
Uses of different excel formulas.............................................................................................3
PART 2............................................................................................................................................7
1. Using the nutrition.csv provided the workings with screenshots and explanation of results
are shown below:....................................................................................................................7
2. Data mining methods..........................................................................................................7
3. Advantages and Disadvantages of SPSS............................................................................8
REFERENCES..............................................................................................................................10
PART 1
Uses of different excel formulas
The process of collecting, recording, reviewing and showing useful and collected
information in a manner that is very much effective for the user is called, data handling. Business
intelligence (BI) optimises products and technologies to turn data into action knowledge that
inform the strategic management strategic decisions of even an enterprise. In papers, overviews,
analysis tools, charts, graphical displays, BI software view and interpret data sources and report
analytical results that can provide consumers with accurate information more about condition of
the enterprise.
Businesses can be mentioned for consumers, market owners, home supervisors, data
processing, routine performance analysis, including Microsoft Excel features (Changhong, Intel
IP Corp, 2018). Microsoft Excel includes the following features:
Evaluating AND Saving DATA: Microsoft Excel is indeed a great way to test the process
and manipulate information. It is possible to write details in separate columns and rows with
document. Data gathering is assisted by charts, graphs. The data received for the tracking
precision were perceived as the extreme range of the error function owing to the intrinsic
mistakes including its benchmark process. Standards are used for software appraisal and also for
measurement items. In this phase, a programme is visited and reviewed by evaluation
committees throughout refers to the sequence of process parameters composed of programme
characteristics assumed to be consistency measures. That is, there seems to be an expectation
which these procedures can contribute to quality results. The different forms of quality assurance
involving self-appraisal as well as site inspection teams, driven by established process
requirements, are more representative of these procedures. Knowledge is accessible from
Spread-sheet from numerous documents and records. Data is kept in sequence. In order to really
appreciate the tests, it allows us to devote a lot of time. It does not promote the retrieval of data
that use the Pivot Table.
DATA RECOVERY: Unless the information is compromised, users will get it from
Software. Data is derived from the MS Excel program from the DATA sheet. The conditions of
that same data failure, which data management programme used to build the replacement as well
as the backup goal information, the backup process of healing. Many desktop and laptop
recovery software products, for instance, enable customers to recover missing files themselves,
although a more complex method that involves IT interference is the retrieval of a compromised
archive from a disk backup. Data retrieval systems may be used to restore files that have not
been supported and erased unintentionally from the operating system of a device, but which
remain scattered on the storage device.
Formulating Study: The narrative report, can be published in MS Excel as well as in MS
Word format or table layout. This data can be accessed from MS Excel in that information. To
make simultaneous system differentiation, MS Excel could be used. Ultimately does MS Excel
track firms, but it also allows workers to log on a constant schedule their performance reports.
By using tables, diagrams, strategies and projections, teachers can support students.
Increasing the awareness: In the background the usually strive to reach degrees of
achievement, but success also lets us complete our future research. Why do we live this way for
several years? Analysis refers to tackling the problem of about what is or is really. Via numerous
algorithms and historical trends, users create possibility for the future. As per this report, the
preparation and development is carried out by organisations. Ever since, it seems to be the
international standard for excel, incorporating all kinds of features and functions. As such,
certain important excellent formulations are available to help all sorts of consumers. The number
of Excel formulas as well as operations that are useful is almost infinite. The platform will be
used for several sorts of uses, like budget creation, data management, chart and graph creation,
and much more. There have been formulas, even so, which can support individual cases. It will
concentrate on it for the variety of great Excel formulas which can be extended to almost any
circumstance. They will assist with the efficiency and making it a ton easier to maintain the
database.
CONDITIONAL FORMATTING: Under conditional classification, all related individuals can
be listed. A dependent model can also be more examples. This also extends to understanding of
concepts and replication recognition (Shaer, Kanj and Joshi, 2019). Conditional Formatting (CF)
is a method that requires an organism or set of columns to be formatted and to adjust the
configuration tax on the quality of the sample or the meaning of the formula. For eg, they could
only make a cell look bold if the cell's importance is larger than 100. The template that chooses
is added to the cells whenever the quality of the cell reaches the format requirement. Unless the
Secure Best Marks with AI Grader
Need help grading? Try our AI Grader for instant feedback on your assignments.
protect the network does not satisfy the format requirement, the standard format of the container
has been used.
Security: MS Excel offers comprehensive machine safety for Excel, enabling customers
to easily monitor their results. With simple visual software, the two MS Excel documents were
kept inside an excellent archive. They file the basic information in MS Spread-sheets as well as
hold the data organised such that is save time. All individual wants to secure their information, as
well as to solve this issue, MS Excel is very good. But no one is willing to replace them or
destroy them.
IF Function
In Excel the IF function or IF statement comprises of a 3-piece comma condition. In this
scenario, it is easy and seeing what sales and profit points are lowered or on what period the
vendor's transaction was, and also how point by point the IF function is executed.
Copy and insert the taxation period, sales and profit for the very first time on different
pages.
Restructure old information into the first layout of the manufacturing method document.
Using the form 'IF Part'. Form a type code = if (sort of virus: B2>C3),
Keep adding a cellular key to also be verified if the consumer satisfies the criteria.
Pick a comma: Select "Increase"
Remove the box; and if the condition is not met, press Enter.
If a feature emphasises the importance of B3, because if B3's value will be lower than the
component of B3, the function of B1 would therefore imply that perhaps the parameters of IF is
much more essential than B3.' As this feature can be seen, since they click the Enter button users
can receive the cell B4 format. Switch the handles from D4 to cellular D8400 seeing the effect.
If people need to read what H Lookup as well as V lookup will be in a programme, they would
not be disappointed. If the consumers like it or not is an essential skill. If they function with
small numbers, they can consider everything in depth. This would then require longer effort for
the expansion of the quest to find anything in the results.
Lookup Value: A column or the foundation including the quest piece. That's really the
foundation of the thread.
Table series: The requisite map of context. It's hard to pick what the user want from their table.
Row index number: The goal number is displayed in the amounts of the lines. The initial row
should be 1.
Range_ lookup]: The table includes two versions of the identical set, one right (1) whereas
another other wrong (0). The series’ have the second match.
Use of Lookup function
Value of lookup: A section or line field matches a query and recovers the identical quality
through the default actions of the section or line region in that LOOKUP overrides such issues
(Chiabrando, Sammartano and Spanò, 2016). Using Cell G2, H2 and I2 regarding required times,
purchases and income. It is necessary to acquire G3, H3 and I3. Choose the Lookup function and
assign the H3 cell; use the Lookup button as a G3 cell.
Series: selection of Value from A2 to C8400 (A2:C8400) for the entire data set.
[Range_ lookup]: B2 to B8400 (B2:B8400) for the cell to be purchased.
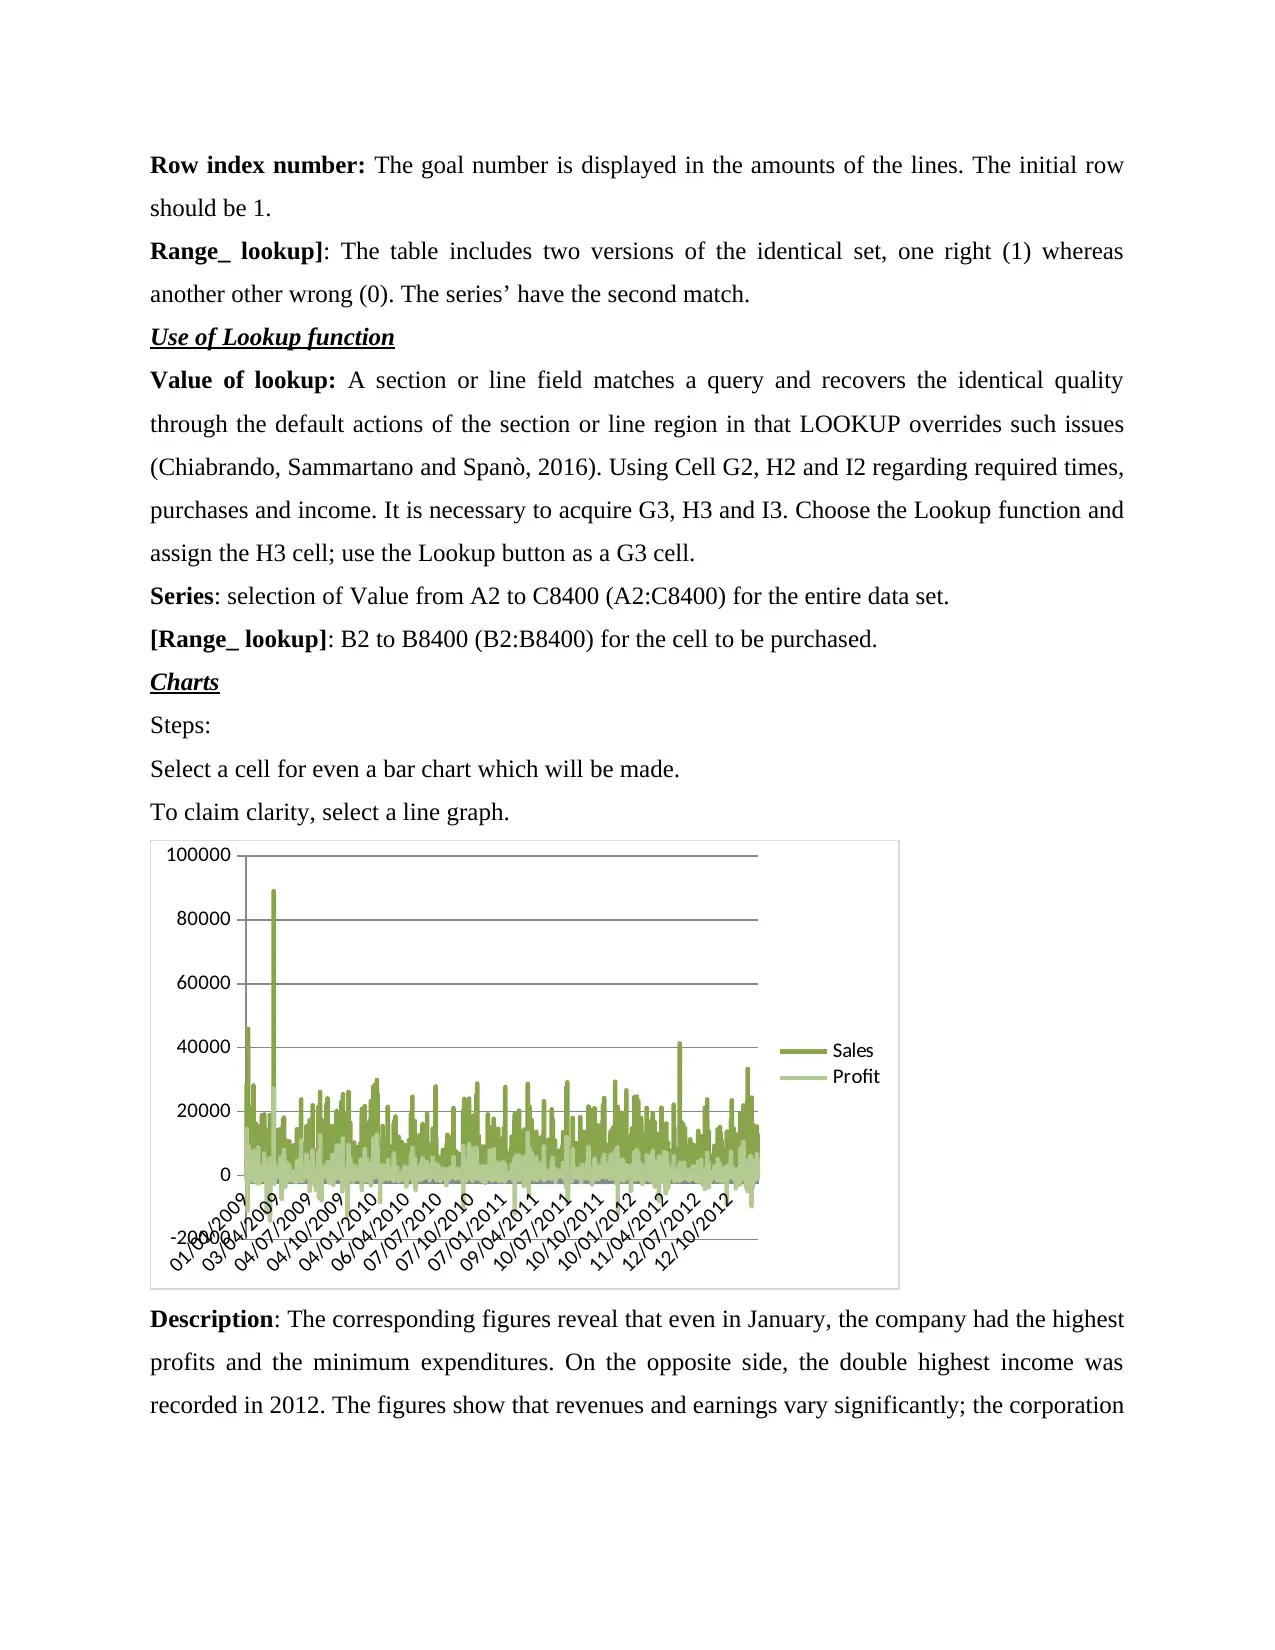
Charts
Steps:
Select a cell for even a bar chart which will be made.
To claim clarity, select a line graph.
01/01/2009
03/04/2009
04/07/2009
04/10/2009
04/01/2010
06/04/2010
07/07/2010
07/10/2010
07/01/2011
09/04/2011
10/07/2011
10/10/2011
10/01/2012
11/04/2012
12/07/2012
12/10/2012
-20000
0
20000
40000
60000
80000
100000
Sales
Profit
Description: The corresponding figures reveal that even in January, the company had the highest
profits and the minimum expenditures. On the opposite side, the double highest income was
recorded in 2012. The figures show that revenues and earnings vary significantly; the corporation
should be 1.
Range_ lookup]: The table includes two versions of the identical set, one right (1) whereas
another other wrong (0). The series’ have the second match.
Use of Lookup function
Value of lookup: A section or line field matches a query and recovers the identical quality
through the default actions of the section or line region in that LOOKUP overrides such issues
(Chiabrando, Sammartano and Spanò, 2016). Using Cell G2, H2 and I2 regarding required times,
purchases and income. It is necessary to acquire G3, H3 and I3. Choose the Lookup function and
assign the H3 cell; use the Lookup button as a G3 cell.
Series: selection of Value from A2 to C8400 (A2:C8400) for the entire data set.
[Range_ lookup]: B2 to B8400 (B2:B8400) for the cell to be purchased.
Charts
Steps:
Select a cell for even a bar chart which will be made.
To claim clarity, select a line graph.
01/01/2009
03/04/2009
04/07/2009
04/10/2009
04/01/2010
06/04/2010
07/07/2010
07/10/2010
07/01/2011
09/04/2011
10/07/2011
10/10/2011
10/01/2012
11/04/2012
12/07/2012
12/10/2012
-20000
0
20000
40000
60000
80000
100000
Sales
Profit
Description: The corresponding figures reveal that even in January, the company had the highest
profits and the minimum expenditures. On the opposite side, the double highest income was
recorded in 2012. The figures show that revenues and earnings vary significantly; the corporation
suffered considerable losses throughout 2009 through 2010 including 2012. Through 2009,
actual sales rose, whereas in subsequent years there was no decrease in 2009.
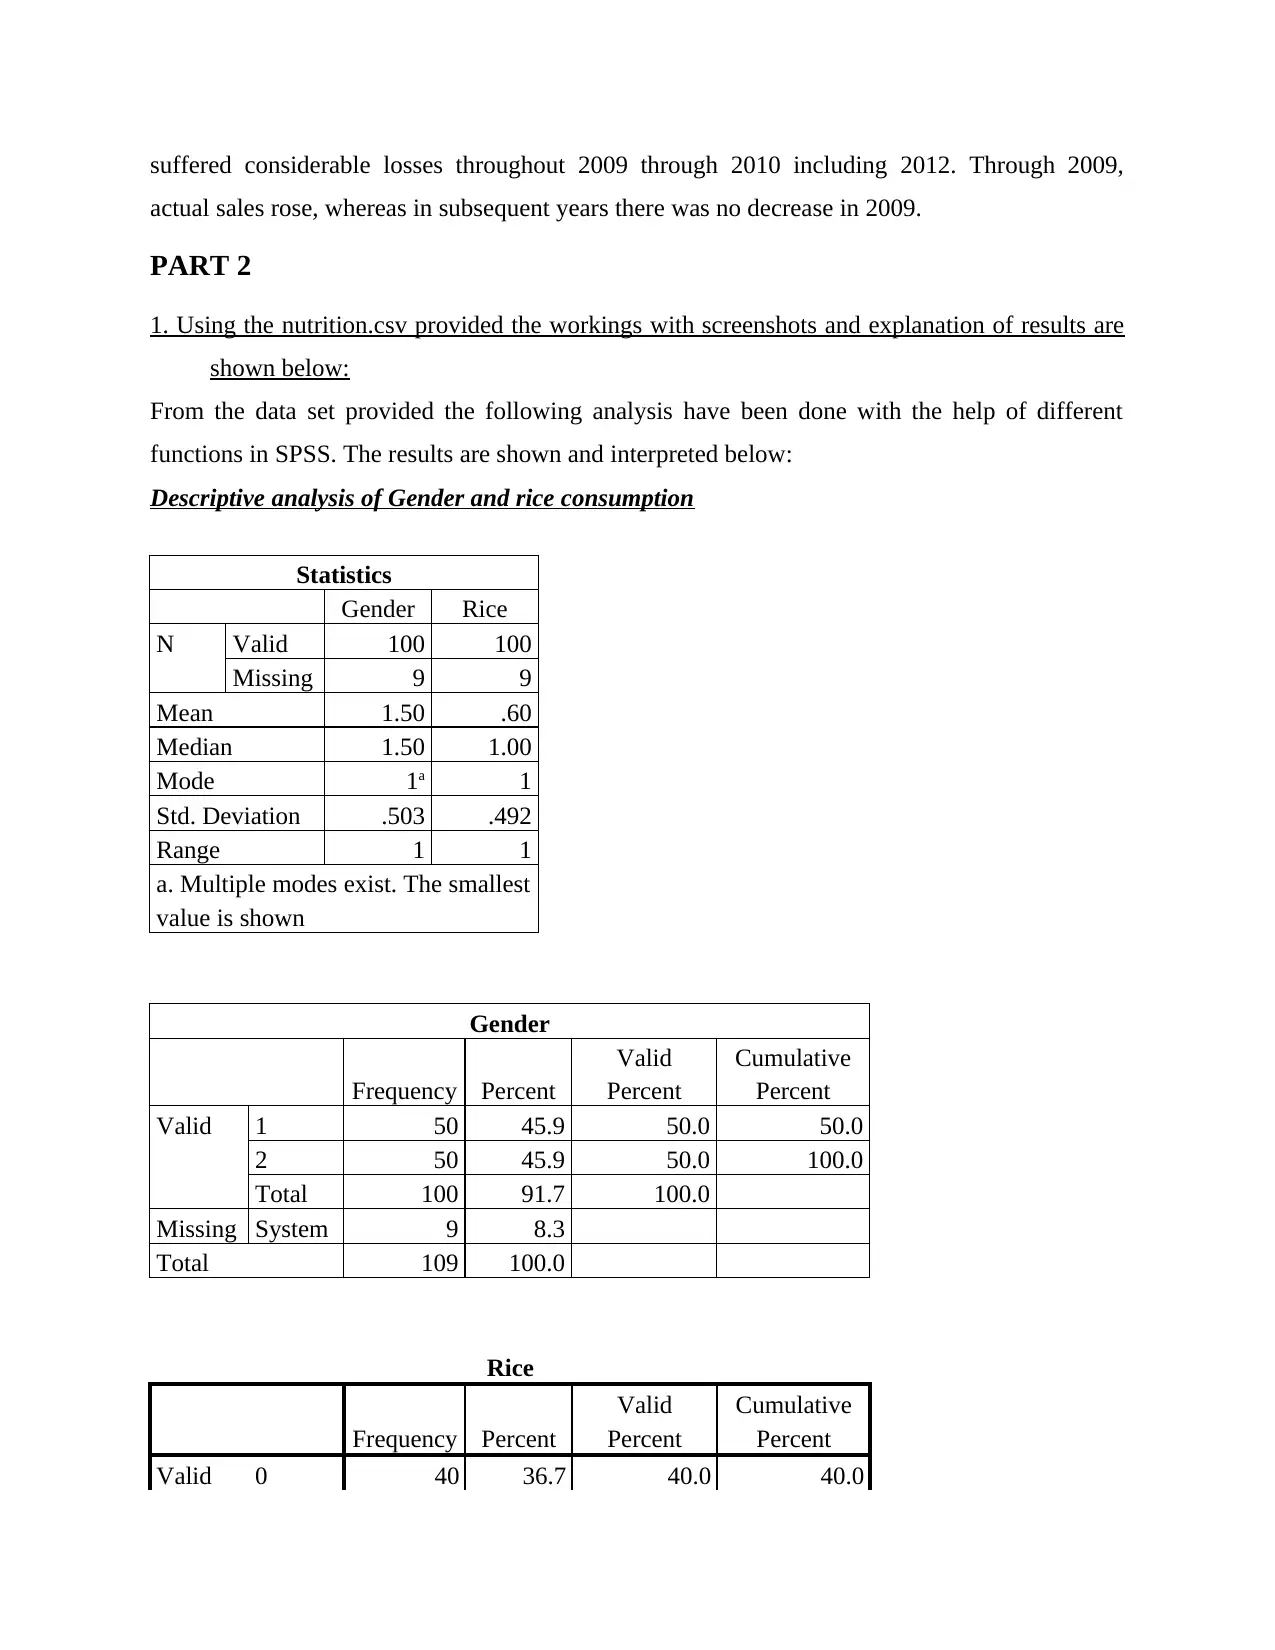
PART 2
1. Using the nutrition.csv provided the workings with screenshots and explanation of results are
shown below:
From the data set provided the following analysis have been done with the help of different
functions in SPSS. The results are shown and interpreted below:
Descriptive analysis of Gender and rice consumption
Statistics
Gender Rice
N Valid 100 100
Missing 9 9
Mean 1.50 .60
Median 1.50 1.00
Mode 1a 1
Std. Deviation .503 .492
Range 1 1
a. Multiple modes exist. The smallest
value is shown
Gender
Frequency Percent
Valid
Percent
Cumulative
Percent
Valid 1 50 45.9 50.0 50.0
2 50 45.9 50.0 100.0
Total 100 91.7 100.0
Missing System 9 8.3
Total 109 100.0
Rice
Frequency Percent
Valid
Percent
Cumulative
Percent
Valid 0 40 36.7 40.0 40.0
actual sales rose, whereas in subsequent years there was no decrease in 2009.
PART 2
1. Using the nutrition.csv provided the workings with screenshots and explanation of results are
shown below:
From the data set provided the following analysis have been done with the help of different
functions in SPSS. The results are shown and interpreted below:
Descriptive analysis of Gender and rice consumption
Statistics
Gender Rice
N Valid 100 100
Missing 9 9
Mean 1.50 .60
Median 1.50 1.00
Mode 1a 1
Std. Deviation .503 .492
Range 1 1
a. Multiple modes exist. The smallest
value is shown
Gender
Frequency Percent
Valid
Percent
Cumulative
Percent
Valid 1 50 45.9 50.0 50.0
2 50 45.9 50.0 100.0
Total 100 91.7 100.0
Missing System 9 8.3
Total 109 100.0
Rice
Frequency Percent
Valid
Percent
Cumulative
Percent
Valid 0 40 36.7 40.0 40.0
Paraphrase This Document
Need a fresh take? Get an instant paraphrase of this document with our AI Paraphraser
1 60 55.0 60.0 100.0
Total 100 91.7 100.0
Missing System 9 8.3
Total 109 100.0
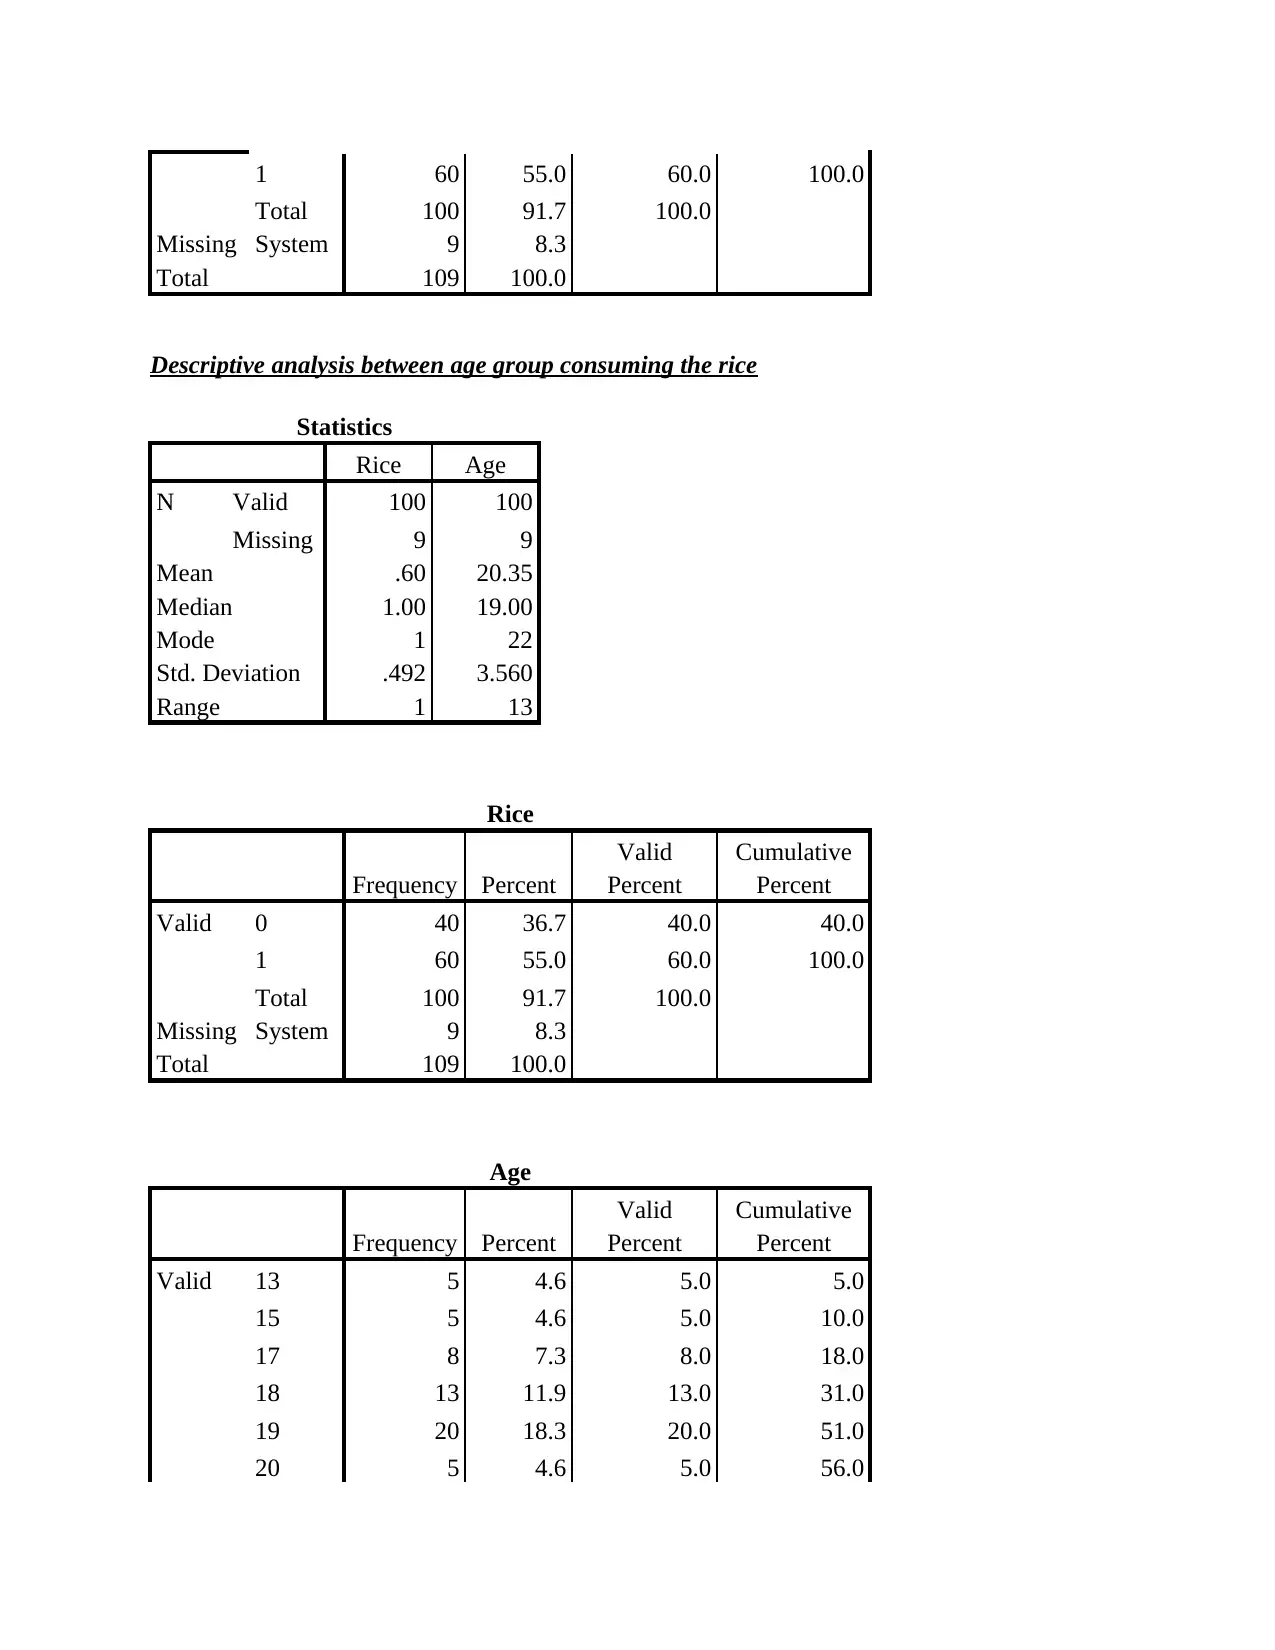
Descriptive analysis between age group consuming the rice
Statistics
Rice Age
N Valid 100 100
Missing 9 9
Mean .60 20.35
Median 1.00 19.00
Mode 1 22
Std. Deviation .492 3.560
Range 1 13
Rice
Frequency Percent
Valid
Percent
Cumulative
Percent
Valid 0 40 36.7 40.0 40.0
1 60 55.0 60.0 100.0
Total 100 91.7 100.0
Missing System 9 8.3
Total 109 100.0
Age
Frequency Percent
Valid
Percent
Cumulative
Percent
Valid 13 5 4.6 5.0 5.0
15 5 4.6 5.0 10.0
17 8 7.3 8.0 18.0
18 13 11.9 13.0 31.0
19 20 18.3 20.0 51.0
20 5 4.6 5.0 56.0
Total 100 91.7 100.0
Missing System 9 8.3
Total 109 100.0
Descriptive analysis between age group consuming the rice
Statistics
Rice Age
N Valid 100 100
Missing 9 9
Mean .60 20.35
Median 1.00 19.00
Mode 1 22
Std. Deviation .492 3.560
Range 1 13
Rice
Frequency Percent
Valid
Percent
Cumulative
Percent
Valid 0 40 36.7 40.0 40.0
1 60 55.0 60.0 100.0
Total 100 91.7 100.0
Missing System 9 8.3
Total 109 100.0
Age
Frequency Percent
Valid
Percent
Cumulative
Percent
Valid 13 5 4.6 5.0 5.0
15 5 4.6 5.0 10.0
17 8 7.3 8.0 18.0
18 13 11.9 13.0 31.0
19 20 18.3 20.0 51.0
20 5 4.6 5.0 56.0
22 21 19.3 21.0 77.0
23 1 .9 1.0 78.0
25 12 11.0 12.0 90.0
26 10 9.2 10.0 100.0
Total 100 91.7 100.0
Missing System 9 8.3
Total 109 100.0
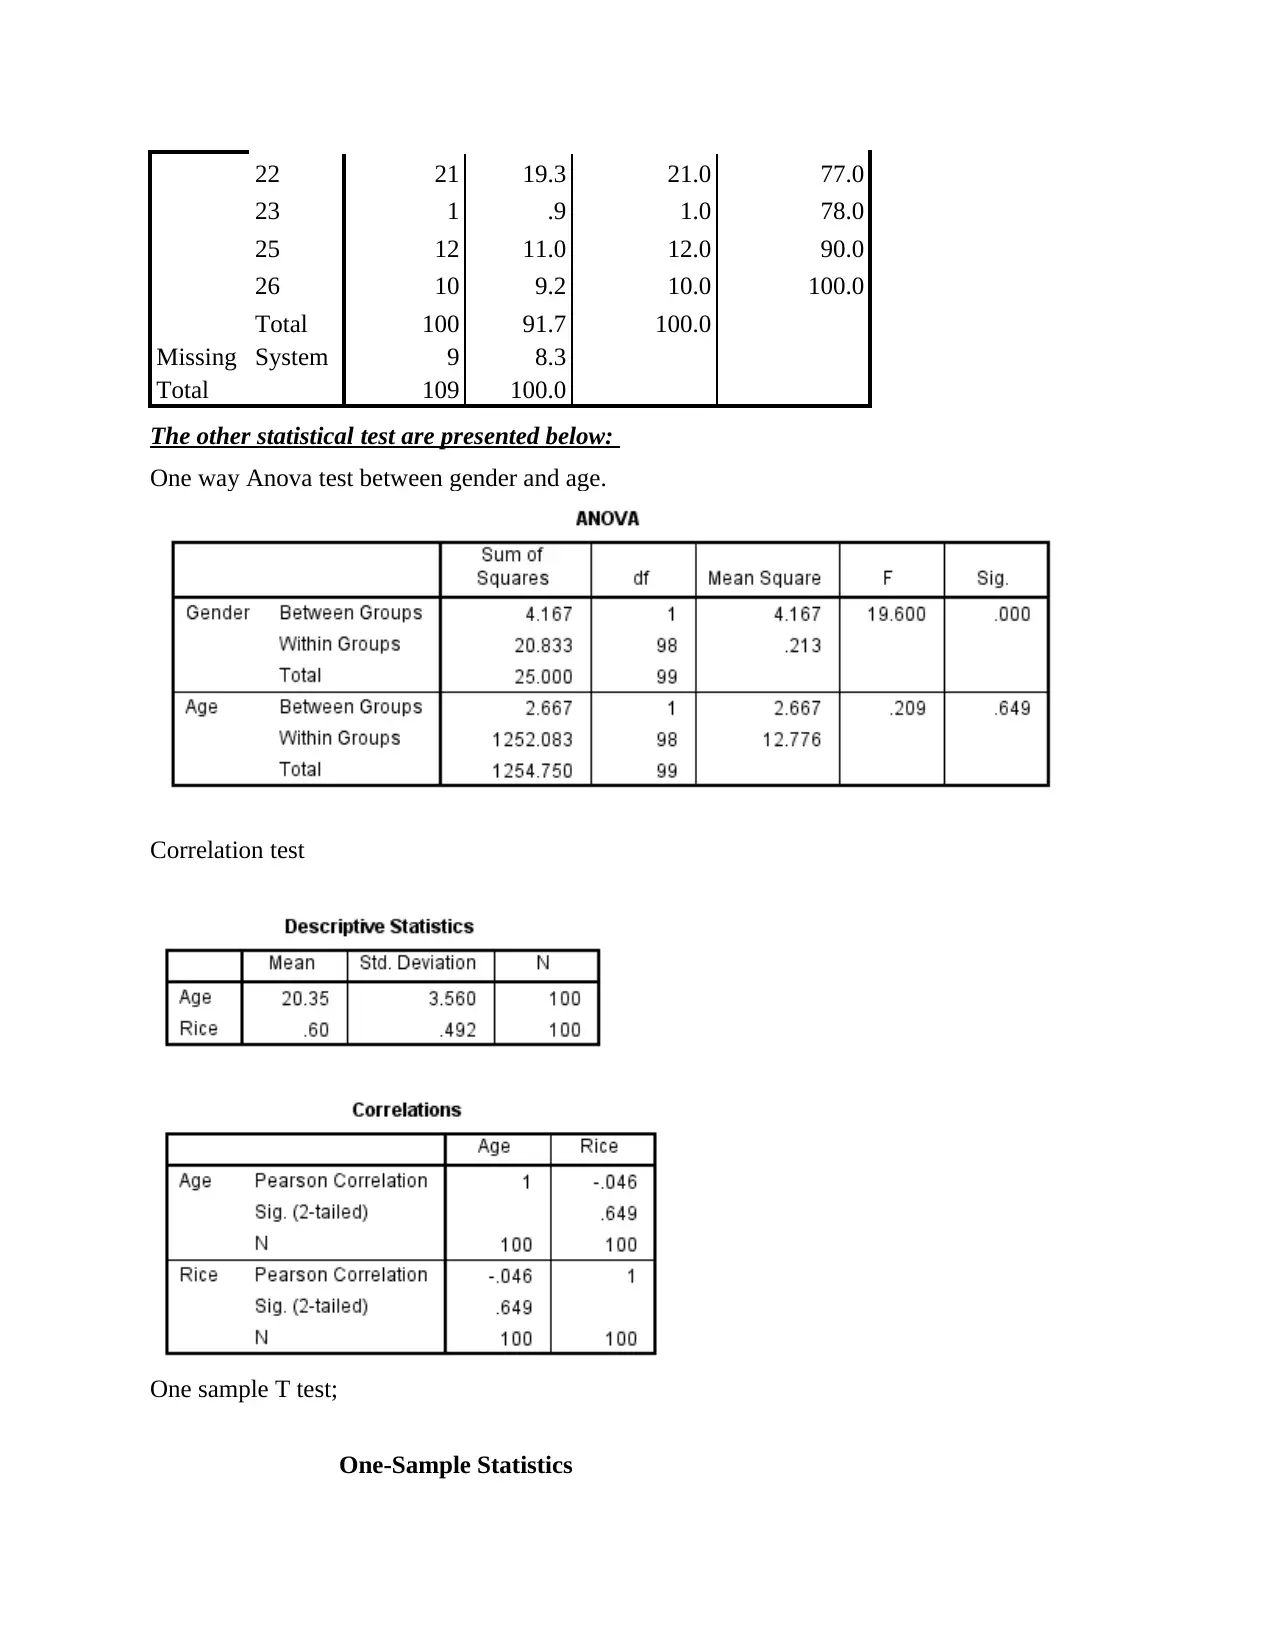
The other statistical test are presented below:
One way Anova test between gender and age.
Correlation test
One sample T test;
One-Sample Statistics
23 1 .9 1.0 78.0
25 12 11.0 12.0 90.0
26 10 9.2 10.0 100.0
Total 100 91.7 100.0
Missing System 9 8.3
Total 109 100.0
The other statistical test are presented below:
One way Anova test between gender and age.
Correlation test
One sample T test;
One-Sample Statistics
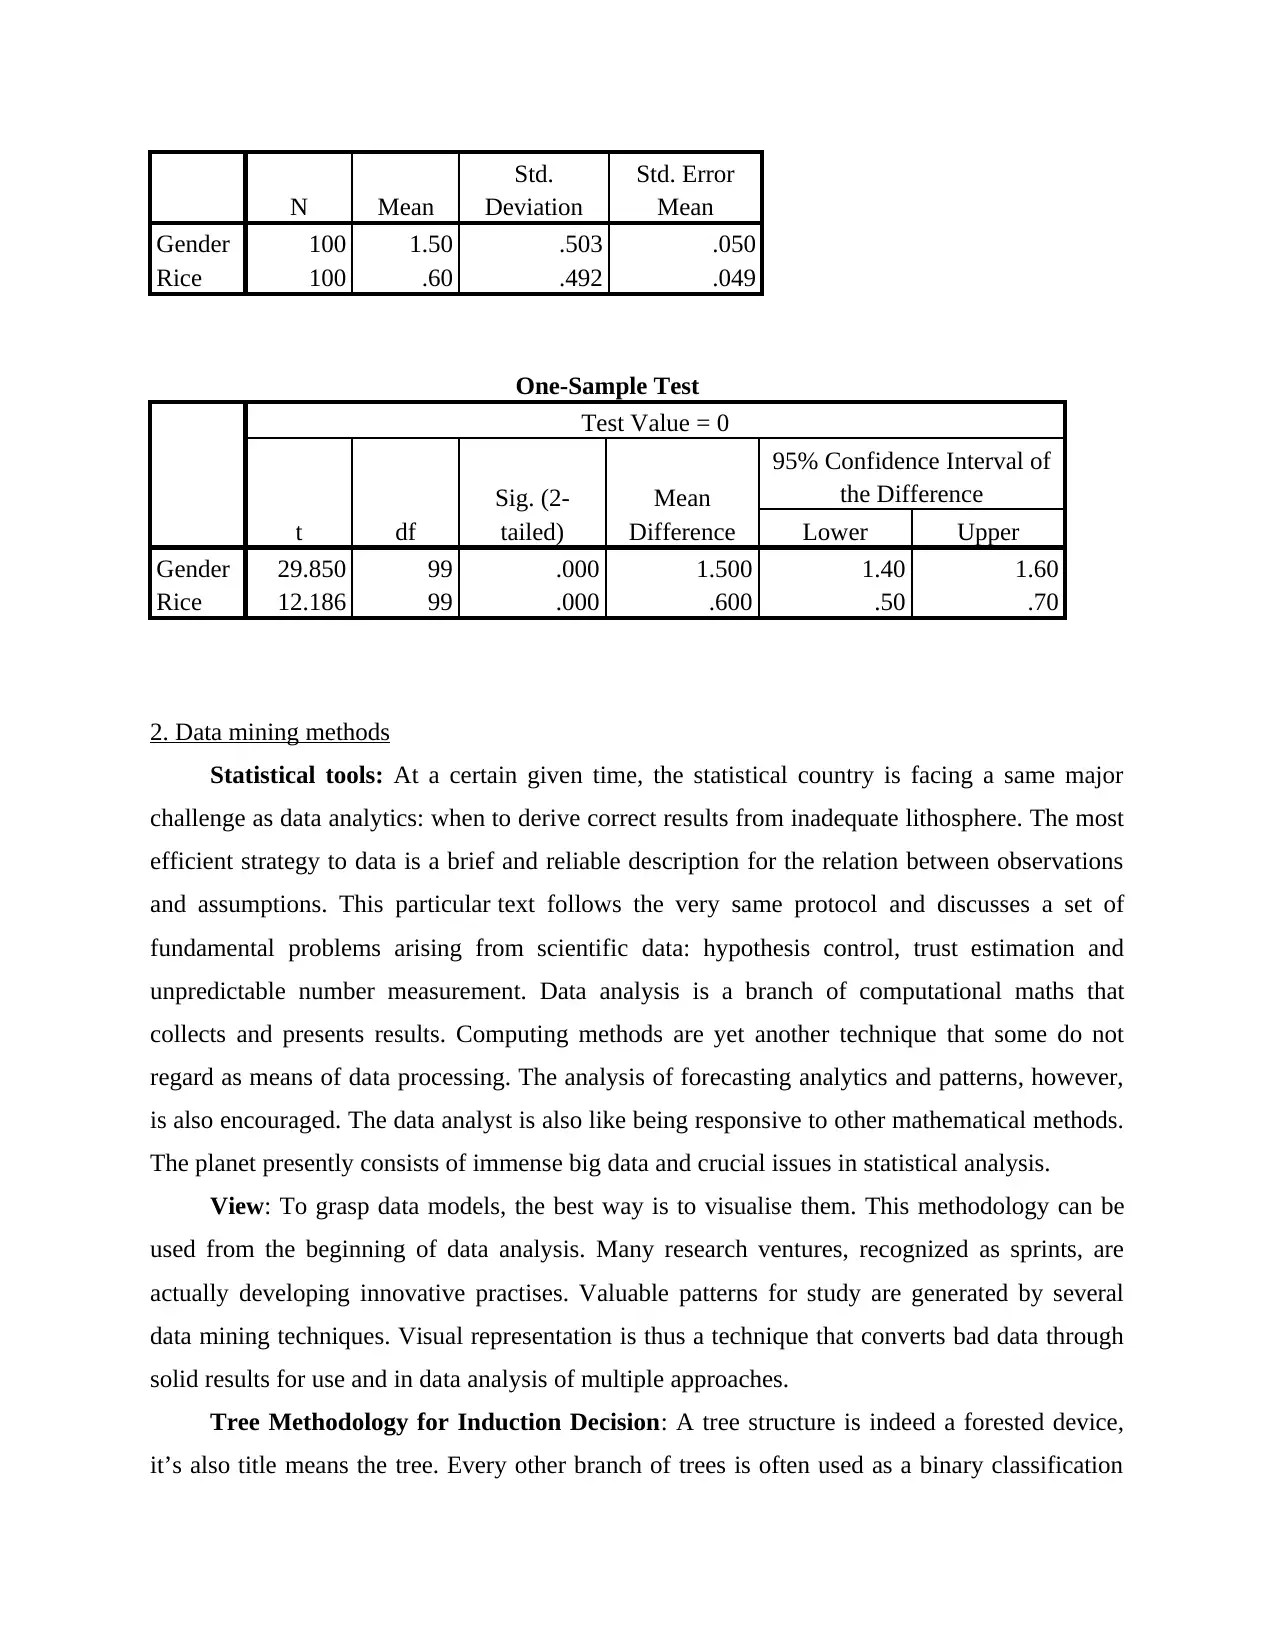
N Mean
Std.
Deviation
Std. Error
Mean
Gender 100 1.50 .503 .050
Rice 100 .60 .492 .049
One-Sample Test
Test Value = 0
t df
Sig. (2-
tailed)
Mean
Difference
95% Confidence Interval of
the Difference
Lower Upper
Gender 29.850 99 .000 1.500 1.40 1.60
Rice 12.186 99 .000 .600 .50 .70
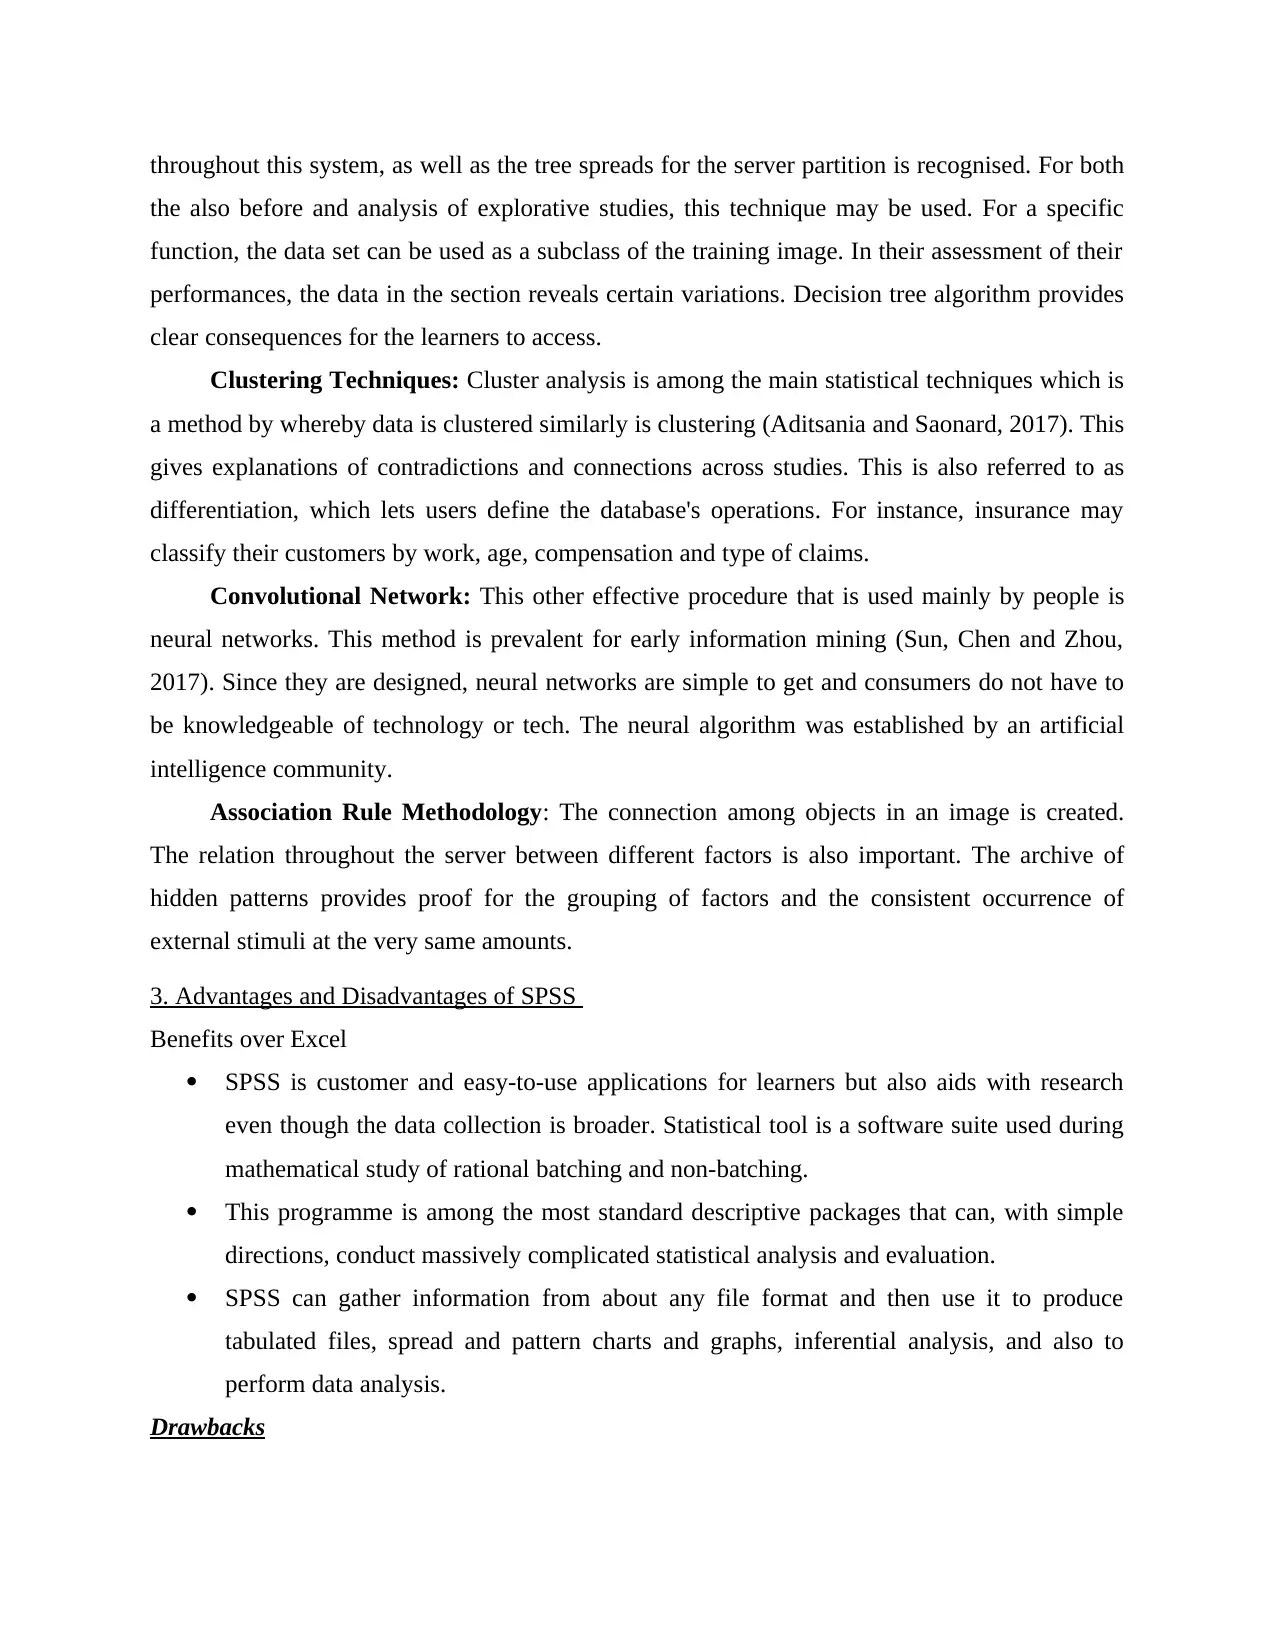
2. Data mining methods
Statistical tools: At a certain given time, the statistical country is facing a same major
challenge as data analytics: when to derive correct results from inadequate lithosphere. The most
efficient strategy to data is a brief and reliable description for the relation between observations
and assumptions. This particular text follows the very same protocol and discusses a set of
fundamental problems arising from scientific data: hypothesis control, trust estimation and
unpredictable number measurement. Data analysis is a branch of computational maths that
collects and presents results. Computing methods are yet another technique that some do not
regard as means of data processing. The analysis of forecasting analytics and patterns, however,
is also encouraged. The data analyst is also like being responsive to other mathematical methods.
The planet presently consists of immense big data and crucial issues in statistical analysis.
View: To grasp data models, the best way is to visualise them. This methodology can be
used from the beginning of data analysis. Many research ventures, recognized as sprints, are
actually developing innovative practises. Valuable patterns for study are generated by several
data mining techniques. Visual representation is thus a technique that converts bad data through
solid results for use and in data analysis of multiple approaches.
Tree Methodology for Induction Decision: A tree structure is indeed a forested device,
it’s also title means the tree. Every other branch of trees is often used as a binary classification
Std.
Deviation
Std. Error
Mean
Gender 100 1.50 .503 .050
Rice 100 .60 .492 .049
One-Sample Test
Test Value = 0
t df
Sig. (2-
tailed)
Mean
Difference
95% Confidence Interval of
the Difference
Lower Upper
Gender 29.850 99 .000 1.500 1.40 1.60
Rice 12.186 99 .000 .600 .50 .70
2. Data mining methods
Statistical tools: At a certain given time, the statistical country is facing a same major
challenge as data analytics: when to derive correct results from inadequate lithosphere. The most
efficient strategy to data is a brief and reliable description for the relation between observations
and assumptions. This particular text follows the very same protocol and discusses a set of
fundamental problems arising from scientific data: hypothesis control, trust estimation and
unpredictable number measurement. Data analysis is a branch of computational maths that
collects and presents results. Computing methods are yet another technique that some do not
regard as means of data processing. The analysis of forecasting analytics and patterns, however,
is also encouraged. The data analyst is also like being responsive to other mathematical methods.
The planet presently consists of immense big data and crucial issues in statistical analysis.
View: To grasp data models, the best way is to visualise them. This methodology can be
used from the beginning of data analysis. Many research ventures, recognized as sprints, are
actually developing innovative practises. Valuable patterns for study are generated by several
data mining techniques. Visual representation is thus a technique that converts bad data through
solid results for use and in data analysis of multiple approaches.
Tree Methodology for Induction Decision: A tree structure is indeed a forested device,
it’s also title means the tree. Every other branch of trees is often used as a binary classification
Secure Best Marks with AI Grader
Need help grading? Try our AI Grader for instant feedback on your assignments.
throughout this system, as well as the tree spreads for the server partition is recognised. For both
the also before and analysis of explorative studies, this technique may be used. For a specific
function, the data set can be used as a subclass of the training image. In their assessment of their
performances, the data in the section reveals certain variations. Decision tree algorithm provides
clear consequences for the learners to access.
Clustering Techniques: Cluster analysis is among the main statistical techniques which is
a method by whereby data is clustered similarly is clustering (Aditsania and Saonard, 2017). This
gives explanations of contradictions and connections across studies. This is also referred to as
differentiation, which lets users define the database's operations. For instance, insurance may
classify their customers by work, age, compensation and type of claims.
Convolutional Network: This other effective procedure that is used mainly by people is
neural networks. This method is prevalent for early information mining (Sun, Chen and Zhou,
2017). Since they are designed, neural networks are simple to get and consumers do not have to
be knowledgeable of technology or tech. The neural algorithm was established by an artificial
intelligence community.
Association Rule Methodology: The connection among objects in an image is created.
The relation throughout the server between different factors is also important. The archive of
hidden patterns provides proof for the grouping of factors and the consistent occurrence of
external stimuli at the very same amounts.
3. Advantages and Disadvantages of SPSS
Benefits over Excel
SPSS is customer and easy-to-use applications for learners but also aids with research
even though the data collection is broader. Statistical tool is a software suite used during
mathematical study of rational batching and non-batching.
This programme is among the most standard descriptive packages that can, with simple
directions, conduct massively complicated statistical analysis and evaluation.
SPSS can gather information from about any file format and then use it to produce
tabulated files, spread and pattern charts and graphs, inferential analysis, and also to
perform data analysis.
Drawbacks
Modular programming, as in R Numbers, could be more restrictive for all those needing
specialised procedures not really on SPSS, but still not as stable and useful as R and other
programmes may be required.
Social Sciences Statistical Kit which can then be used for statistical operations only. It
would entail additional sales in other packages.
Standard graphics are very far from the quality of publications. It's usually easier using
other graphics applications.
For certain methods, knowledge about effective dose and sample sizes is lacking.

REFERENCES
Books and Journals
Changhong, S. H. A. N., Intel IP Corp, 2018. Downlink data handling for idle mode ue when the
sgw is split into control plane node and user plane node. U.S. Patent Application
15/767,562.
Shaer, L., Kanj, R. and Joshi, R., 2019, May. Data Imbalance Handling Approaches for Accurate
Statistical Modeling and Yield Analysis of Memory Designs. In 2019 IEEE International
Symposium on Circuits and Systems (ISCAS) (pp. 1-5). IEEE.
Chiabrando, F., Sammartano, G. and Spanò, A., 2016. Historical buildings models and their
handling via 3D survey: from points clouds to user-oriented HBIM. International
Archives of the Photogrammetry, Remote Sensing & Spatial Information Sciences, 41.
Van Der Aalst, W., 2016. Data science in action. In Process mining (pp. 3-23). Springer, Berlin,
Heidelberg.
Gabrio, A., Mason, A. J. and Baio, G., 2017. Handling missing data in within-trial cost-
effectiveness analysis: a review with future recommendations. PharmacoEconomics-
open, 1(2), pp.79-97.
Aditsania, A. and Saonard, A. L., 2017, October. Handling imbalanced data in churn prediction
using ADASYN and backpropagation algorithm. In 2017 3rd International Conference
on Science in Information Technology (ICSITech) (pp. 533-536). IEEE.
Sun, B., Chen, X. and Zhou, Q., 2017. Analyzing the uncertainties of ground validation for
remote sensing land cover mapping in the era of big geographic data. In Spatial Data
Handling in Big Data Era (pp. 31-38). Springer, Singapore.
Somasundaram, A. and Reddy, U. S., 2017, June. Modelling a stable classifier for handling large
scale data with noise and imbalance. In 2017 International Conference on Computational
Intelligence in Data Science (ICCIDS) (pp. 1-6). IEEE.
Park, M. and Snyder, S. A., 2018. Sample handling and data processing for fluorescent
excitation-emission matrix (EEM) of dissolved organic matter
(DOM). Chemosphere, 193, pp.530-537.
1 out of 13
Related Documents


Your All-in-One AI-Powered Toolkit for Academic Success.
+13062052269
info@desklib.com
Available 24*7 on WhatsApp / Email
![[object Object]](/_next/static/media/star-bottom.7253800d.svg)
Unlock your academic potential
© 2024 | Zucol Services PVT LTD | All rights reserved.