Data Analysis and Business Intelligence: Excel, Data Mining, and Weka
VerifiedAdded on 2023/01/11
|18
|3112
|28
Report
AI Summary
This report provides a comprehensive analysis of data handling and business intelligence, focusing on the practical application of Excel and data mining techniques. The report begins with an introduction to data mining, its importance, and its role in analyzing large datasets for accurate predictions and improved business outcomes. Part 1 of the report describes the sales and profit trends over several years, evaluating the use of Excel for data pre-processing and visualization, including the use of Pivot tables, charts, and various Excel functions like IF and Lookup. The report also utilizes Weka software for data analysis. Part 2 discusses various data mining methods, such as association, clustering, pattern tracking, decision trees, neural networks, prediction, and anomaly analysis, explaining their application in a business context. The report also compares the advantages and disadvantages of Weka over Excel for data analysis. The conclusion summarizes the key findings, emphasizing the significance of data mining and effective data analysis tools in making informed business decisions and improving overall performance. The report is a valuable resource for students learning about data analysis and business intelligence.

Data handling and business
Intelligence
1
Intelligence
1
Paraphrase This Document
Need a fresh take? Get an instant paraphrase of this document with our AI Paraphraser
Contents
INTRODUCTION...........................................................................................................................3
PART 1............................................................................................................................................3
Describe the sales and profit over years and evaluate the use of Excel for pre-processing
information..................................................................................................................................3
Discuss about the concept that how practically used Excel function such as Pivot, if, Lookup,
Pivot table and charts...................................................................................................................6
PART 2............................................................................................................................................9
Discuss about the different type of data mining method and used for business purpose............9
CONCLUSION..............................................................................................................................17
REFERENCES..............................................................................................................................19
2
INTRODUCTION
Data mining is a method or technique for analysing large amount of data, pattern and also
developed correlation between them. It is useful for predicating the accurate result or outcome. It
is consider as process that will support for estimating the revenue of information, cutting cost/
price. In order to improve the customer relationship. Data mining is conceptual based technique
that always support for analysing and exploring the data in order to generate accurate result or
outcome. The report will describe about the overall sales report whereas marketing assistant
track or record full details. Furthermore, the documentation will describe about the sales
information and implement Weka software to find out specific outcome. This technique will
consider an efficient that build a machine learning model and handle the processes in proper
manner.
PART 1
Describe the sales and profit over years and evaluate the use of Excel for pre-processing
information.
Data pre-processing: It is important phase in the data mining process where they can
process various data or information through machine learning. In order to gather large amount of
data or information. It can be analysing data which carefully screened for problem or issue. It can
be produced misleading result or outcome.
Weka Software: It is based on the data mining tool that provide facility to visualise data
which contain large collection of machine learning algorithms. It is an open source software that
issue under General public License (Drushku and et al 2019). In another way, it can be said that
conceptual process of unfolding pattern in large data set which will support for making right
business decision. In order to design an effective strategies for organization growth and
development (Mitrovic, 2020). Weka primarily expects the data file to be collected in the
attribute relation format so that it can easily convert into useful information. Weka platform
provide the different data mining technique such as clustering, filtering and classification. Main
feature of Weka is data pre-processing, prediction and clustering.
MS Excel: it is a type of spreadsheet program that allows one to enter numerical value into
columns, rows. Sometimes, it can be used numerical entries such as graphs, calculations,
estimation total revenue and statistical analysis (Isazad Mashinchi Ojo and Sullivan, 2019). The
spreadsheet is the most efficient that useful for student interactive activities, interactive lectures
3
⊘ This is a preview!⊘
Do you want full access?
Subscribe today to unlock all pages.
Trusted by 1+ million students worldwide
and instructor use for developing the materials. Excel is consider as calculator which help for
explore the mathematical equation and tell about the real world works for specific input
condition or range of possible values.
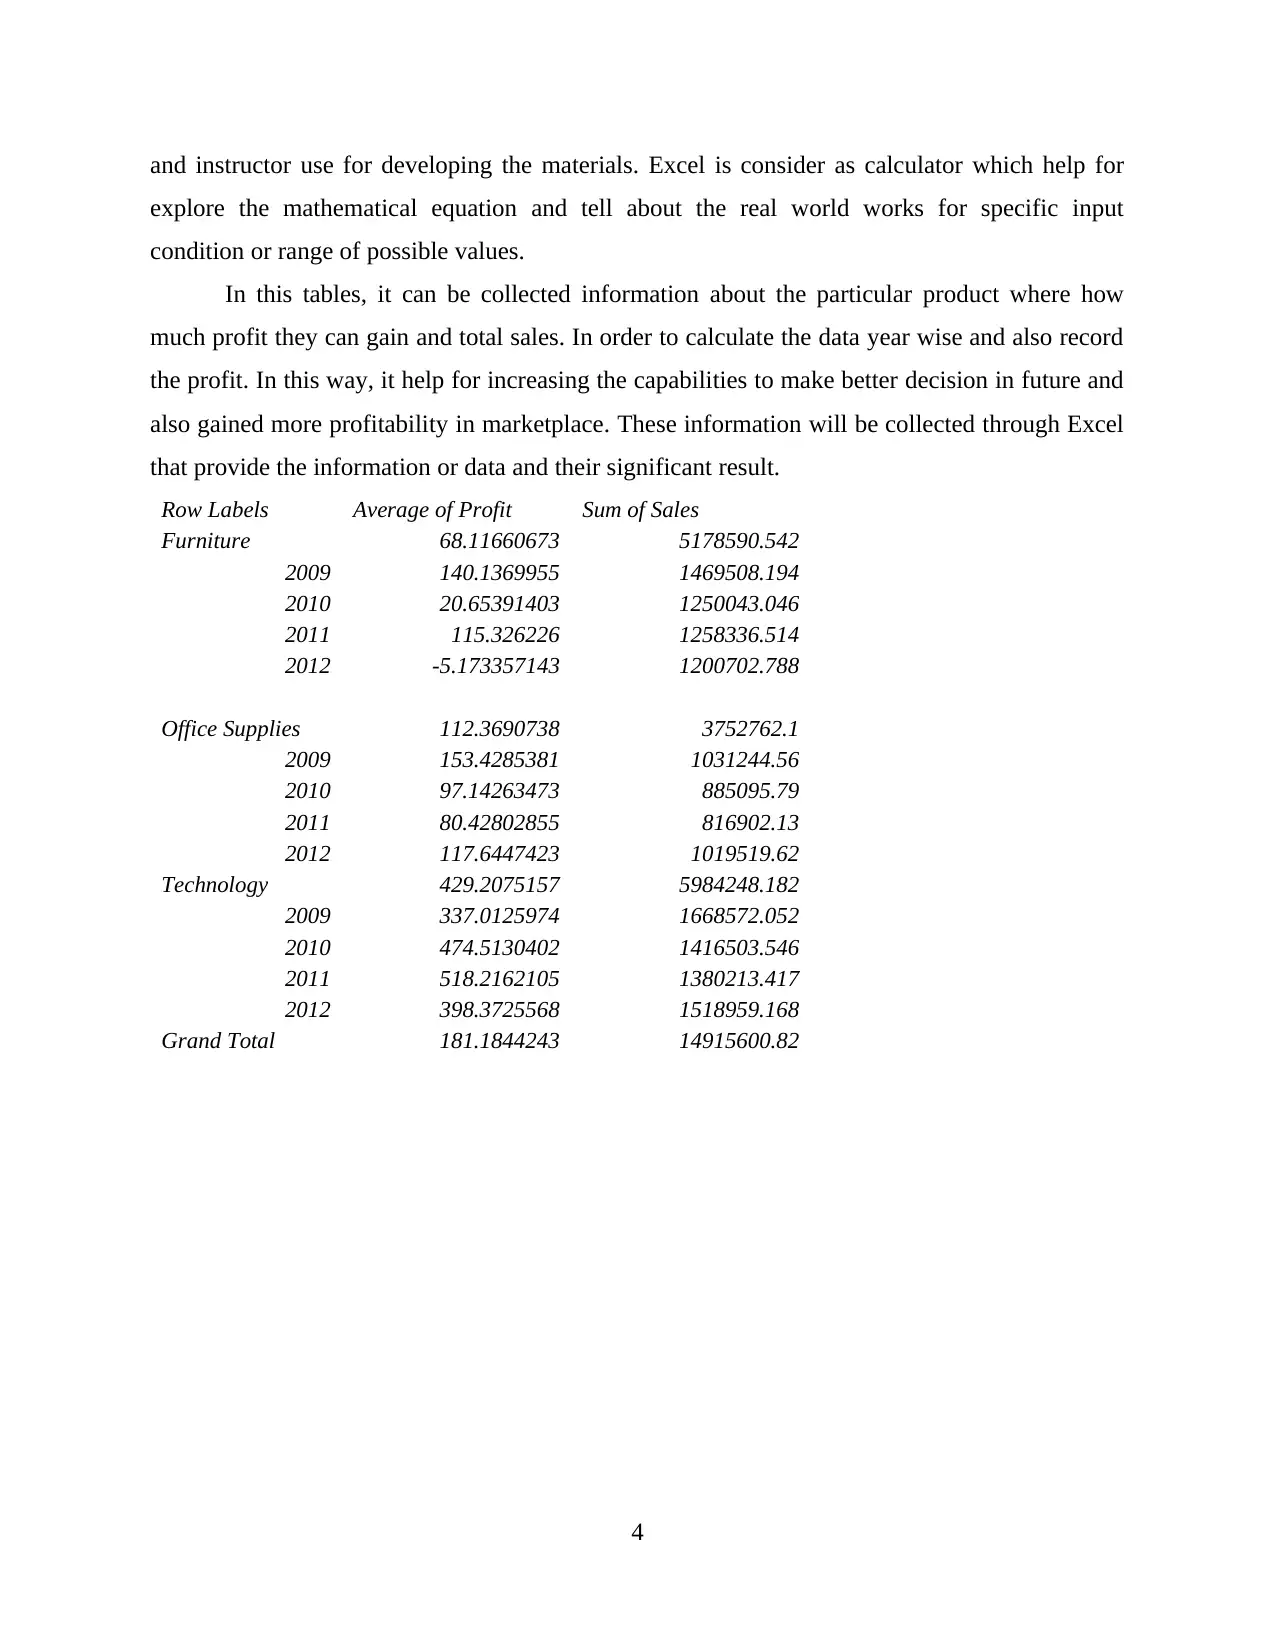
In this tables, it can be collected information about the particular product where how
much profit they can gain and total sales. In order to calculate the data year wise and also record
the profit. In this way, it help for increasing the capabilities to make better decision in future and
also gained more profitability in marketplace. These information will be collected through Excel
that provide the information or data and their significant result.
Row Labels Average of Profit Sum of Sales
Furniture 68.11660673 5178590.542
2009 140.1369955 1469508.194
2010 20.65391403 1250043.046
2011 115.326226 1258336.514
2012 -5.173357143 1200702.788
Office Supplies 112.3690738 3752762.1
2009 153.4285381 1031244.56
2010 97.14263473 885095.79
2011 80.42802855 816902.13
2012 117.6447423 1019519.62
Technology 429.2075157 5984248.182
2009 337.0125974 1668572.052
2010 474.5130402 1416503.546
2011 518.2162105 1380213.417
2012 398.3725568 1518959.168
Grand Total 181.1844243 14915600.82
4
explore the mathematical equation and tell about the real world works for specific input
condition or range of possible values.
In this tables, it can be collected information about the particular product where how
much profit they can gain and total sales. In order to calculate the data year wise and also record
the profit. In this way, it help for increasing the capabilities to make better decision in future and
also gained more profitability in marketplace. These information will be collected through Excel
that provide the information or data and their significant result.
Row Labels Average of Profit Sum of Sales
Furniture 68.11660673 5178590.542
2009 140.1369955 1469508.194
2010 20.65391403 1250043.046
2011 115.326226 1258336.514
2012 -5.173357143 1200702.788
Office Supplies 112.3690738 3752762.1
2009 153.4285381 1031244.56
2010 97.14263473 885095.79
2011 80.42802855 816902.13
2012 117.6447423 1019519.62
Technology 429.2075157 5984248.182
2009 337.0125974 1668572.052
2010 474.5130402 1416503.546
2011 518.2162105 1380213.417
2012 398.3725568 1518959.168
Grand Total 181.1844243 14915600.82
4
Paraphrase This Document
Need a fresh take? Get an instant paraphrase of this document with our AI Paraphraser
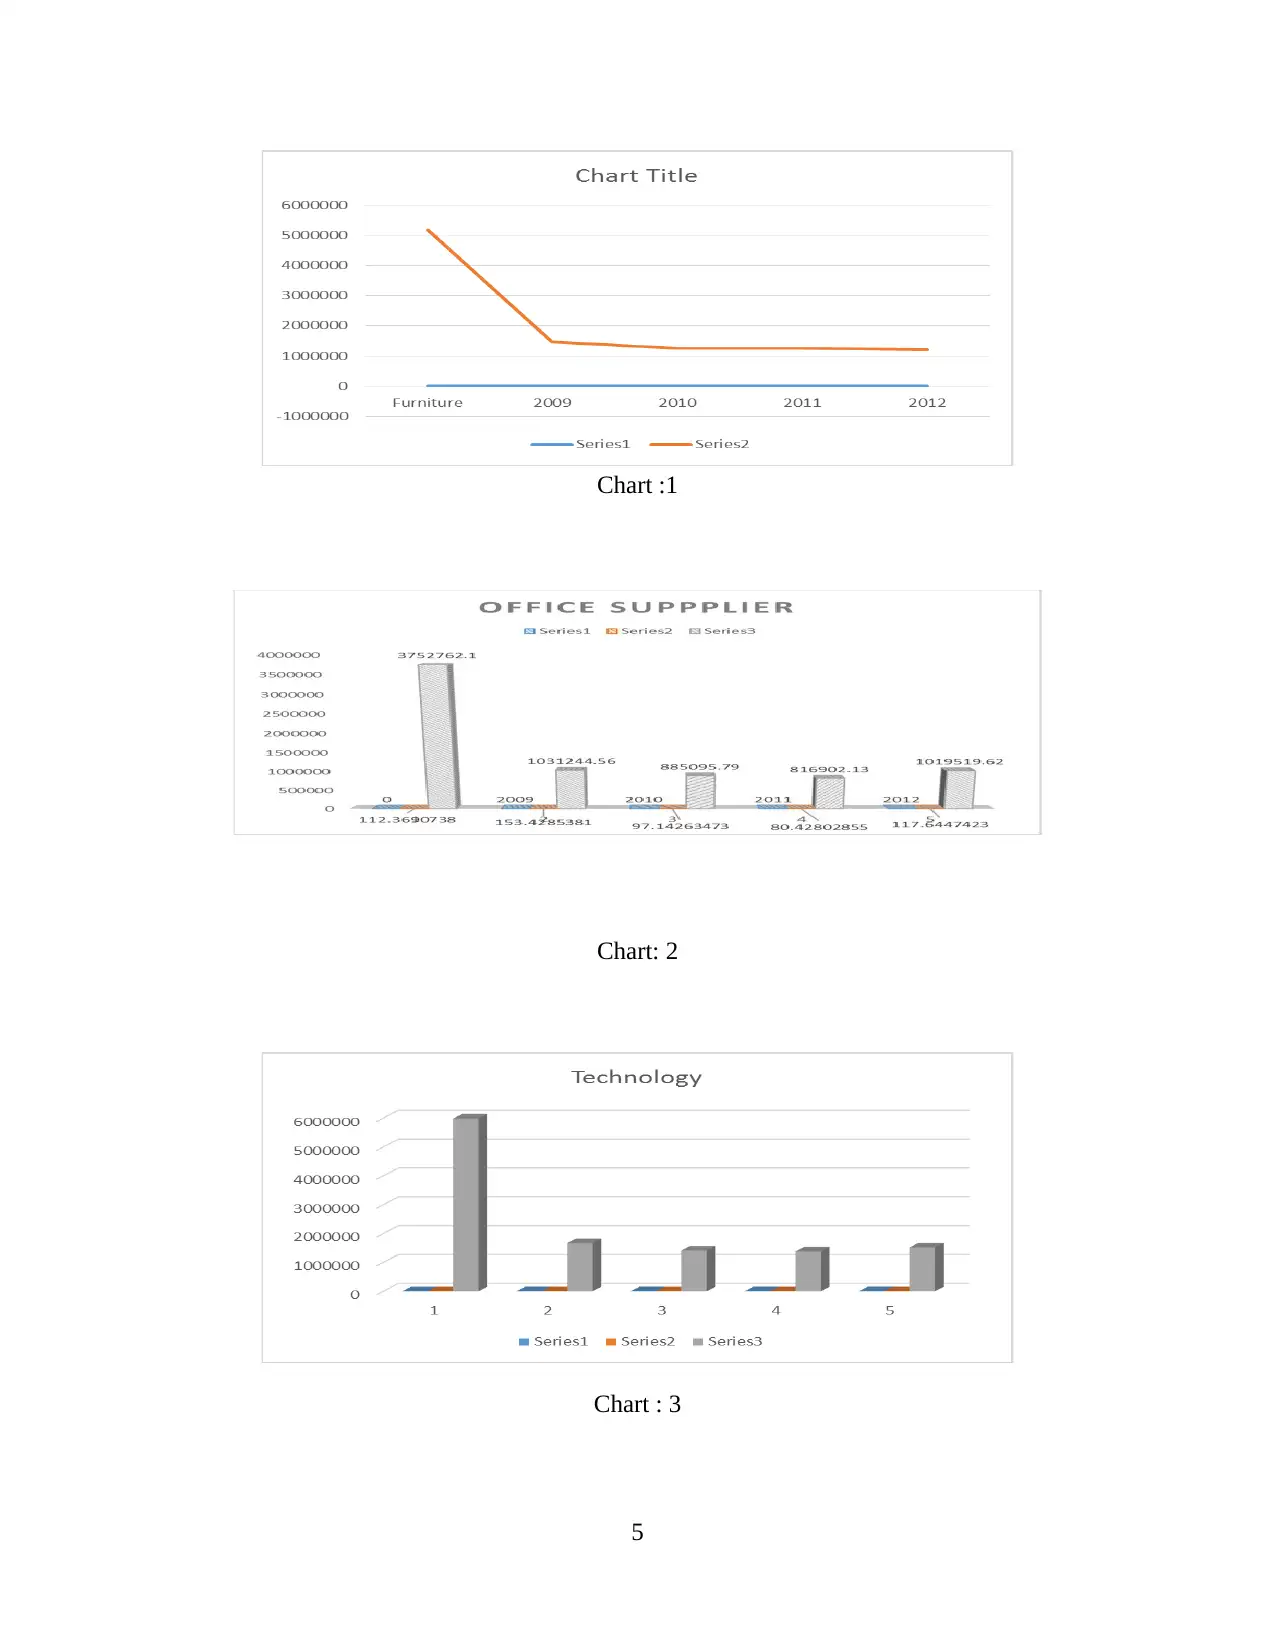
Chart :1
Chart: 2
Chart : 3
5
Chart: 2
Chart : 3
5
Discuss about the concept that how practically used Excel function such as Pivot, if, Lookup,
Pivot table and charts.
LookUP function
The Lookup function can be performed an approximately match with the lookup in one row and
column. In order to generate or return a particular value from another column or rows. This
function is mainly representing as a default behaviour which make it is useful for resolving
certain problem through excel (Jain, Shah and Churi, 2019). It has two or more forms, array and
vector which always support for describing the solution. Afterwards, it can easily identify value
from large volume. Sometimes, it assume as value in lookup vector which automatically storing
value in ascending order. Furthermore, it can perform the various match.
If: This function is generally return one value if it can applied the condition and another value if
condition is false (Mitrovic, 2020). It is to be consider as most efficient technique that always
support for categorised in logical manner. Generally, it is mainly used for work sheet function
with the help of Excel.
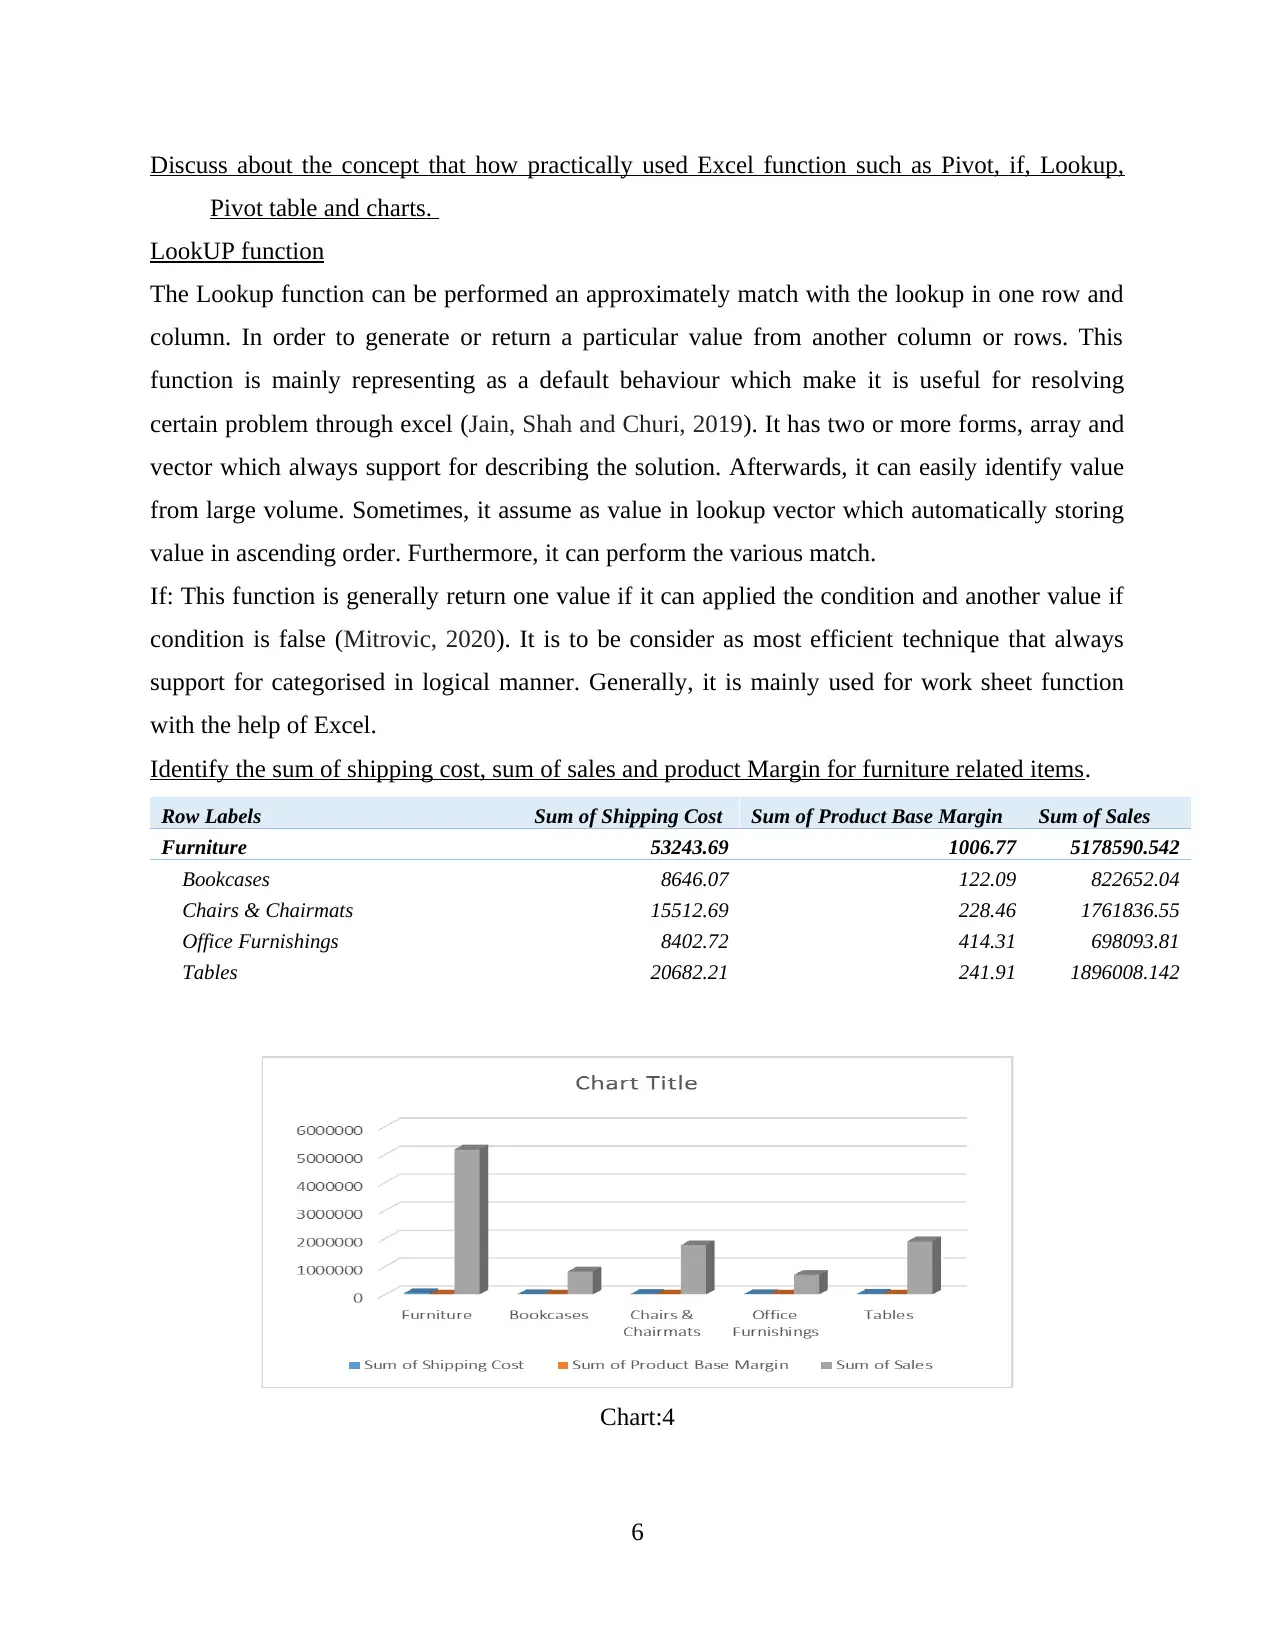
Identify the sum of shipping cost, sum of sales and product Margin for furniture related items.
Row Labels Sum of Shipping Cost Sum of Product Base Margin Sum of Sales
Furniture 53243.69 1006.77 5178590.542
Bookcases 8646.07 122.09 822652.04
Chairs & Chairmats 15512.69 228.46 1761836.55
Office Furnishings 8402.72 414.31 698093.81
Tables 20682.21 241.91 1896008.142
Chart:4
6
Pivot table and charts.
LookUP function
The Lookup function can be performed an approximately match with the lookup in one row and
column. In order to generate or return a particular value from another column or rows. This
function is mainly representing as a default behaviour which make it is useful for resolving
certain problem through excel (Jain, Shah and Churi, 2019). It has two or more forms, array and
vector which always support for describing the solution. Afterwards, it can easily identify value
from large volume. Sometimes, it assume as value in lookup vector which automatically storing
value in ascending order. Furthermore, it can perform the various match.
If: This function is generally return one value if it can applied the condition and another value if
condition is false (Mitrovic, 2020). It is to be consider as most efficient technique that always
support for categorised in logical manner. Generally, it is mainly used for work sheet function
with the help of Excel.
Identify the sum of shipping cost, sum of sales and product Margin for furniture related items.
Row Labels Sum of Shipping Cost Sum of Product Base Margin Sum of Sales
Furniture 53243.69 1006.77 5178590.542
Bookcases 8646.07 122.09 822652.04
Chairs & Chairmats 15512.69 228.46 1761836.55
Office Furnishings 8402.72 414.31 698093.81
Tables 20682.21 241.91 1896008.142
Chart:4
6
⊘ This is a preview!⊘
Do you want full access?
Subscribe today to unlock all pages.
Trusted by 1+ million students worldwide
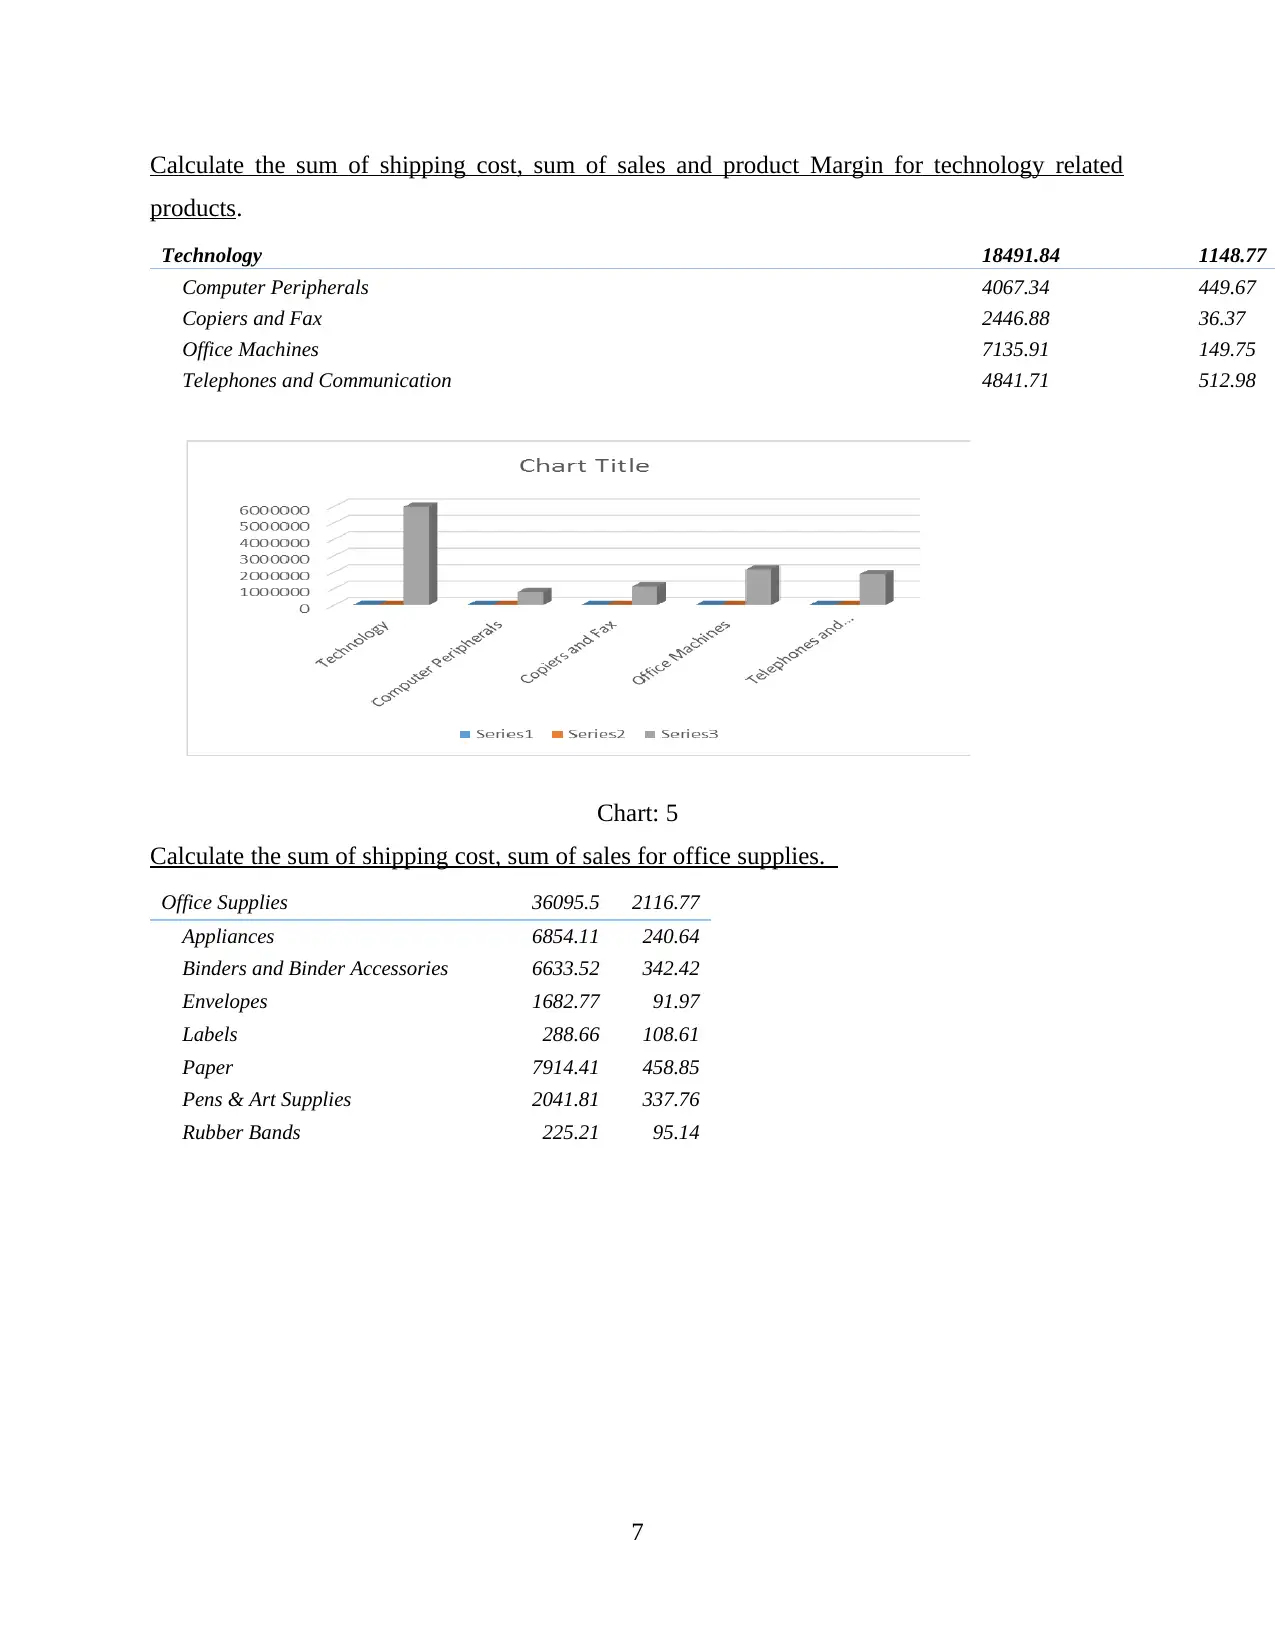
Calculate the sum of shipping cost, sum of sales and product Margin for technology related
products.
Technology 18491.84 1148.77
Computer Peripherals 4067.34 449.67
Copiers and Fax 2446.88 36.37
Office Machines 7135.91 149.75
Telephones and Communication 4841.71 512.98
Chart: 5
Calculate the sum of shipping cost, sum of sales for office supplies.
Office Supplies 36095.5 2116.77
Appliances 6854.11 240.64
Binders and Binder Accessories 6633.52 342.42
Envelopes 1682.77 91.97
Labels 288.66 108.61
Paper 7914.41 458.85
Pens & Art Supplies 2041.81 337.76
Rubber Bands 225.21 95.14
7
Paraphrase This Document
Need a fresh take? Get an instant paraphrase of this document with our AI Paraphraser
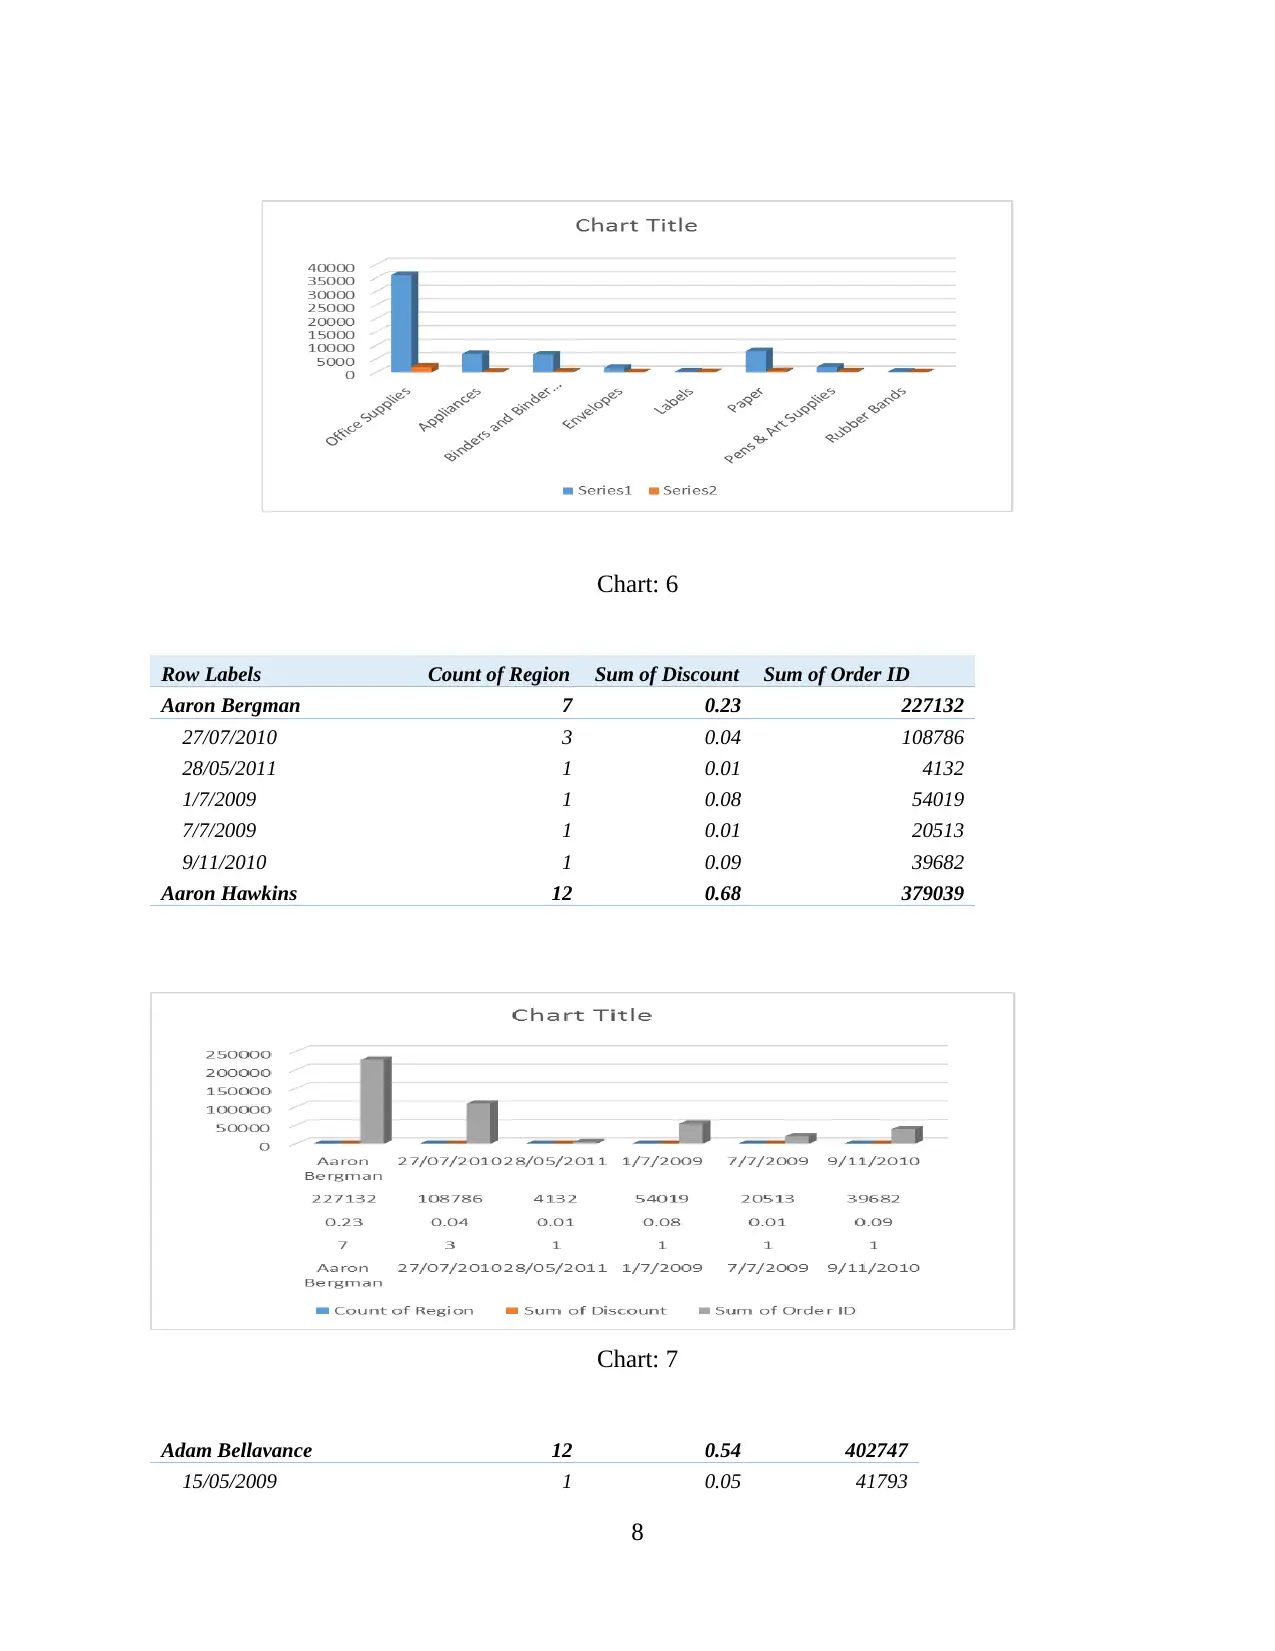
Chart: 6
Row Labels Count of Region Sum of Discount Sum of Order ID
Aaron Bergman 7 0.23 227132
27/07/2010 3 0.04 108786
28/05/2011 1 0.01 4132
1/7/2009 1 0.08 54019
7/7/2009 1 0.01 20513
9/11/2010 1 0.09 39682
Aaron Hawkins 12 0.68 379039
Chart: 7
Adam Bellavance 12 0.54 402747
15/05/2009 1 0.05 41793
8
Row Labels Count of Region Sum of Discount Sum of Order ID
Aaron Bergman 7 0.23 227132
27/07/2010 3 0.04 108786
28/05/2011 1 0.01 4132
1/7/2009 1 0.08 54019
7/7/2009 1 0.01 20513
9/11/2010 1 0.09 39682
Aaron Hawkins 12 0.68 379039
Chart: 7
Adam Bellavance 12 0.54 402747
15/05/2009 1 0.05 41793
8
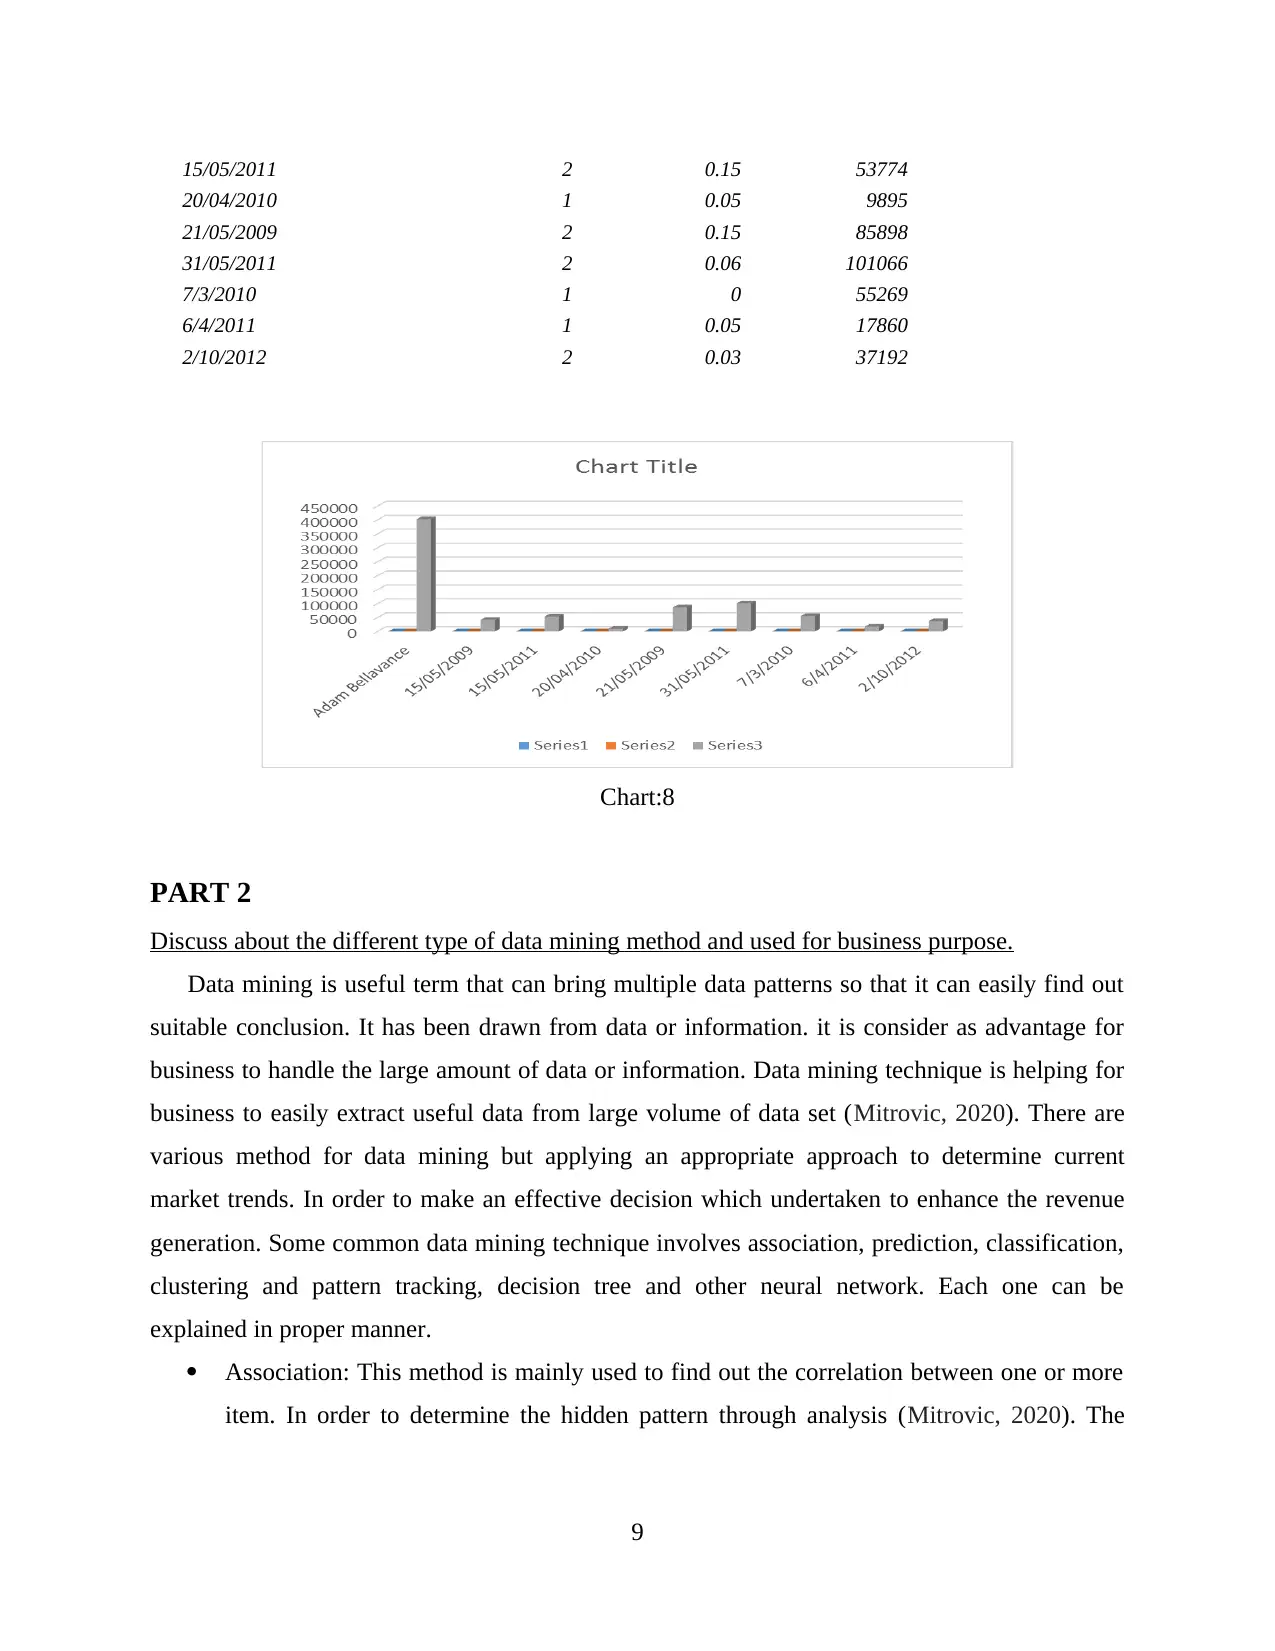
15/05/2011 2 0.15 53774
20/04/2010 1 0.05 9895
21/05/2009 2 0.15 85898
31/05/2011 2 0.06 101066
7/3/2010 1 0 55269
6/4/2011 1 0.05 17860
2/10/2012 2 0.03 37192
Chart:8
PART 2
Discuss about the different type of data mining method and used for business purpose.
Data mining is useful term that can bring multiple data patterns so that it can easily find out
suitable conclusion. It has been drawn from data or information. it is consider as advantage for
business to handle the large amount of data or information. Data mining technique is helping for
business to easily extract useful data from large volume of data set (Mitrovic, 2020). There are
various method for data mining but applying an appropriate approach to determine current
market trends. In order to make an effective decision which undertaken to enhance the revenue
generation. Some common data mining technique involves association, prediction, classification,
clustering and pattern tracking, decision tree and other neural network. Each one can be
explained in proper manner.
Association: This method is mainly used to find out the correlation between one or more
item. In order to determine the hidden pattern through analysis (Mitrovic, 2020). The
9
⊘ This is a preview!⊘
Do you want full access?
Subscribe today to unlock all pages.
Trusted by 1+ million students worldwide
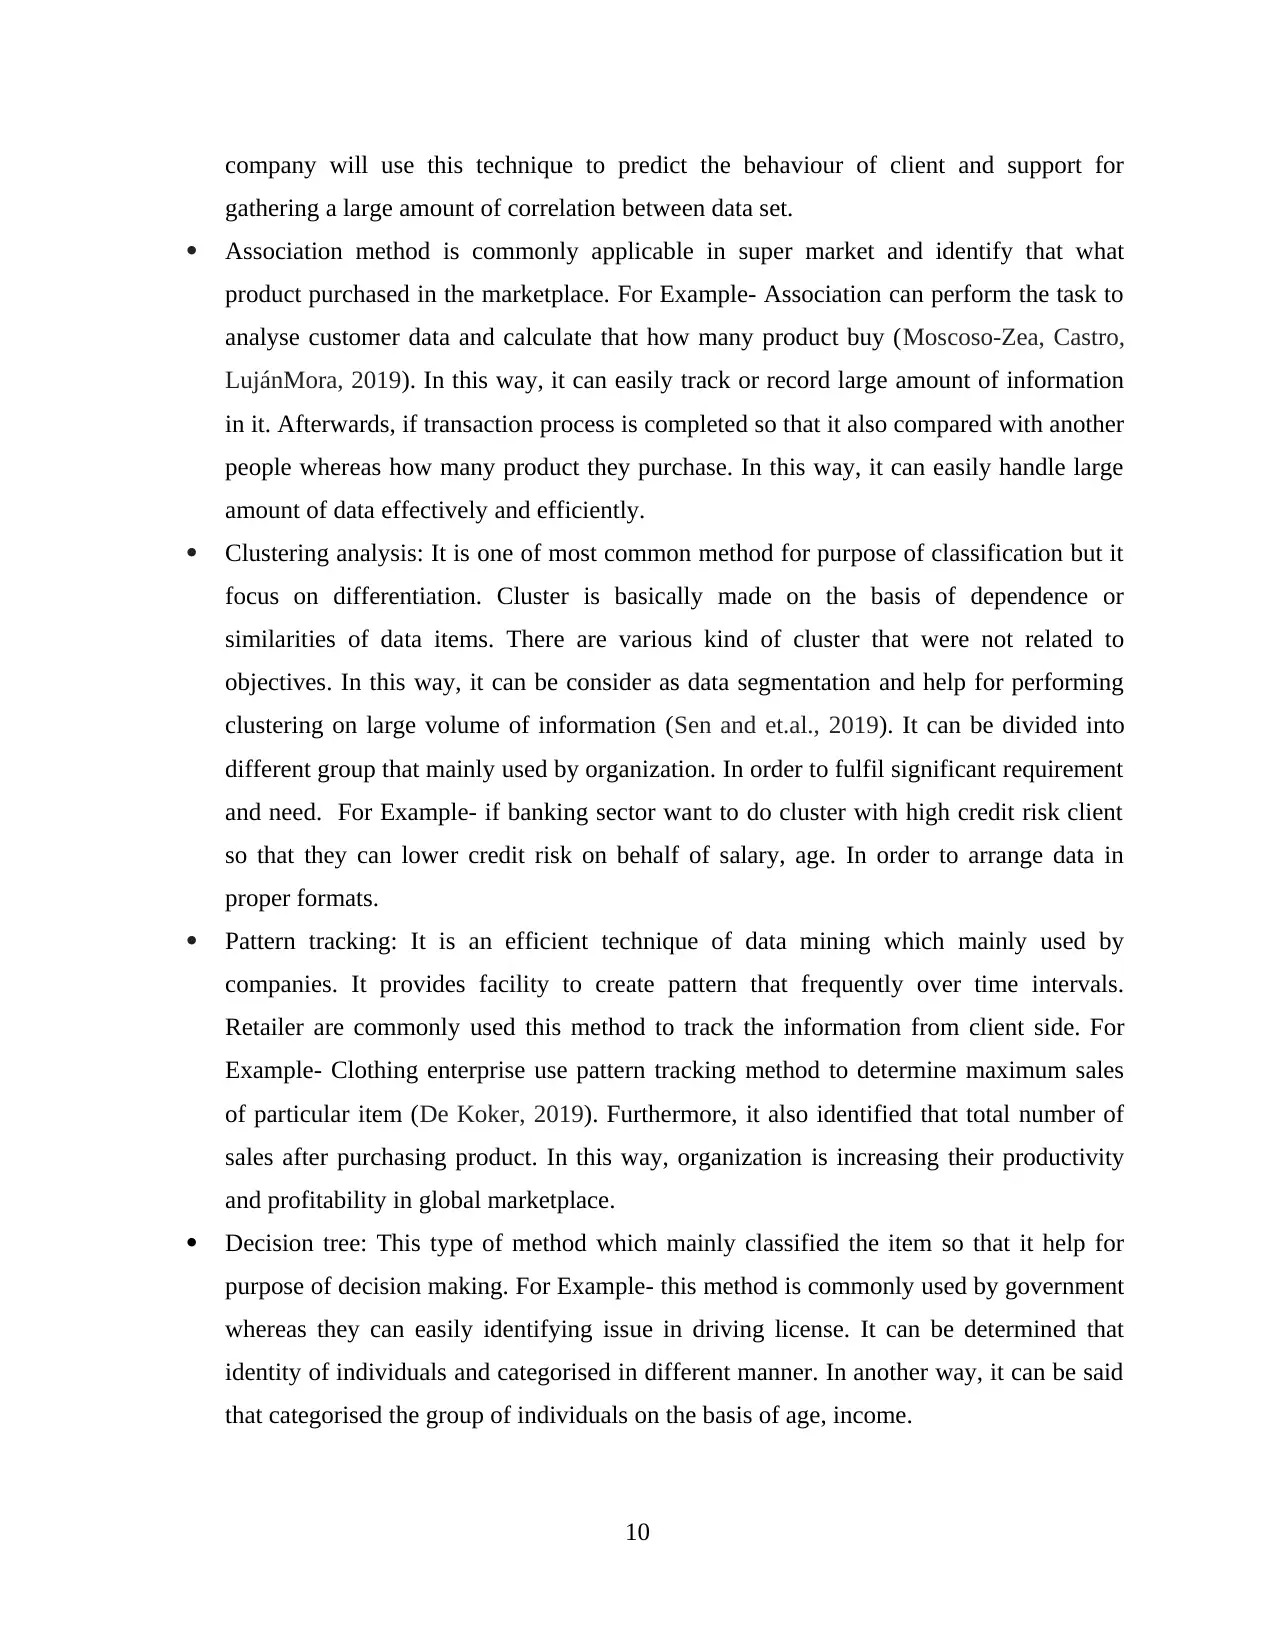
company will use this technique to predict the behaviour of client and support for
gathering a large amount of correlation between data set.
Association method is commonly applicable in super market and identify that what
product purchased in the marketplace. For Example- Association can perform the task to
analyse customer data and calculate that how many product buy (Moscoso-Zea, Castro,
LujánMora, 2019). In this way, it can easily track or record large amount of information
in it. Afterwards, if transaction process is completed so that it also compared with another
people whereas how many product they purchase. In this way, it can easily handle large
amount of data effectively and efficiently.
Clustering analysis: It is one of most common method for purpose of classification but it
focus on differentiation. Cluster is basically made on the basis of dependence or
similarities of data items. There are various kind of cluster that were not related to
objectives. In this way, it can be consider as data segmentation and help for performing
clustering on large volume of information (Sen and et.al., 2019). It can be divided into
different group that mainly used by organization. In order to fulfil significant requirement
and need. For Example- if banking sector want to do cluster with high credit risk client
so that they can lower credit risk on behalf of salary, age. In order to arrange data in
proper formats.
Pattern tracking: It is an efficient technique of data mining which mainly used by
companies. It provides facility to create pattern that frequently over time intervals.
Retailer are commonly used this method to track the information from client side. For
Example- Clothing enterprise use pattern tracking method to determine maximum sales
of particular item (De Koker, 2019). Furthermore, it also identified that total number of
sales after purchasing product. In this way, organization is increasing their productivity
and profitability in global marketplace.
Decision tree: This type of method which mainly classified the item so that it help for
purpose of decision making. For Example- this method is commonly used by government
whereas they can easily identifying issue in driving license. It can be determined that
identity of individuals and categorised in different manner. In another way, it can be said
that categorised the group of individuals on the basis of age, income.
10
Paraphrase This Document
Need a fresh take? Get an instant paraphrase of this document with our AI Paraphraser
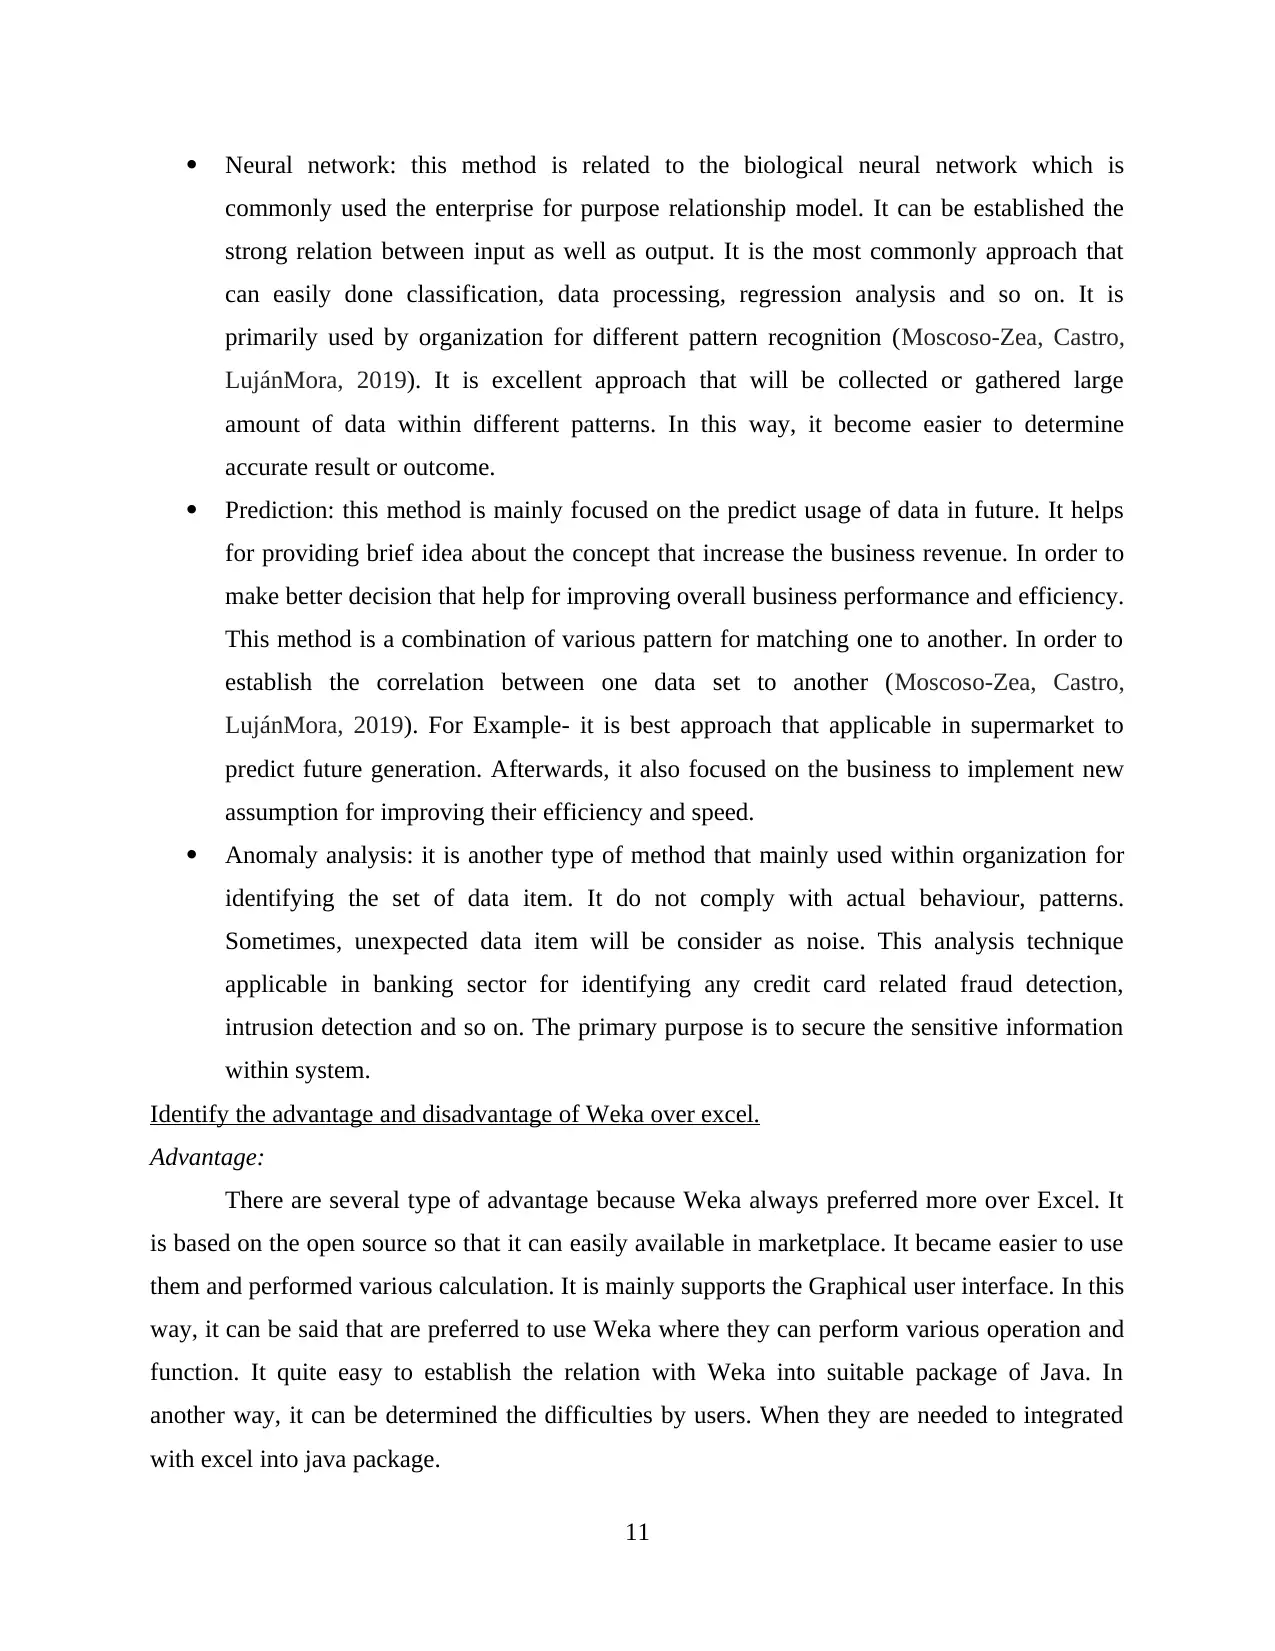
Neural network: this method is related to the biological neural network which is
commonly used the enterprise for purpose relationship model. It can be established the
strong relation between input as well as output. It is the most commonly approach that
can easily done classification, data processing, regression analysis and so on. It is
primarily used by organization for different pattern recognition (Moscoso-Zea, Castro,
LujánMora, 2019). It is excellent approach that will be collected or gathered large
amount of data within different patterns. In this way, it become easier to determine
accurate result or outcome.
Prediction: this method is mainly focused on the predict usage of data in future. It helps
for providing brief idea about the concept that increase the business revenue. In order to
make better decision that help for improving overall business performance and efficiency.
This method is a combination of various pattern for matching one to another. In order to
establish the correlation between one data set to another (Moscoso-Zea, Castro,
LujánMora, 2019). For Example- it is best approach that applicable in supermarket to
predict future generation. Afterwards, it also focused on the business to implement new
assumption for improving their efficiency and speed.
Anomaly analysis: it is another type of method that mainly used within organization for
identifying the set of data item. It do not comply with actual behaviour, patterns.
Sometimes, unexpected data item will be consider as noise. This analysis technique
applicable in banking sector for identifying any credit card related fraud detection,
intrusion detection and so on. The primary purpose is to secure the sensitive information
within system.
Identify the advantage and disadvantage of Weka over excel.
Advantage:
There are several type of advantage because Weka always preferred more over Excel. It
is based on the open source so that it can easily available in marketplace. It became easier to use
them and performed various calculation. It is mainly supports the Graphical user interface. In this
way, it can be said that are preferred to use Weka where they can perform various operation and
function. It quite easy to establish the relation with Weka into suitable package of Java. In
another way, it can be determined the difficulties by users. When they are needed to integrated
with excel into java package.
11
The advantage of weka where it provide various facilities of data prediction, selection of
feature and also integrated with data mining algorithm. This means that when only one data
format required to generate result or outcome. Weka is not only used for development but it also
help for generating various patterns. In order to compare with excel that will increase data in
multiple format such as CSV, and C4.5, binary.
Disadvantage
The disadvantage is that when associated with Weka due to lack of proper
documentation. Therefore, it has been increased the limitation in the entire system which require
for constantly update but excel constant upgrading is not required. In this way, it become worst
connectivity to Excel spreadsheet and other Java based database. Weka is not robust to read the
information or data because it is performed rapid miner (Moscoso-Zea, Castro, LujánMora,
2019). It cannot provide the facility to save parameter for scaling and applied in the future data
collection. The disadvantage is worst connectivity to excel spreadsheet and other non-java based
datasets. Weka is not read CSV file because it is not robust. It is not offering the visualisation
technique because it does sufficient to handle it. The data mining technique cannot perform
without proper technique so as require to implement suitable task and generate more result.
Another disadvantage is scaling (Moscoso-Zea, Castro, LujánMora, 2019). At single time, there
are large amount of data set running especially when it can perform task. In most of time, Java
will be generating error due to failure issue. Whenever, it has require to work with large data but
necessary to reduce entire size of data set. Moreover, it is not useful to test the entire data by
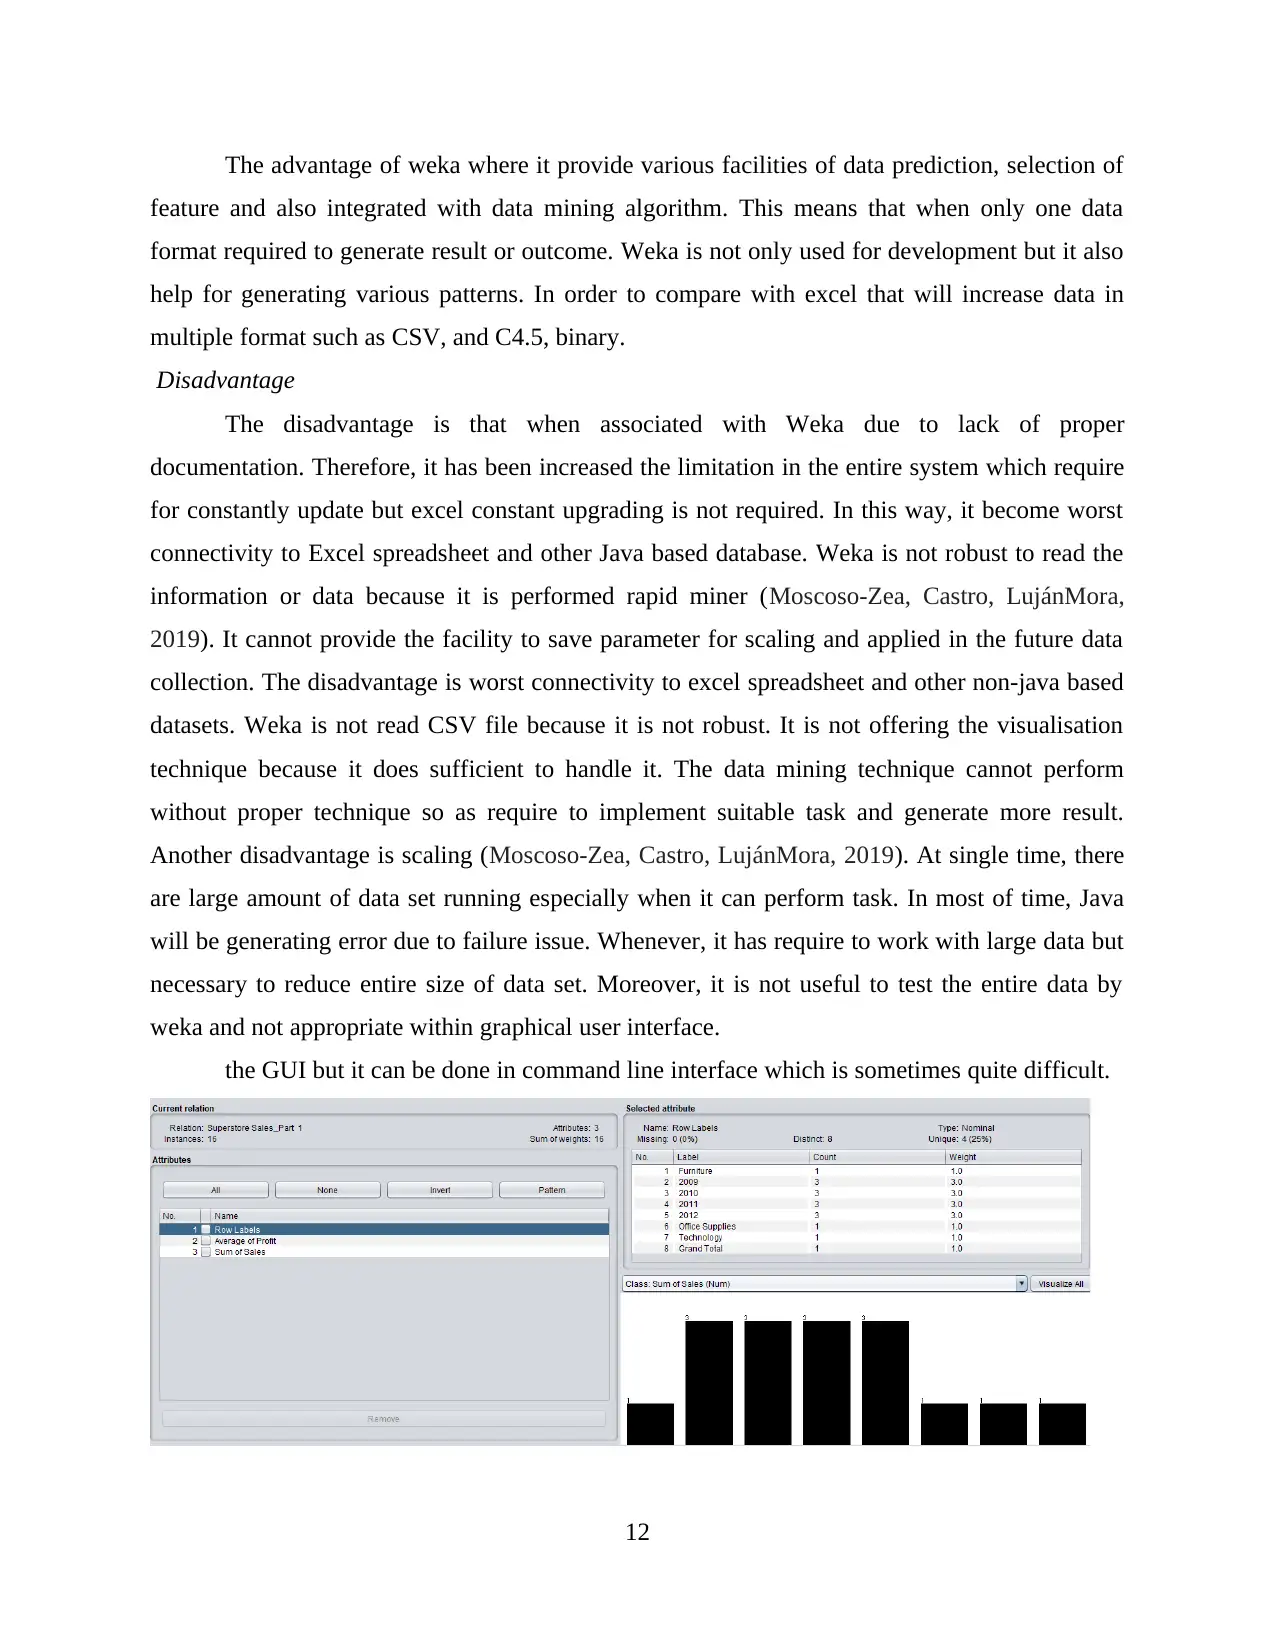
weka and not appropriate within graphical user interface.
the GUI but it can be done in command line interface which is sometimes quite difficult.
12
feature and also integrated with data mining algorithm. This means that when only one data
format required to generate result or outcome. Weka is not only used for development but it also
help for generating various patterns. In order to compare with excel that will increase data in
multiple format such as CSV, and C4.5, binary.
Disadvantage
The disadvantage is that when associated with Weka due to lack of proper
documentation. Therefore, it has been increased the limitation in the entire system which require
for constantly update but excel constant upgrading is not required. In this way, it become worst
connectivity to Excel spreadsheet and other Java based database. Weka is not robust to read the
information or data because it is performed rapid miner (Moscoso-Zea, Castro, LujánMora,
2019). It cannot provide the facility to save parameter for scaling and applied in the future data
collection. The disadvantage is worst connectivity to excel spreadsheet and other non-java based
datasets. Weka is not read CSV file because it is not robust. It is not offering the visualisation
technique because it does sufficient to handle it. The data mining technique cannot perform
without proper technique so as require to implement suitable task and generate more result.
Another disadvantage is scaling (Moscoso-Zea, Castro, LujánMora, 2019). At single time, there
are large amount of data set running especially when it can perform task. In most of time, Java
will be generating error due to failure issue. Whenever, it has require to work with large data but
necessary to reduce entire size of data set. Moreover, it is not useful to test the entire data by
weka and not appropriate within graphical user interface.
the GUI but it can be done in command line interface which is sometimes quite difficult.
12
⊘ This is a preview!⊘
Do you want full access?
Subscribe today to unlock all pages.
Trusted by 1+ million students worldwide
1 out of 18
Related Documents


Your All-in-One AI-Powered Toolkit for Academic Success.
+13062052269
info@desklib.com
Available 24*7 on WhatsApp / Email
![[object Object]](/_next/static/media/star-bottom.7253800d.svg)
Unlock your academic potential
Copyright © 2020–2026 A2Z Services. All Rights Reserved. Developed and managed by ZUCOL.