Data Handling and Business Intelligence: Superstore and WEKA Analysis
VerifiedAdded on 2023/01/11
|18
|3844
|47
Report
AI Summary
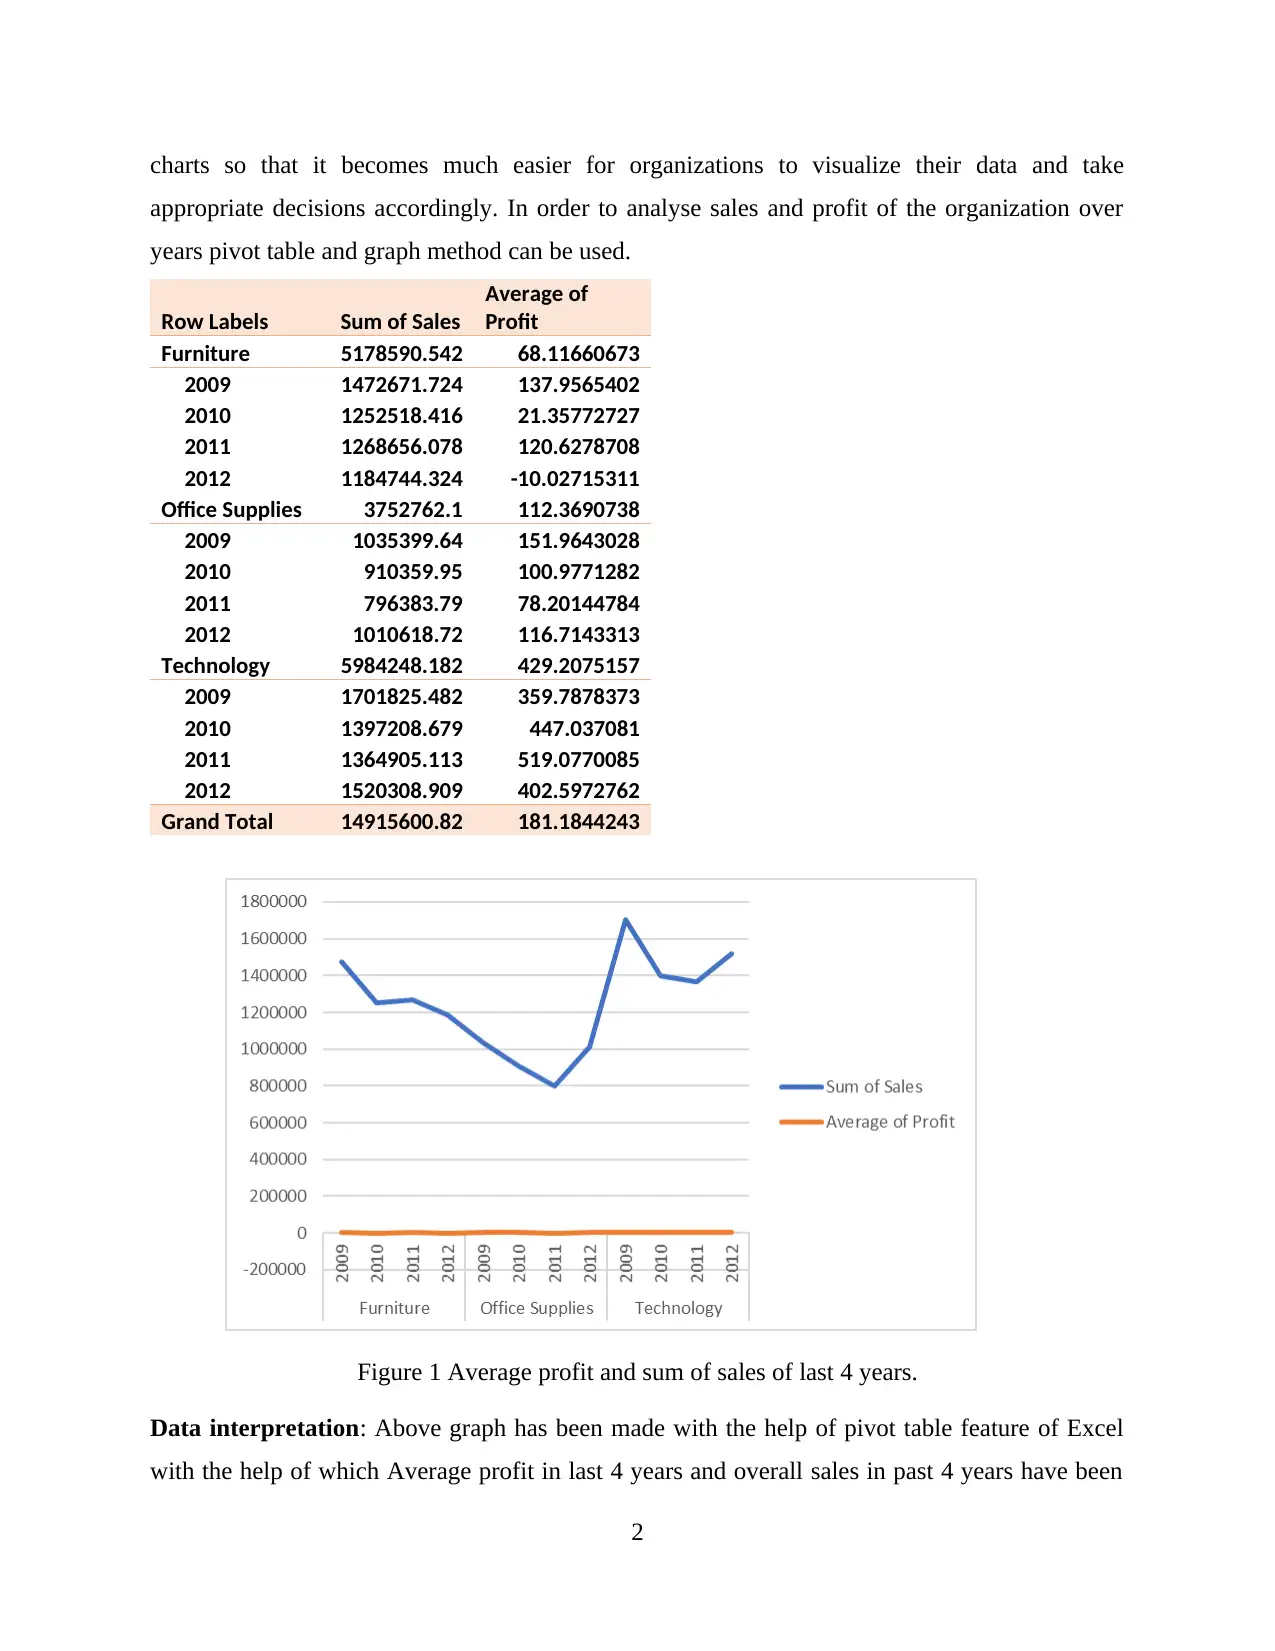
This report provides a comprehensive analysis of data handling and business intelligence, focusing on the application of data mining techniques to a superstore dataset. The report begins with an introduction to data mining and business intelligence, emphasizing their importance in modern organizations. Part 1 delves into the analysis of superstore data using Excel, demonstrating the practical use of functions like Lookup and Pivot tables to analyze profit and sales trends over several years. Data visualization through graphs and charts is also demonstrated. Part 2 shifts to the use of WEKA, showcasing clustering analysis using an audidealership.csv file. The report explains commonly used data mining methods such as association, classification, and clustering analysis with real-time examples. It concludes with a discussion of the advantages and disadvantages of WEKA. Overall, the report offers a practical guide to data analysis and business intelligence, making it a valuable resource for students on Desklib.
1 out of 18
Related Documents


Your All-in-One AI-Powered Toolkit for Academic Success.
+13062052269
info@desklib.com
Available 24*7 on WhatsApp / Email
![[object Object]](/_next/static/media/star-bottom.7253800d.svg)
Copyright © 2020–2025 A2Z Services. All Rights Reserved. Developed and managed by ZUCOL.