Data Handling and Business Intelligence: Excel, WEKA, and Data Mining
VerifiedAdded on 2023/01/11
|16
|3473
|40
Report
AI Summary
This report delves into data handling and business intelligence, exploring the use of Microsoft Excel for data pre-processing, analysis, and visualization using the Superstore dataset. The analysis focuses on identifying trends such as the decline in sales and profits, and the factors influencing these trends. The report then transitions to the application of WEKA, an analytical application, to the audidealership.csv dataset, utilizing K-means clustering to identify patterns and insights within the data. Furthermore, the report explains various data mining methods, including sequential patterns and decision trees, providing real-world examples of their application in business. Finally, it compares the advantages and disadvantages of WEKA over Excel for data analysis and mining, offering a comprehensive overview of data analysis techniques.
Data handling and business
intelligence
intelligence
Paraphrase This Document
Need a fresh take? Get an instant paraphrase of this document with our AI Paraphraser
Contents
INTRODUCTION...........................................................................................................................1
PART 1............................................................................................................................................1
Evaluating the use of Excel for pre-processing, analysing and visualising the data using
Superstore data and determining the decline in sales/profits over the years...............................1
PART 2............................................................................................................................................8
2.1 Workings of WEKA using audidealership.csv......................................................................8
2.2 Explaining data mining methods that can be used in business with real world examples. .11
2.3 Discussing the advantages and disadvantages of WEKA over Excel.................................13
CONCLUSION..............................................................................................................................14
REFERENCES..............................................................................................................................15
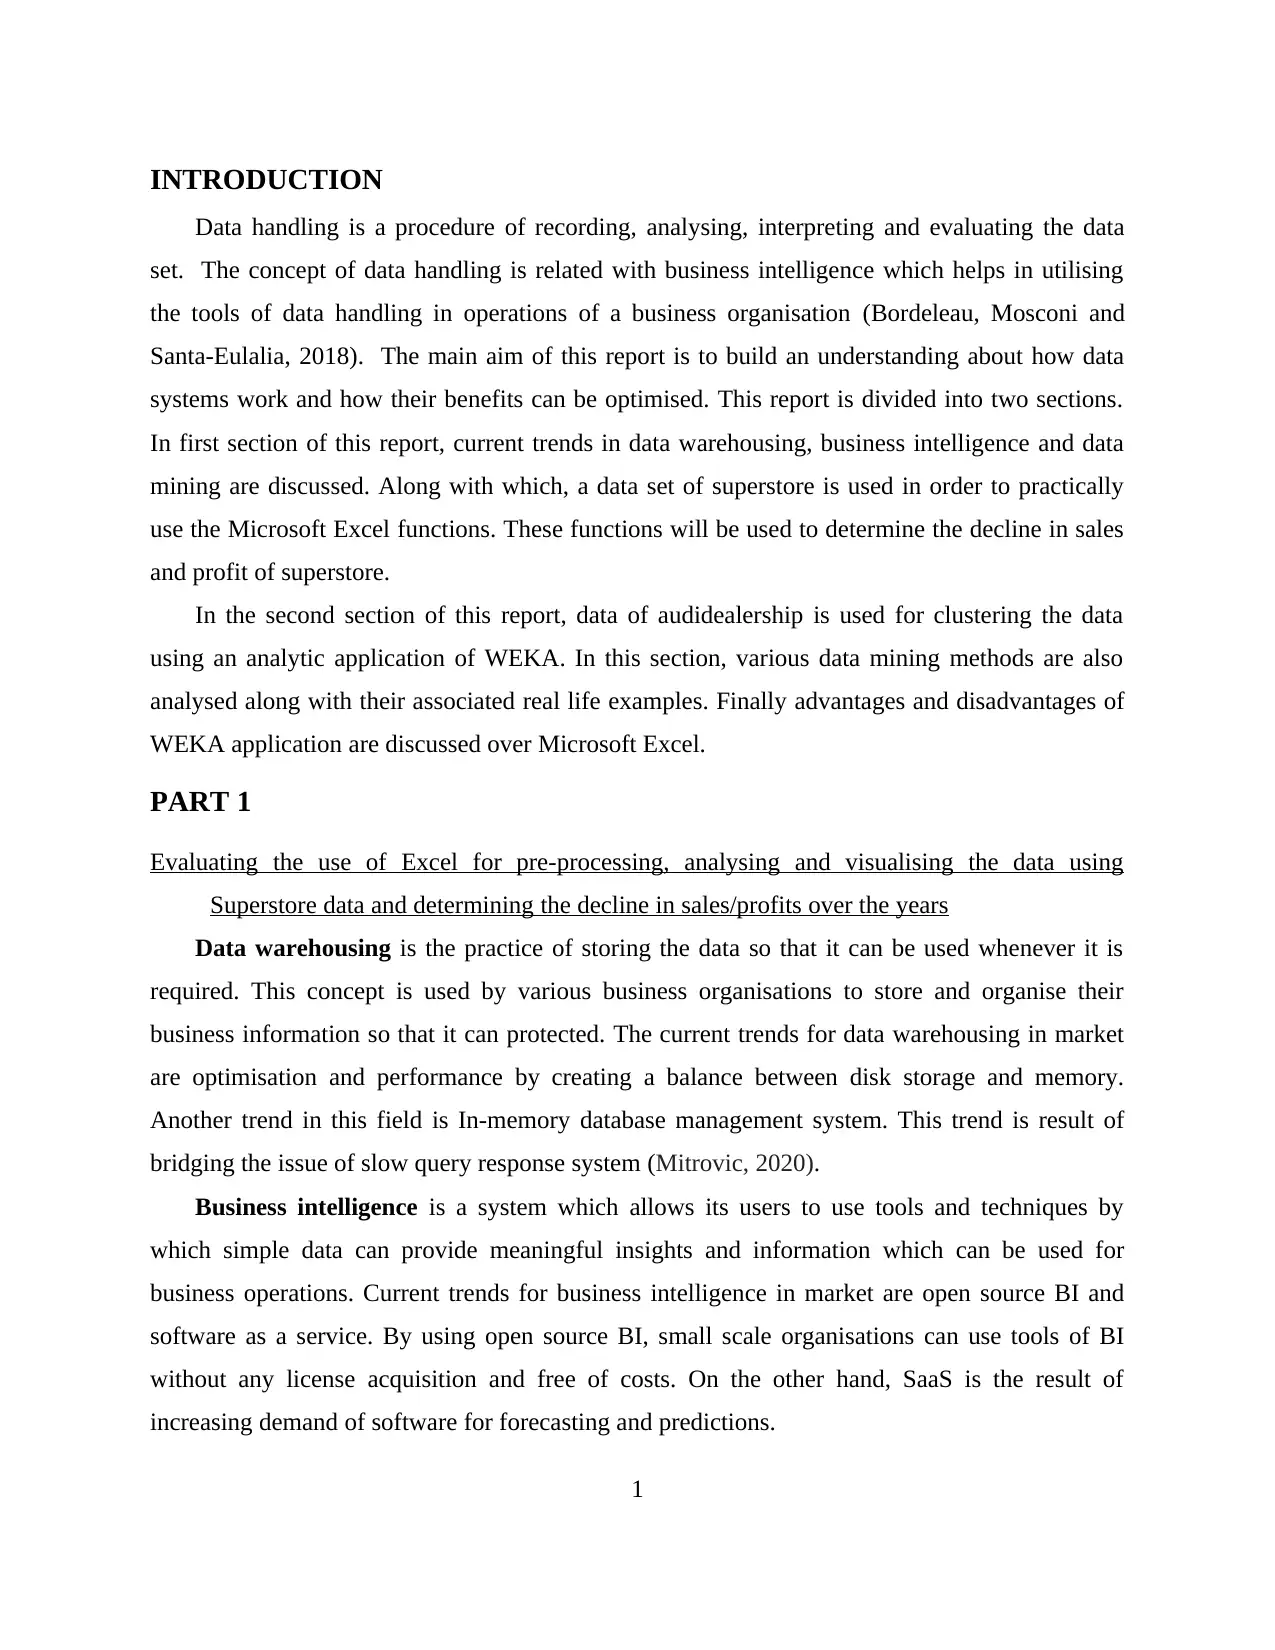
INTRODUCTION
Data handling is a procedure of recording, analysing, interpreting and evaluating the data
set. The concept of data handling is related with business intelligence which helps in utilising
the tools of data handling in operations of a business organisation (Bordeleau, Mosconi and
Santa-Eulalia, 2018). The main aim of this report is to build an understanding about how data
systems work and how their benefits can be optimised. This report is divided into two sections.
In first section of this report, current trends in data warehousing, business intelligence and data
mining are discussed. Along with which, a data set of superstore is used in order to practically
use the Microsoft Excel functions. These functions will be used to determine the decline in sales
and profit of superstore.
In the second section of this report, data of audidealership is used for clustering the data
using an analytic application of WEKA. In this section, various data mining methods are also
analysed along with their associated real life examples. Finally advantages and disadvantages of
WEKA application are discussed over Microsoft Excel.
PART 1
Evaluating the use of Excel for pre-processing, analysing and visualising the data using
Superstore data and determining the decline in sales/profits over the years
Data warehousing is the practice of storing the data so that it can be used whenever it is
required. This concept is used by various business organisations to store and organise their
business information so that it can protected. The current trends for data warehousing in market
are optimisation and performance by creating a balance between disk storage and memory.
Another trend in this field is In-memory database management system. This trend is result of
bridging the issue of slow query response system (Mitrovic, 2020).
Business intelligence is a system which allows its users to use tools and techniques by
which simple data can provide meaningful insights and information which can be used for
business operations. Current trends for business intelligence in market are open source BI and
software as a service. By using open source BI, small scale organisations can use tools of BI
without any license acquisition and free of costs. On the other hand, SaaS is the result of
increasing demand of software for forecasting and predictions.
1
⊘ This is a preview!⊘
Do you want full access?
Subscribe today to unlock all pages.
Trusted by 1+ million students worldwide
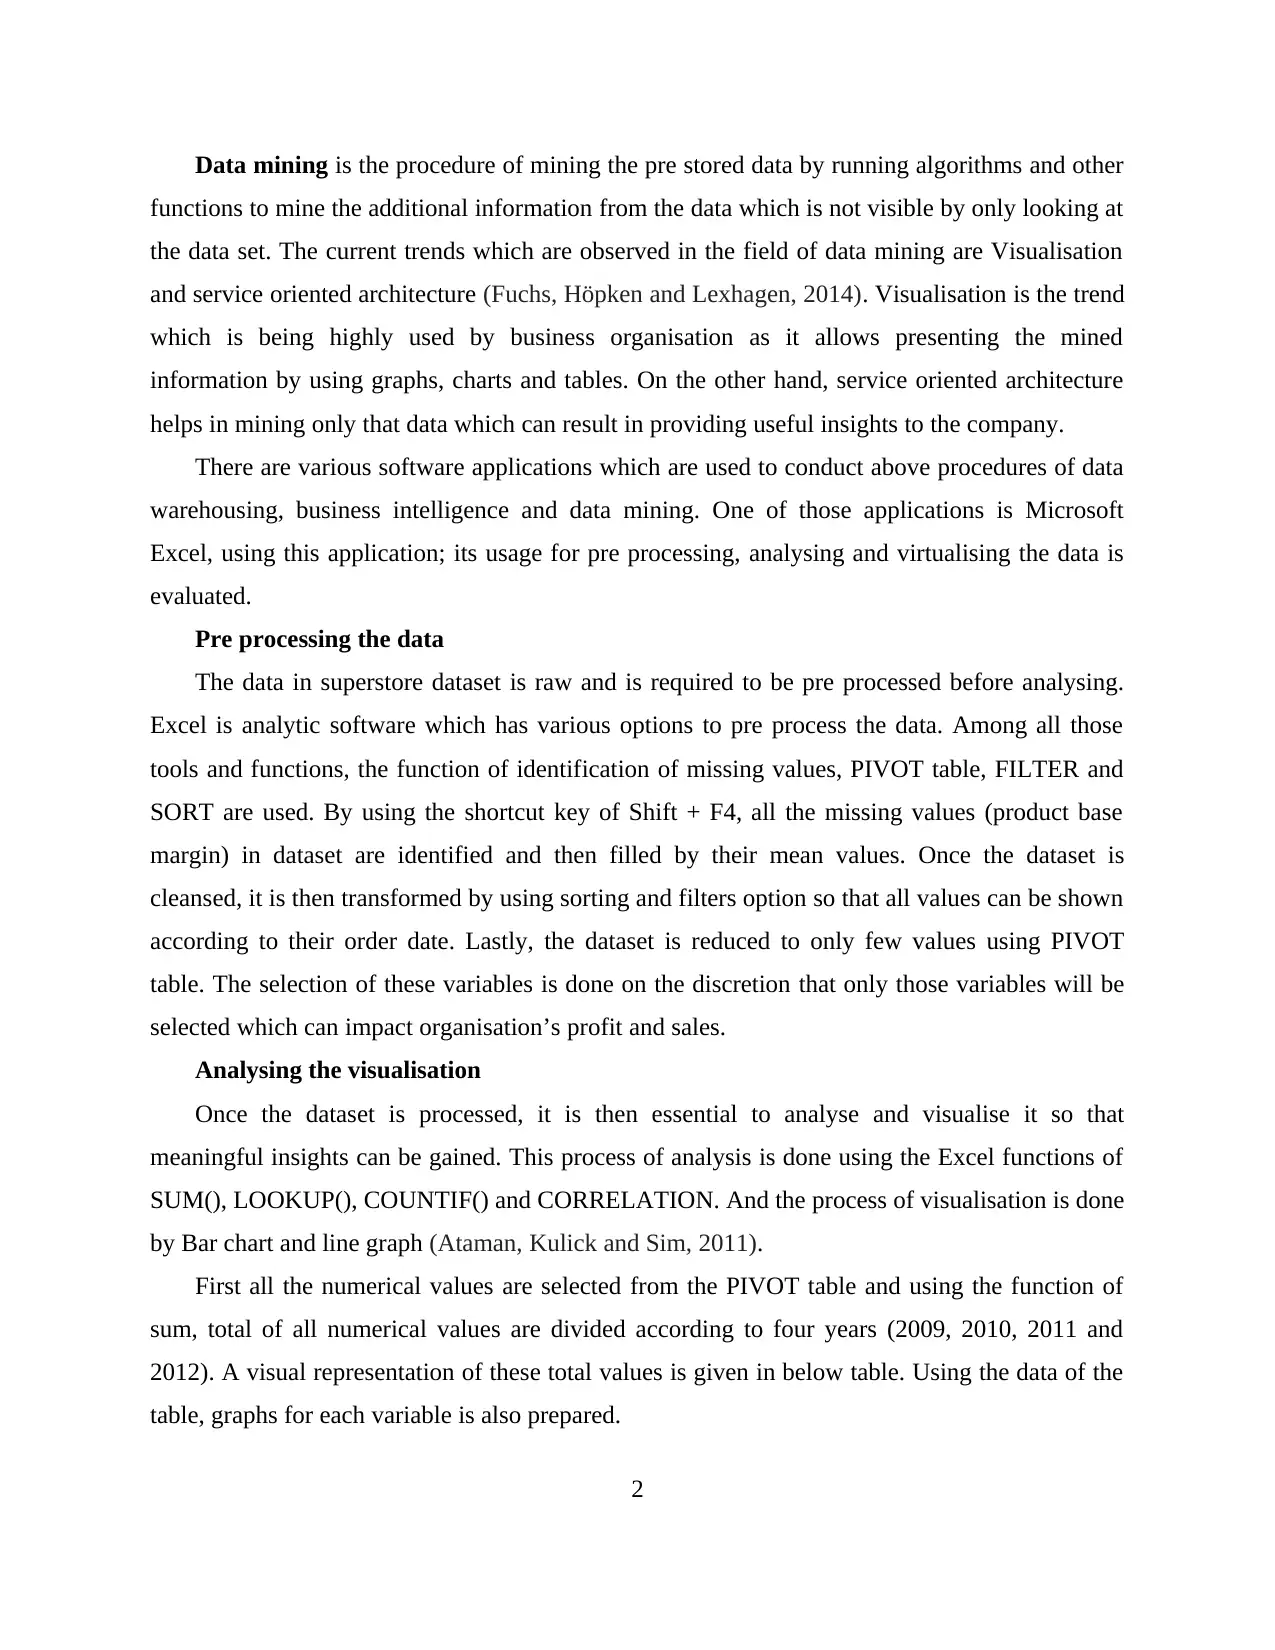
Data mining is the procedure of mining the pre stored data by running algorithms and other
functions to mine the additional information from the data which is not visible by only looking at
the data set. The current trends which are observed in the field of data mining are Visualisation
and service oriented architecture (Fuchs, Höpken and Lexhagen, 2014). Visualisation is the trend
which is being highly used by business organisation as it allows presenting the mined
information by using graphs, charts and tables. On the other hand, service oriented architecture
helps in mining only that data which can result in providing useful insights to the company.
There are various software applications which are used to conduct above procedures of data
warehousing, business intelligence and data mining. One of those applications is Microsoft
Excel, using this application; its usage for pre processing, analysing and virtualising the data is
evaluated.
Pre processing the data
The data in superstore dataset is raw and is required to be pre processed before analysing.
Excel is analytic software which has various options to pre process the data. Among all those
tools and functions, the function of identification of missing values, PIVOT table, FILTER and
SORT are used. By using the shortcut key of Shift + F4, all the missing values (product base
margin) in dataset are identified and then filled by their mean values. Once the dataset is
cleansed, it is then transformed by using sorting and filters option so that all values can be shown
according to their order date. Lastly, the dataset is reduced to only few values using PIVOT
table. The selection of these variables is done on the discretion that only those variables will be
selected which can impact organisation’s profit and sales.
Analysing the visualisation
Once the dataset is processed, it is then essential to analyse and visualise it so that
meaningful insights can be gained. This process of analysis is done using the Excel functions of
SUM(), LOOKUP(), COUNTIF() and CORRELATION. And the process of visualisation is done
by Bar chart and line graph (Ataman, Kulick and Sim, 2011).
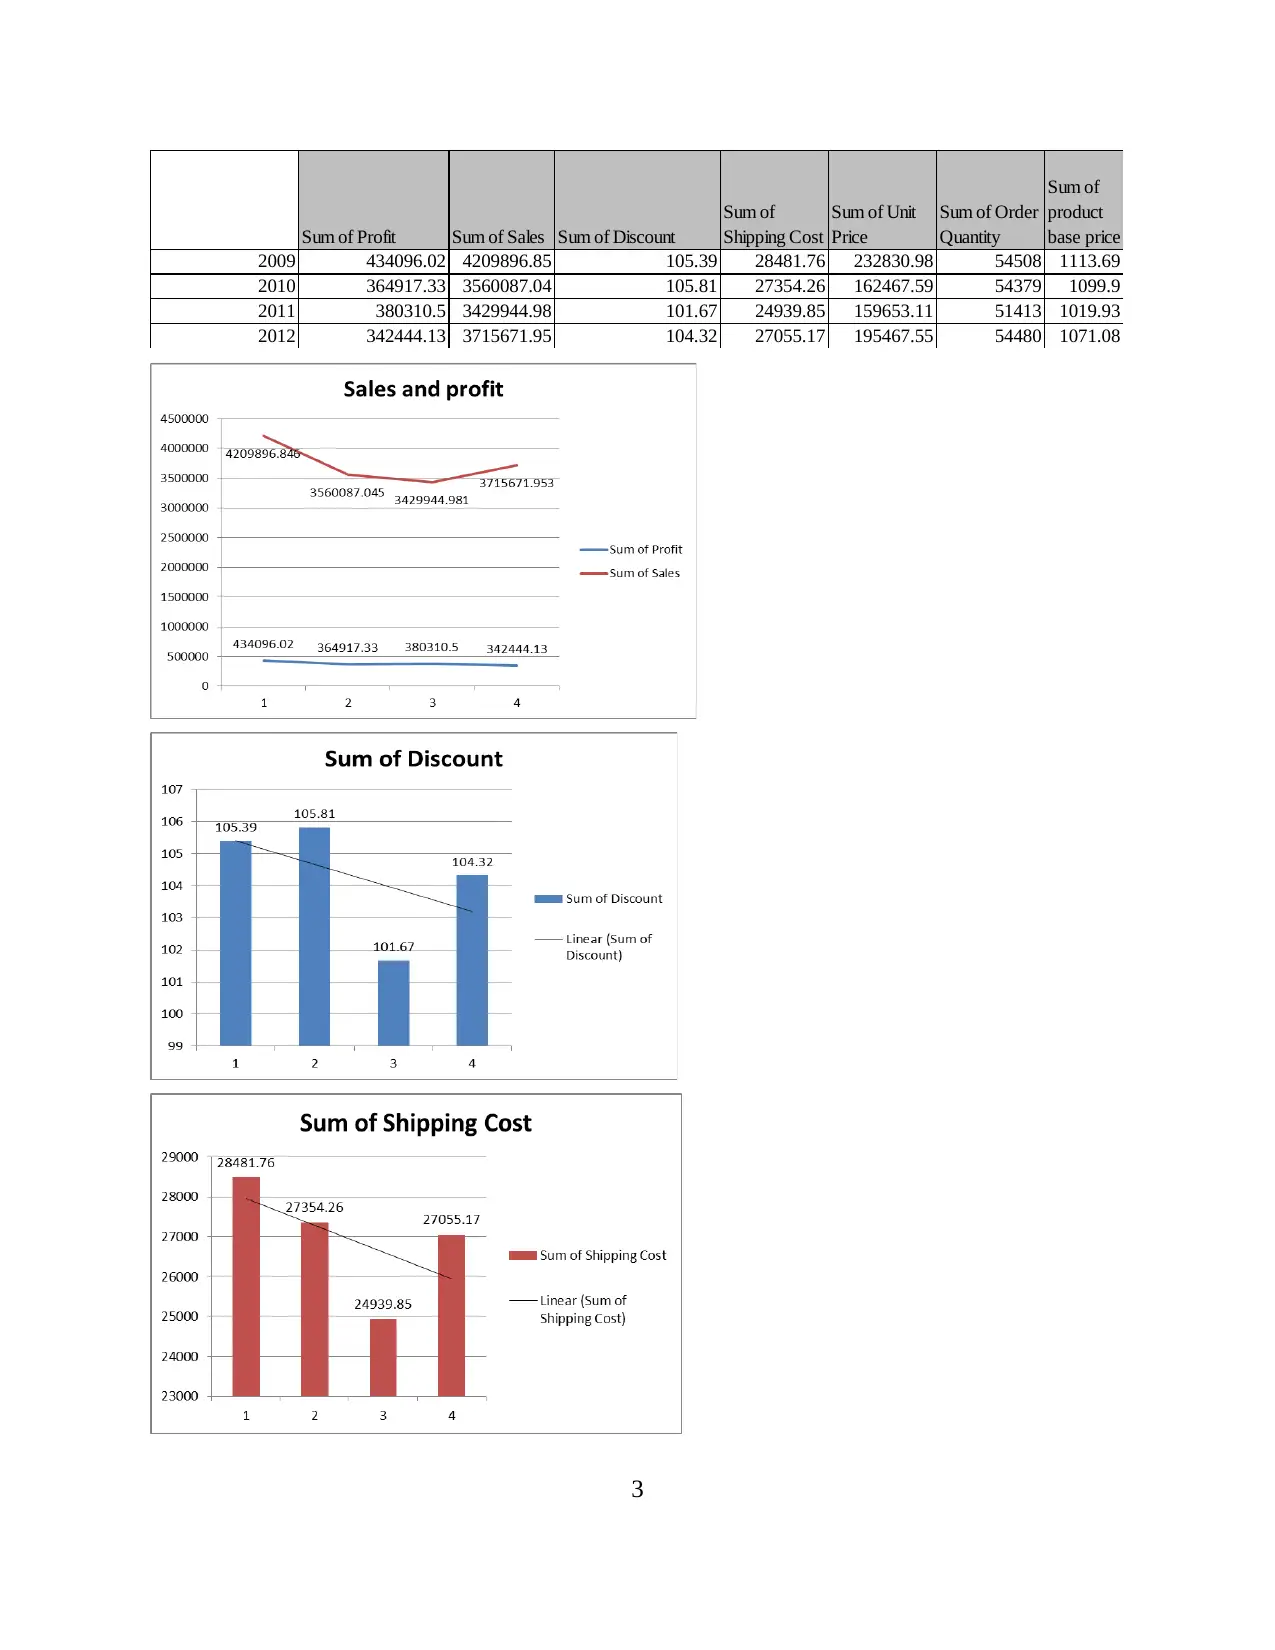
First all the numerical values are selected from the PIVOT table and using the function of
sum, total of all numerical values are divided according to four years (2009, 2010, 2011 and
2012). A visual representation of these total values is given in below table. Using the data of the
table, graphs for each variable is also prepared.
2
functions to mine the additional information from the data which is not visible by only looking at
the data set. The current trends which are observed in the field of data mining are Visualisation
and service oriented architecture (Fuchs, Höpken and Lexhagen, 2014). Visualisation is the trend
which is being highly used by business organisation as it allows presenting the mined
information by using graphs, charts and tables. On the other hand, service oriented architecture
helps in mining only that data which can result in providing useful insights to the company.
There are various software applications which are used to conduct above procedures of data
warehousing, business intelligence and data mining. One of those applications is Microsoft
Excel, using this application; its usage for pre processing, analysing and virtualising the data is
evaluated.
Pre processing the data
The data in superstore dataset is raw and is required to be pre processed before analysing.
Excel is analytic software which has various options to pre process the data. Among all those
tools and functions, the function of identification of missing values, PIVOT table, FILTER and
SORT are used. By using the shortcut key of Shift + F4, all the missing values (product base
margin) in dataset are identified and then filled by their mean values. Once the dataset is
cleansed, it is then transformed by using sorting and filters option so that all values can be shown
according to their order date. Lastly, the dataset is reduced to only few values using PIVOT
table. The selection of these variables is done on the discretion that only those variables will be
selected which can impact organisation’s profit and sales.
Analysing the visualisation
Once the dataset is processed, it is then essential to analyse and visualise it so that
meaningful insights can be gained. This process of analysis is done using the Excel functions of
SUM(), LOOKUP(), COUNTIF() and CORRELATION. And the process of visualisation is done
by Bar chart and line graph (Ataman, Kulick and Sim, 2011).
First all the numerical values are selected from the PIVOT table and using the function of
sum, total of all numerical values are divided according to four years (2009, 2010, 2011 and
2012). A visual representation of these total values is given in below table. Using the data of the
table, graphs for each variable is also prepared.
2
Paraphrase This Document
Need a fresh take? Get an instant paraphrase of this document with our AI Paraphraser
Sum of Profit Sum of Sales Sum of Discount
Sum of
Shipping Cost
Sum of Unit
Price
Sum of Order
Quantity
Sum of
product
base price
2009 434096.02 4209896.85 105.39 28481.76 232830.98 54508 1113.69
2010 364917.33 3560087.04 105.81 27354.26 162467.59 54379 1099.9
2011 380310.5 3429944.98 101.67 24939.85 159653.11 51413 1019.93
2012 342444.13 3715671.95 104.32 27055.17 195467.55 54480 1071.08
3
Sum of
Shipping Cost
Sum of Unit
Price
Sum of Order
Quantity
Sum of
product
base price
2009 434096.02 4209896.85 105.39 28481.76 232830.98 54508 1113.69
2010 364917.33 3560087.04 105.81 27354.26 162467.59 54379 1099.9
2011 380310.5 3429944.98 101.67 24939.85 159653.11 51413 1019.93
2012 342444.13 3715671.95 104.32 27055.17 195467.55 54480 1071.08
3
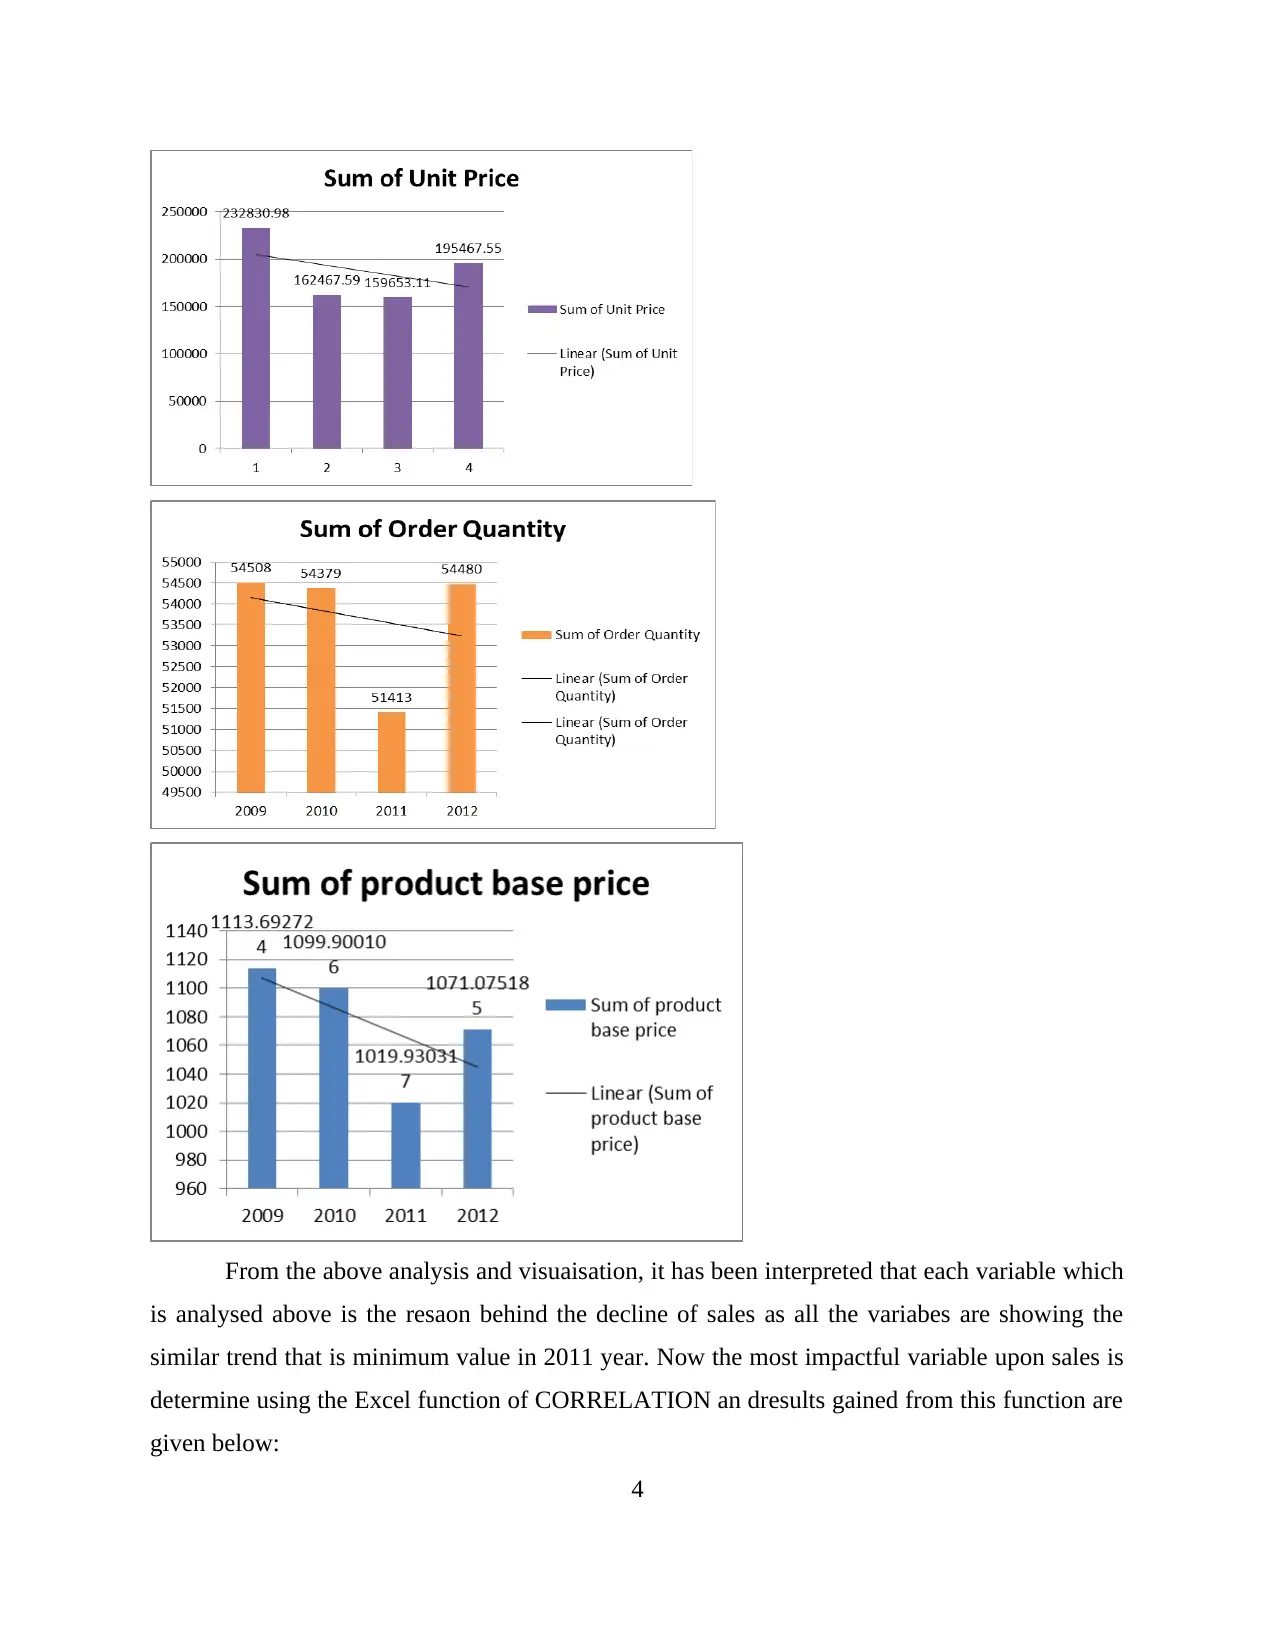
From the above analysis and visuaisation, it has been interpreted that each variable which
is analysed above is the resaon behind the decline of sales as all the variabes are showing the
similar trend that is minimum value in 2011 year. Now the most impactful variable upon sales is
determine using the Excel function of CORRELATION an dresults gained from this function are
given below:
4
is analysed above is the resaon behind the decline of sales as all the variabes are showing the
similar trend that is minimum value in 2011 year. Now the most impactful variable upon sales is
determine using the Excel function of CORRELATION an dresults gained from this function are
given below:
4
⊘ This is a preview!⊘
Do you want full access?
Subscribe today to unlock all pages.
Trusted by 1+ million students worldwide
Sum of Sales
Sum of
Discount
Sum of Shipping
Cost
Sum of Unit
Price
Sum of
Order
Quantity
Sum of
product base
price
Sum of Sales 1
Sum of Discount 0.554020074 1
Sum of Shipping
Cost 0.837509053 0.91691319 1
Sum of Unit Price 0.976545347 0.4445884 0.764093544 1
Sum of Order
Quantity 0.607858343 0.93397643 0.916714438 0.57228736 1
Sum of product
base price 0.728272194 0.96997286 0.976006533 0.61764576 0.90322642 1
This is clear from above results that unit price is the main reason behind the decline in
sales. Superstore has reduced the unit price of thei products due to which sales revenue of this
organisation has been reduced.
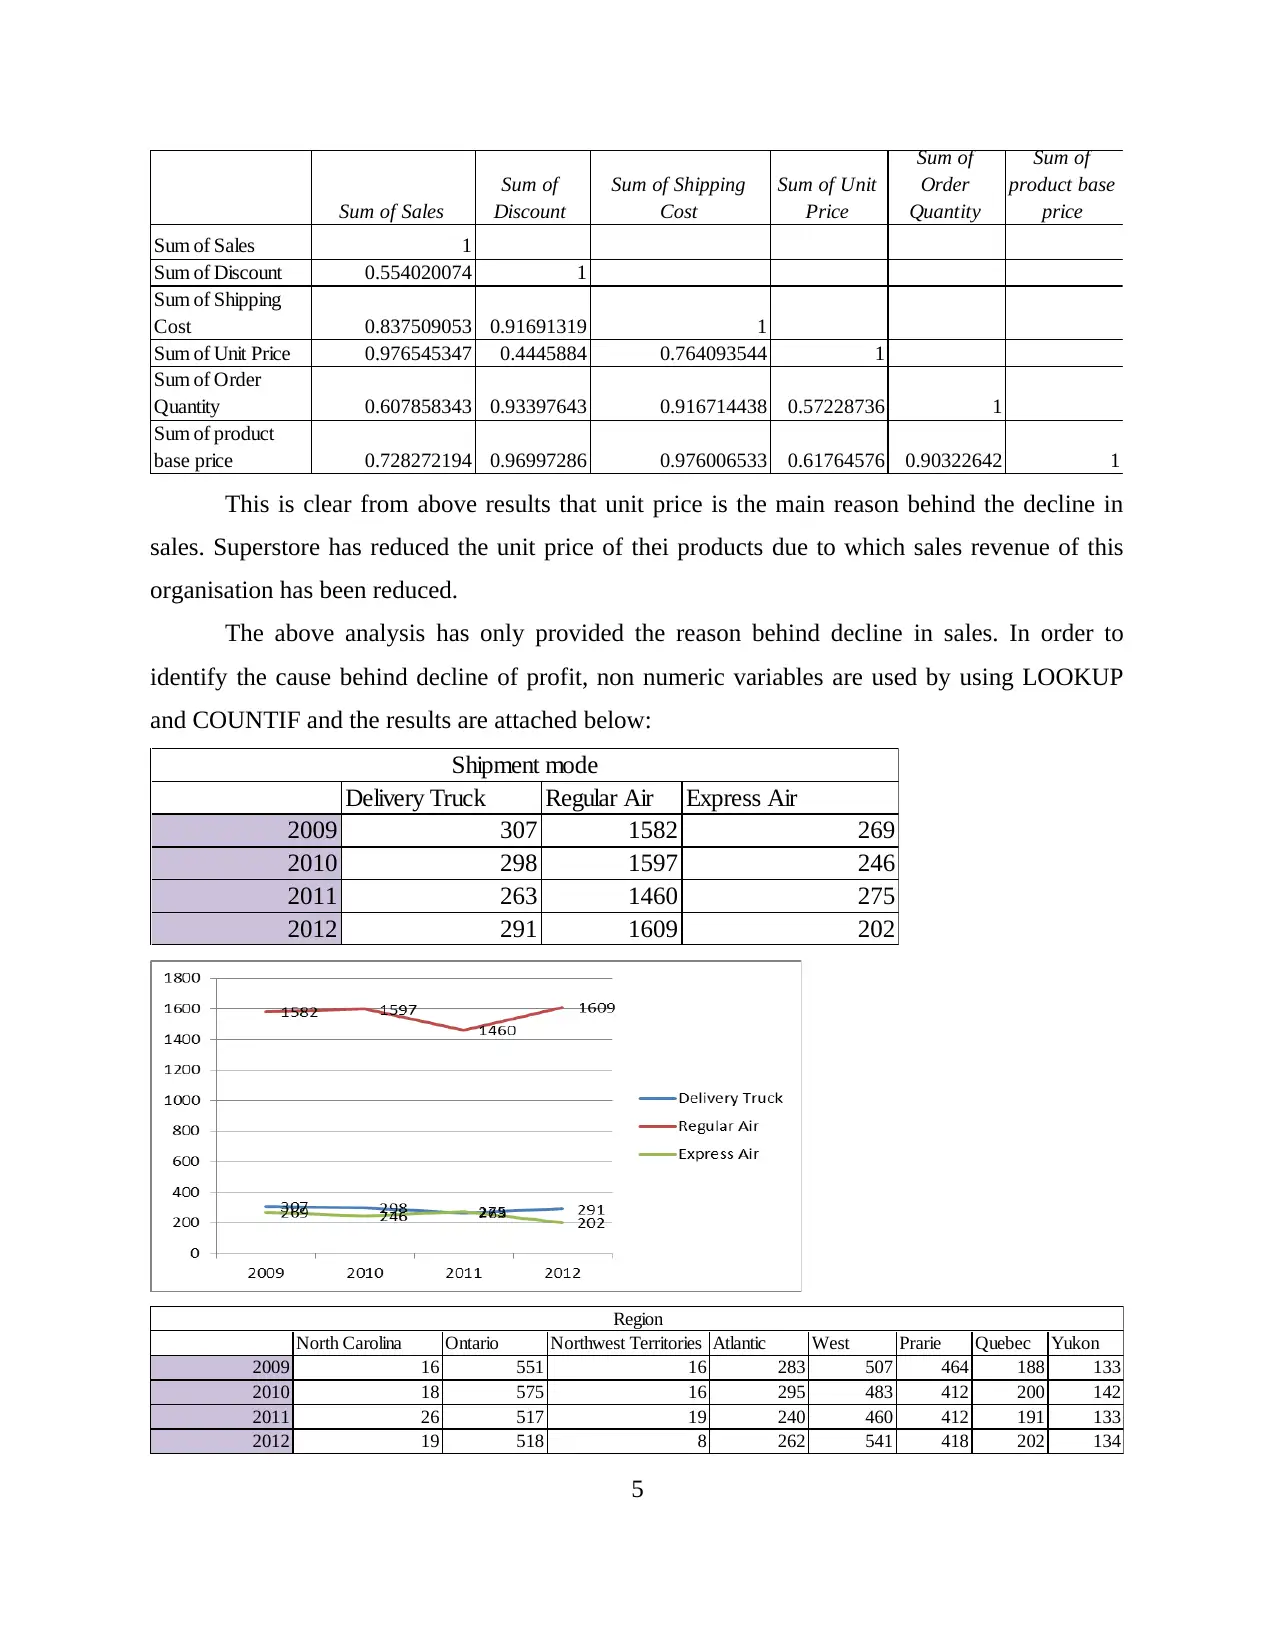
The above analysis has only provided the reason behind decline in sales. In order to
identify the cause behind decline of profit, non numeric variables are used by using LOOKUP
and COUNTIF and the results are attached below:
Delivery Truck Regular Air Express Air
2009 307 1582 269
2010 298 1597 246
2011 263 1460 275
2012 291 1609 202
Shipment mode
North Carolina Ontario Northwest Territories Atlantic West Prarie Quebec Yukon
2009 16 551 16 283 507 464 188 133
2010 18 575 16 295 483 412 200 142
2011 26 517 19 240 460 412 191 133
2012 19 518 8 262 541 418 202 134
Region
5
Sum of
Discount
Sum of Shipping
Cost
Sum of Unit
Price
Sum of
Order
Quantity
Sum of
product base
price
Sum of Sales 1
Sum of Discount 0.554020074 1
Sum of Shipping
Cost 0.837509053 0.91691319 1
Sum of Unit Price 0.976545347 0.4445884 0.764093544 1
Sum of Order
Quantity 0.607858343 0.93397643 0.916714438 0.57228736 1
Sum of product
base price 0.728272194 0.96997286 0.976006533 0.61764576 0.90322642 1
This is clear from above results that unit price is the main reason behind the decline in
sales. Superstore has reduced the unit price of thei products due to which sales revenue of this
organisation has been reduced.
The above analysis has only provided the reason behind decline in sales. In order to
identify the cause behind decline of profit, non numeric variables are used by using LOOKUP
and COUNTIF and the results are attached below:
Delivery Truck Regular Air Express Air
2009 307 1582 269
2010 298 1597 246
2011 263 1460 275
2012 291 1609 202
Shipment mode
North Carolina Ontario Northwest Territories Atlantic West Prarie Quebec Yukon
2009 16 551 16 283 507 464 188 133
2010 18 575 16 295 483 412 200 142
2011 26 517 19 240 460 412 191 133
2012 19 518 8 262 541 418 202 134
Region
5
Paraphrase This Document
Need a fresh take? Get an instant paraphrase of this document with our AI Paraphraser
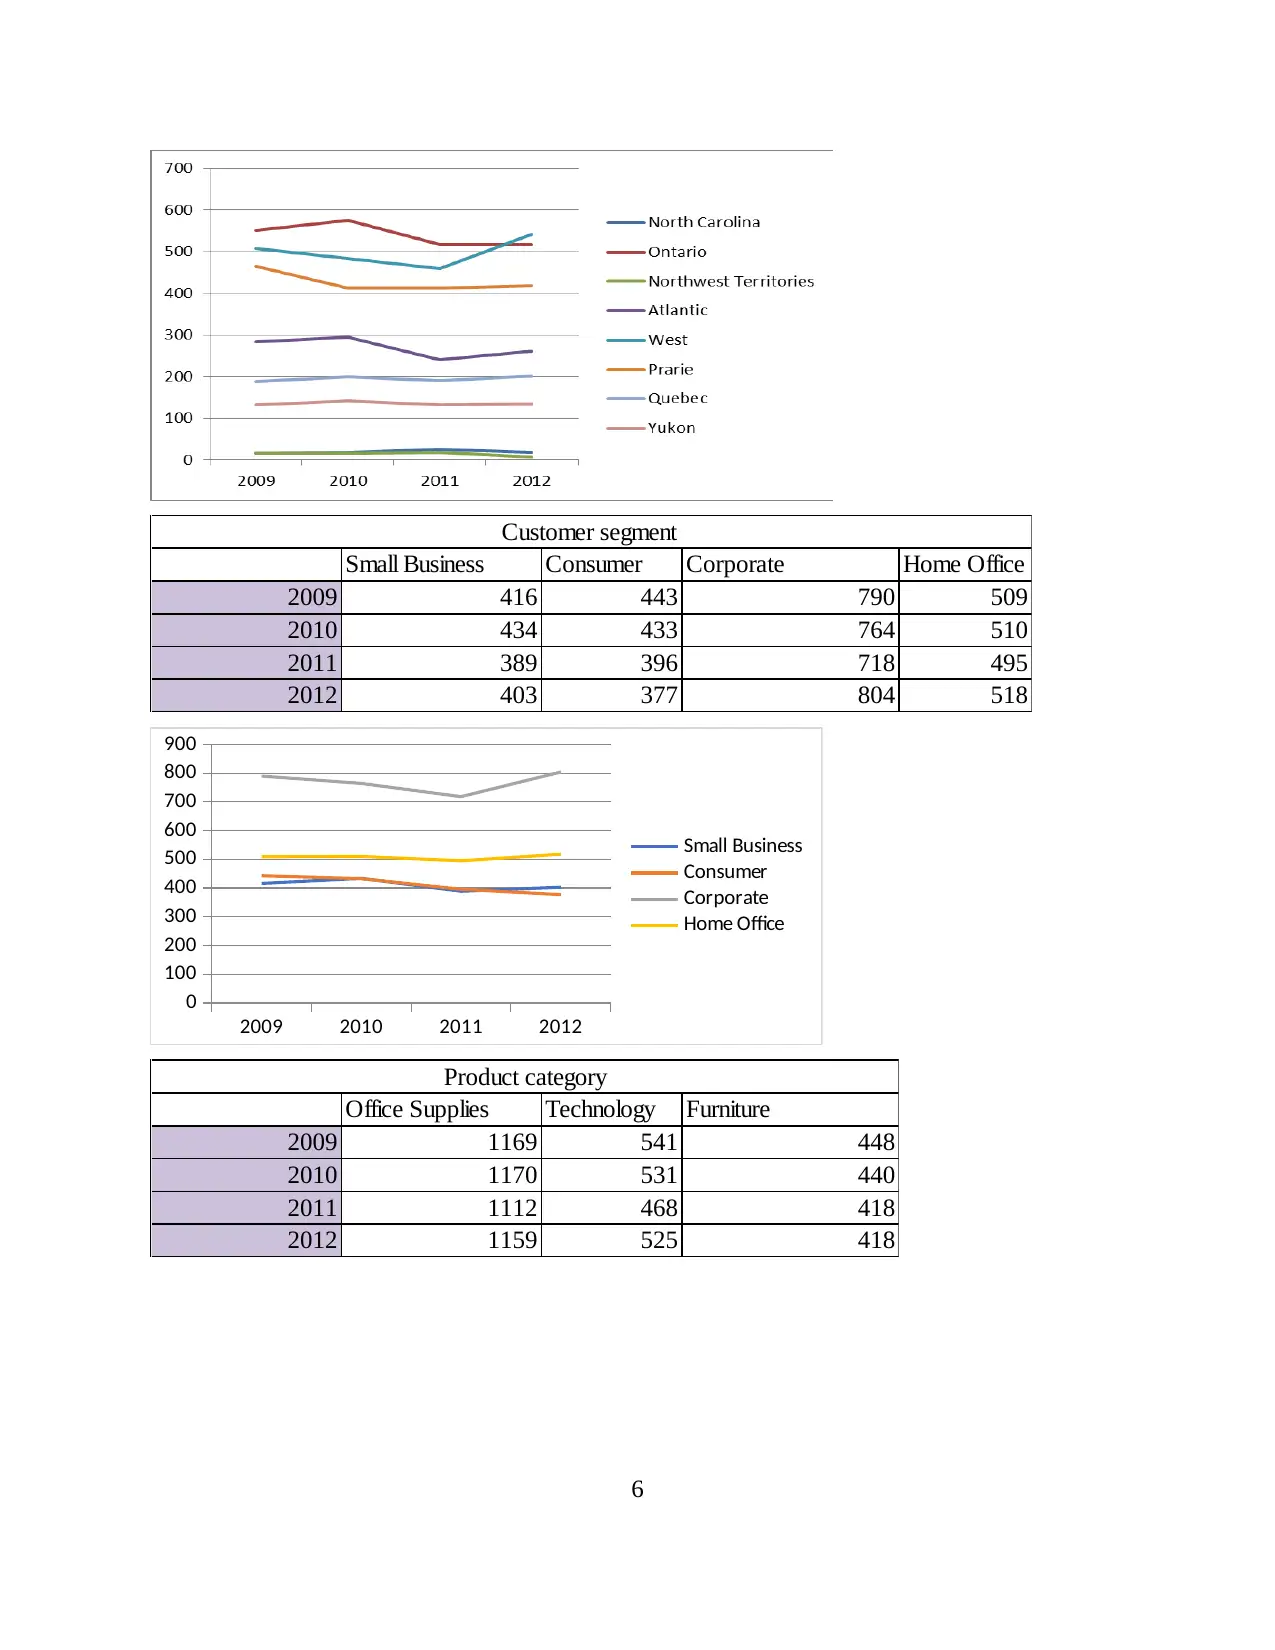
Small Business Consumer Corporate Home Office
2009 416 443 790 509
2010 434 433 764 510
2011 389 396 718 495
2012 403 377 804 518
Customer segment
2009 2010 2011 2012
0
100
200
300
400
500
600
700
800
900
Small Business
Consumer
Corporate
Home Office
Office Supplies Technology Furniture
2009 1169 541 448
2010 1170 531 440
2011 1112 468 418
2012 1159 525 418
Product category
6
2009 2010 2011 2012
0
200
400
600
800
1000
1200
1400
Office Supplies
Technology
Furniture
Sum of
Profit Express Air
Northwest
Territories Consumer Furniture
Sum of Profit 1
Express Air 0.74897056 1
Northwest
Territories 0.55005312 0.95812629 1
Consumer 0.73593026 0.580260641 0.53173167 1
Furniture 0.70546329 0.383957397 0.29899993 0.96525964 1
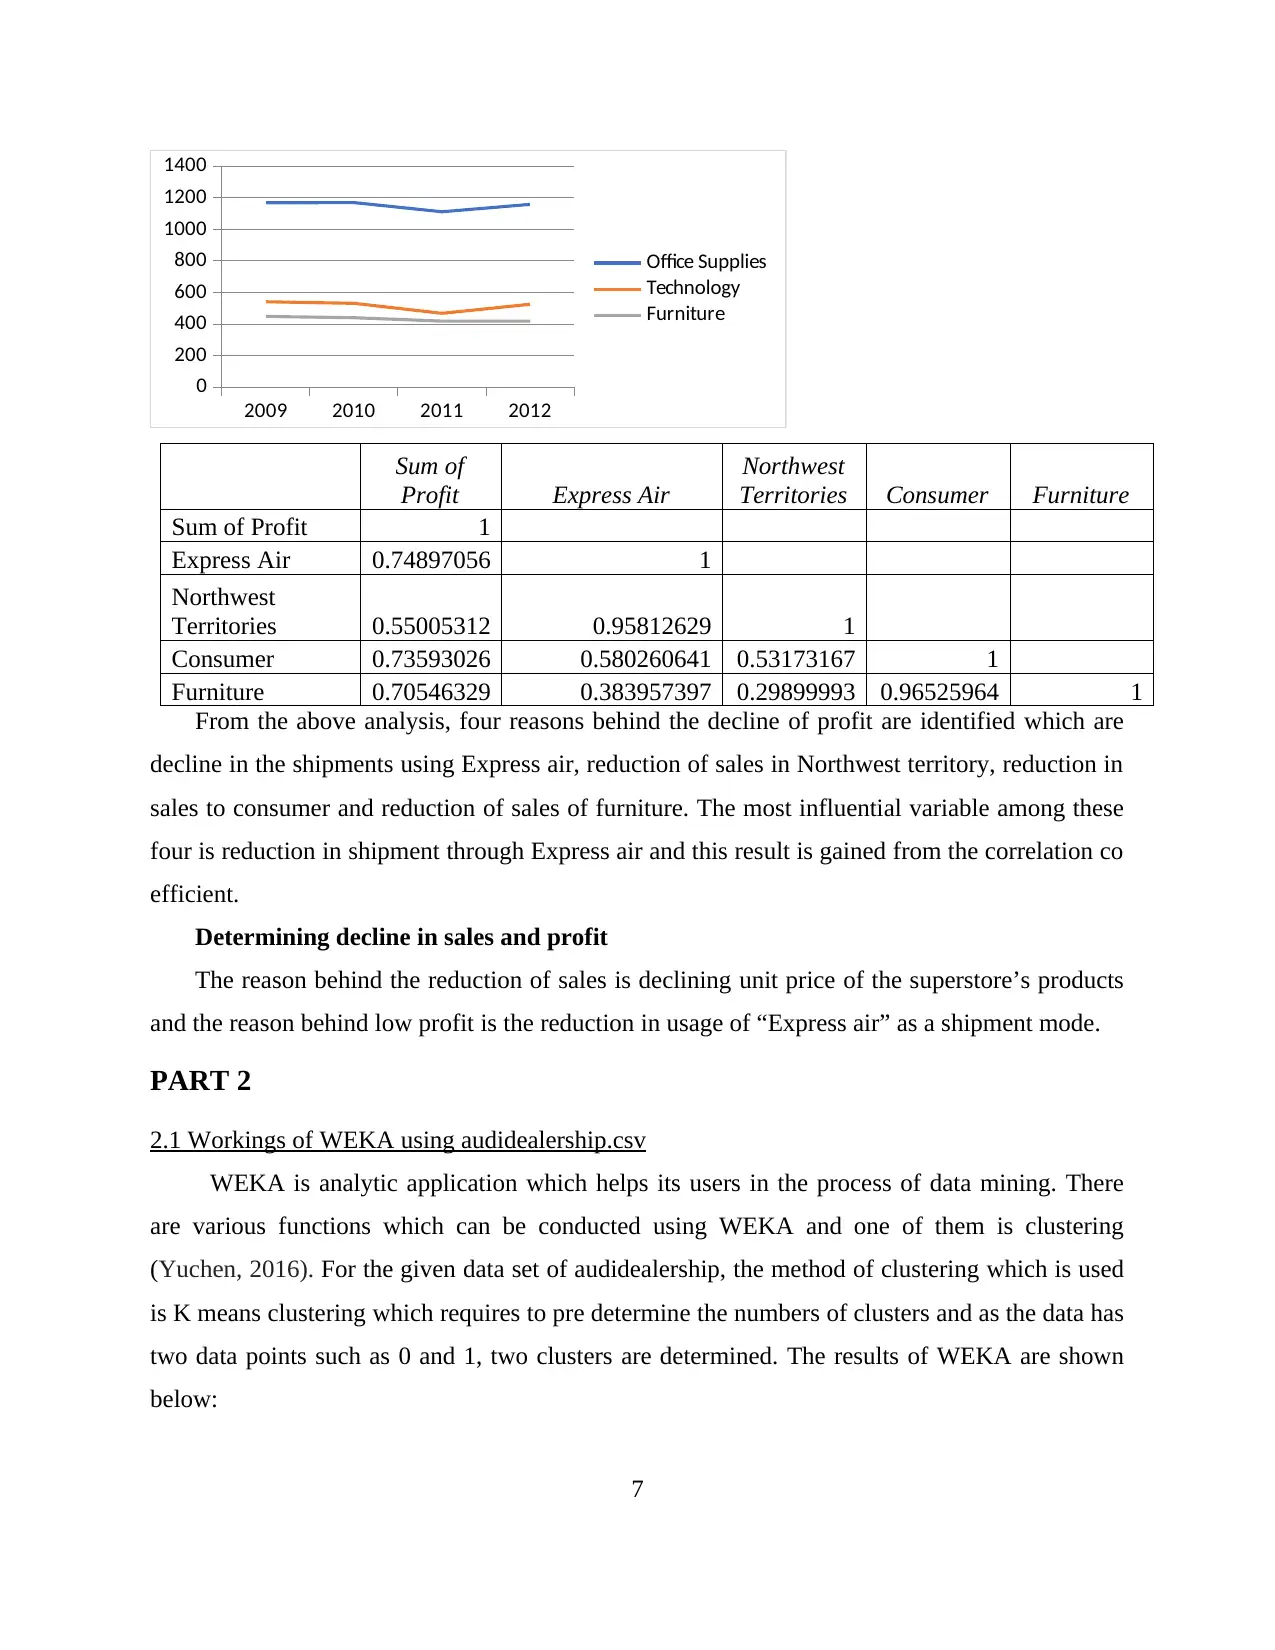
From the above analysis, four reasons behind the decline of profit are identified which are
decline in the shipments using Express air, reduction of sales in Northwest territory, reduction in
sales to consumer and reduction of sales of furniture. The most influential variable among these
four is reduction in shipment through Express air and this result is gained from the correlation co
efficient.
Determining decline in sales and profit
The reason behind the reduction of sales is declining unit price of the superstore’s products
and the reason behind low profit is the reduction in usage of “Express air” as a shipment mode.
PART 2
2.1 Workings of WEKA using audidealership.csv
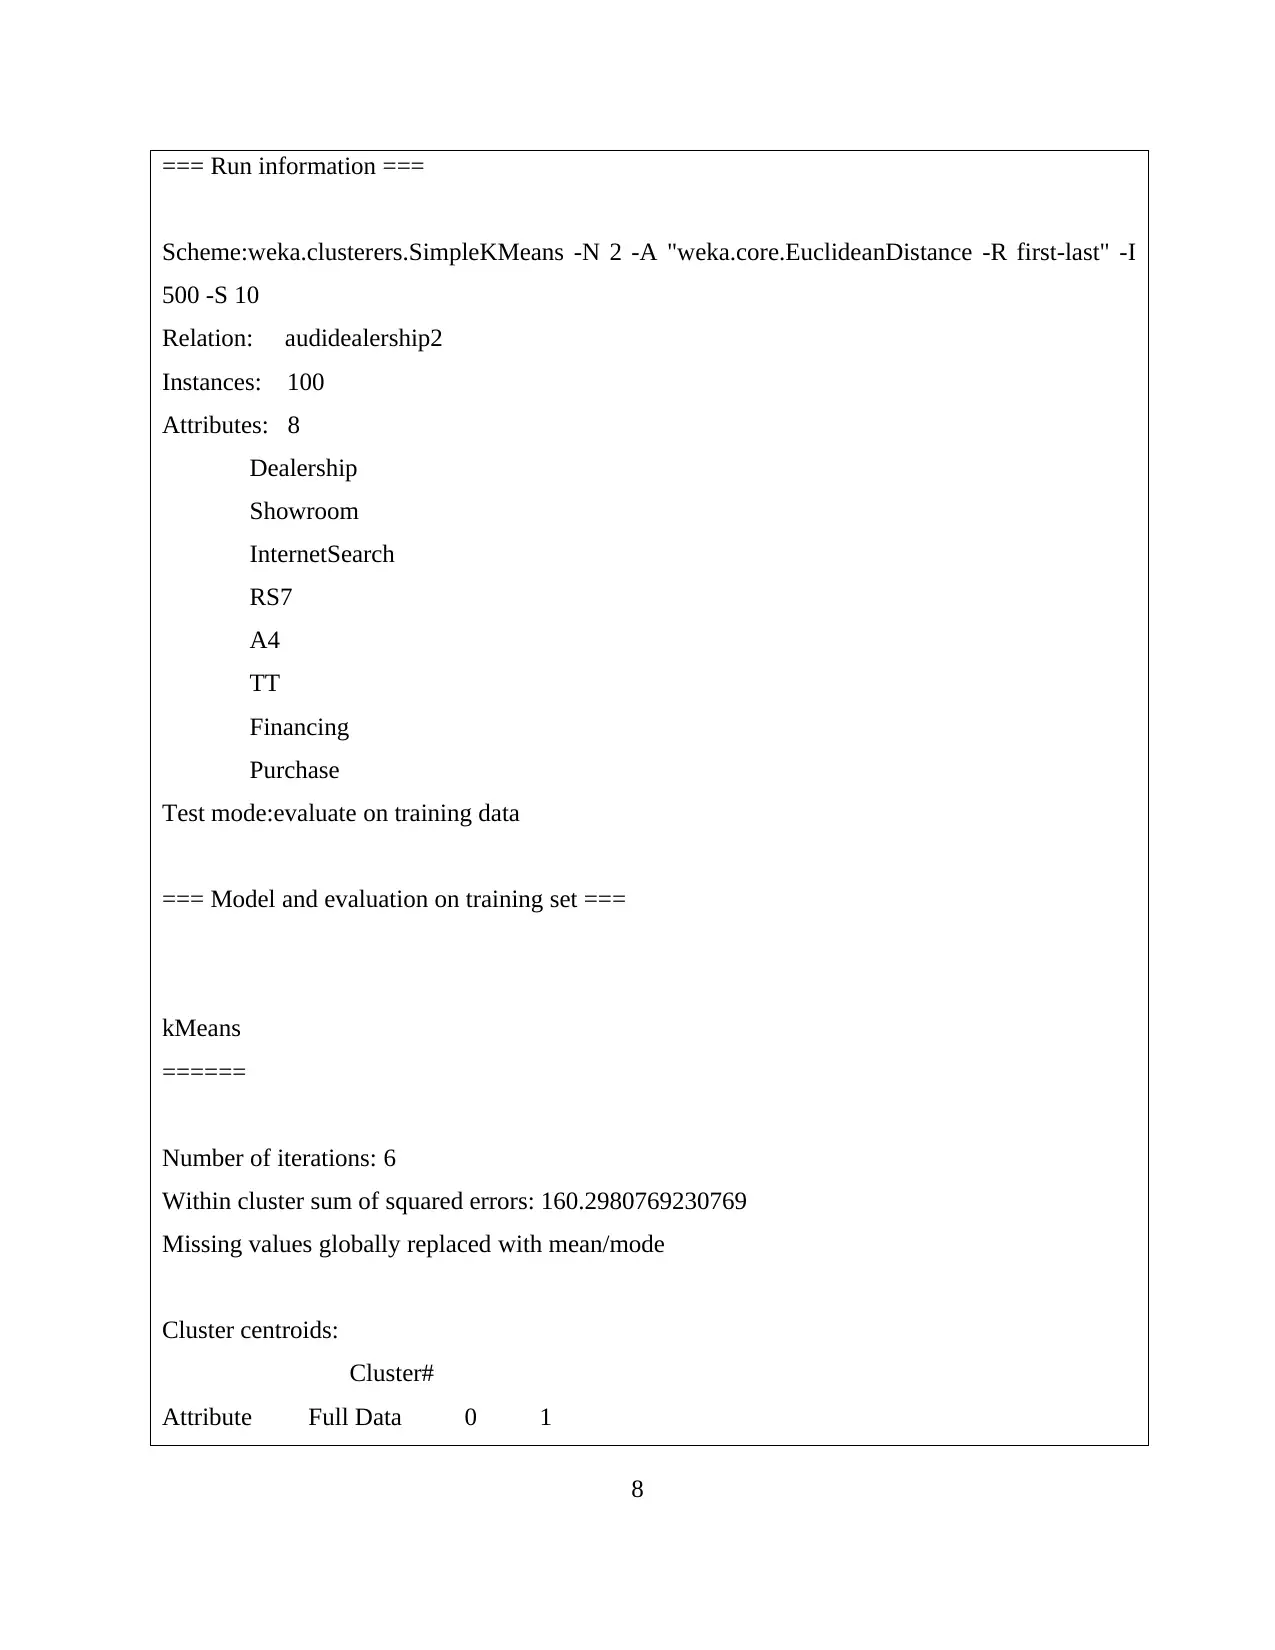
WEKA is analytic application which helps its users in the process of data mining. There
are various functions which can be conducted using WEKA and one of them is clustering
(Yuchen, 2016). For the given data set of audidealership, the method of clustering which is used
is K means clustering which requires to pre determine the numbers of clusters and as the data has
two data points such as 0 and 1, two clusters are determined. The results of WEKA are shown
below:
7
0
200
400
600
800
1000
1200
1400
Office Supplies
Technology
Furniture
Sum of
Profit Express Air
Northwest
Territories Consumer Furniture
Sum of Profit 1
Express Air 0.74897056 1
Northwest
Territories 0.55005312 0.95812629 1
Consumer 0.73593026 0.580260641 0.53173167 1
Furniture 0.70546329 0.383957397 0.29899993 0.96525964 1
From the above analysis, four reasons behind the decline of profit are identified which are
decline in the shipments using Express air, reduction of sales in Northwest territory, reduction in
sales to consumer and reduction of sales of furniture. The most influential variable among these
four is reduction in shipment through Express air and this result is gained from the correlation co
efficient.
Determining decline in sales and profit
The reason behind the reduction of sales is declining unit price of the superstore’s products
and the reason behind low profit is the reduction in usage of “Express air” as a shipment mode.
PART 2
2.1 Workings of WEKA using audidealership.csv
WEKA is analytic application which helps its users in the process of data mining. There
are various functions which can be conducted using WEKA and one of them is clustering
(Yuchen, 2016). For the given data set of audidealership, the method of clustering which is used
is K means clustering which requires to pre determine the numbers of clusters and as the data has
two data points such as 0 and 1, two clusters are determined. The results of WEKA are shown
below:
7
⊘ This is a preview!⊘
Do you want full access?
Subscribe today to unlock all pages.
Trusted by 1+ million students worldwide
=== Run information ===
Scheme:weka.clusterers.SimpleKMeans -N 2 -A "weka.core.EuclideanDistance -R first-last" -I
500 -S 10
Relation: audidealership2
Instances: 100
Attributes: 8
Dealership
Showroom
InternetSearch
RS7
A4
TT
Financing
Purchase
Test mode:evaluate on training data
=== Model and evaluation on training set ===
kMeans
======
Number of iterations: 6
Within cluster sum of squared errors: 160.2980769230769
Missing values globally replaced with mean/mode
Cluster centroids:
Cluster#
Attribute Full Data 0 1
8
Paraphrase This Document
Need a fresh take? Get an instant paraphrase of this document with our AI Paraphraser
(100) (48) (52)
=================================================
Dealership 0.54 0.3333 0.7308
Showroom 0.64 0.6667 0.6154
InternetSearch 0.39 0.4375 0.3462
RS7 0.53 0.2917 0.75
A4 0.55 0.8125 0.3077
TT 0.5 0.5833 0.4231
Financing 0.6 0.3333 0.8462
Purchase 0.38 0.0417 0.6923
Time taken to build model (full training data) : 0.02 seconds
=== Model and evaluation on training set ===
Clustered Instances
0 48 ( 48%)
1 52 ( 52%)
9
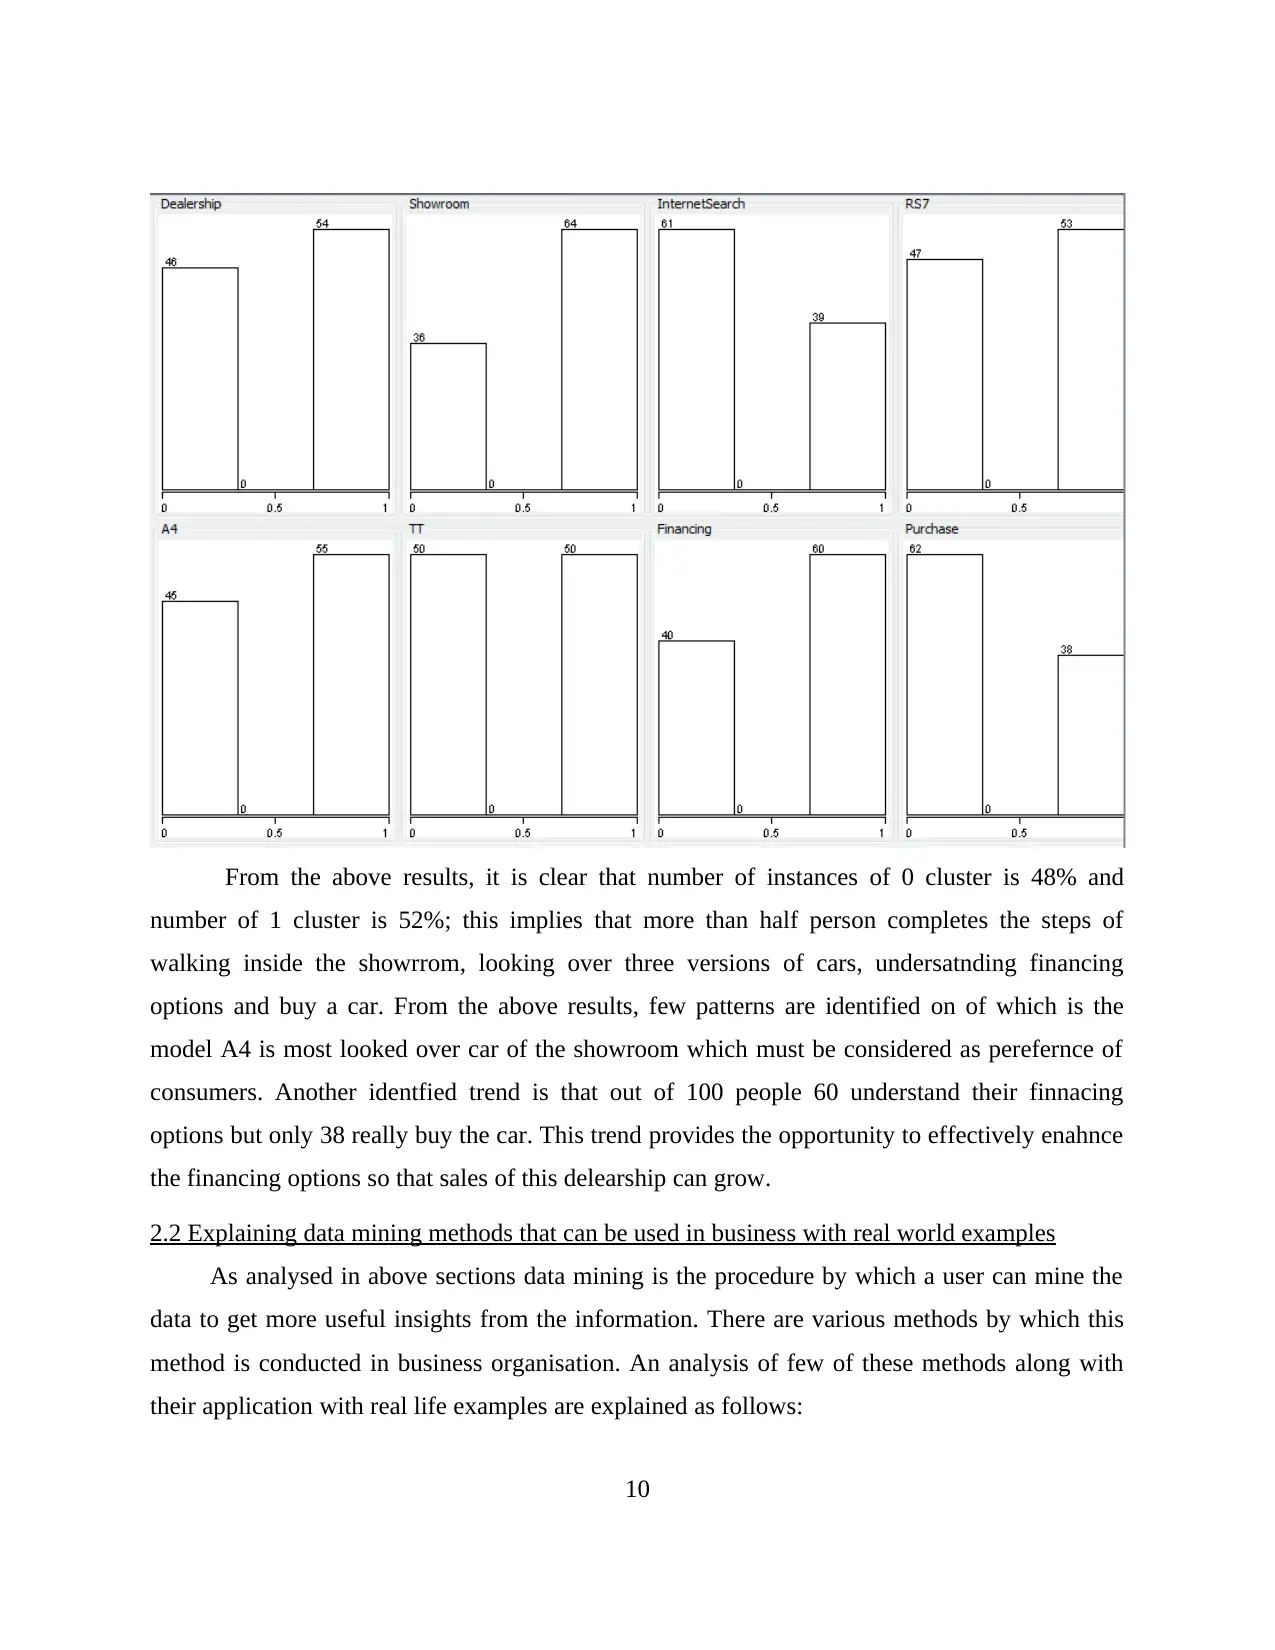
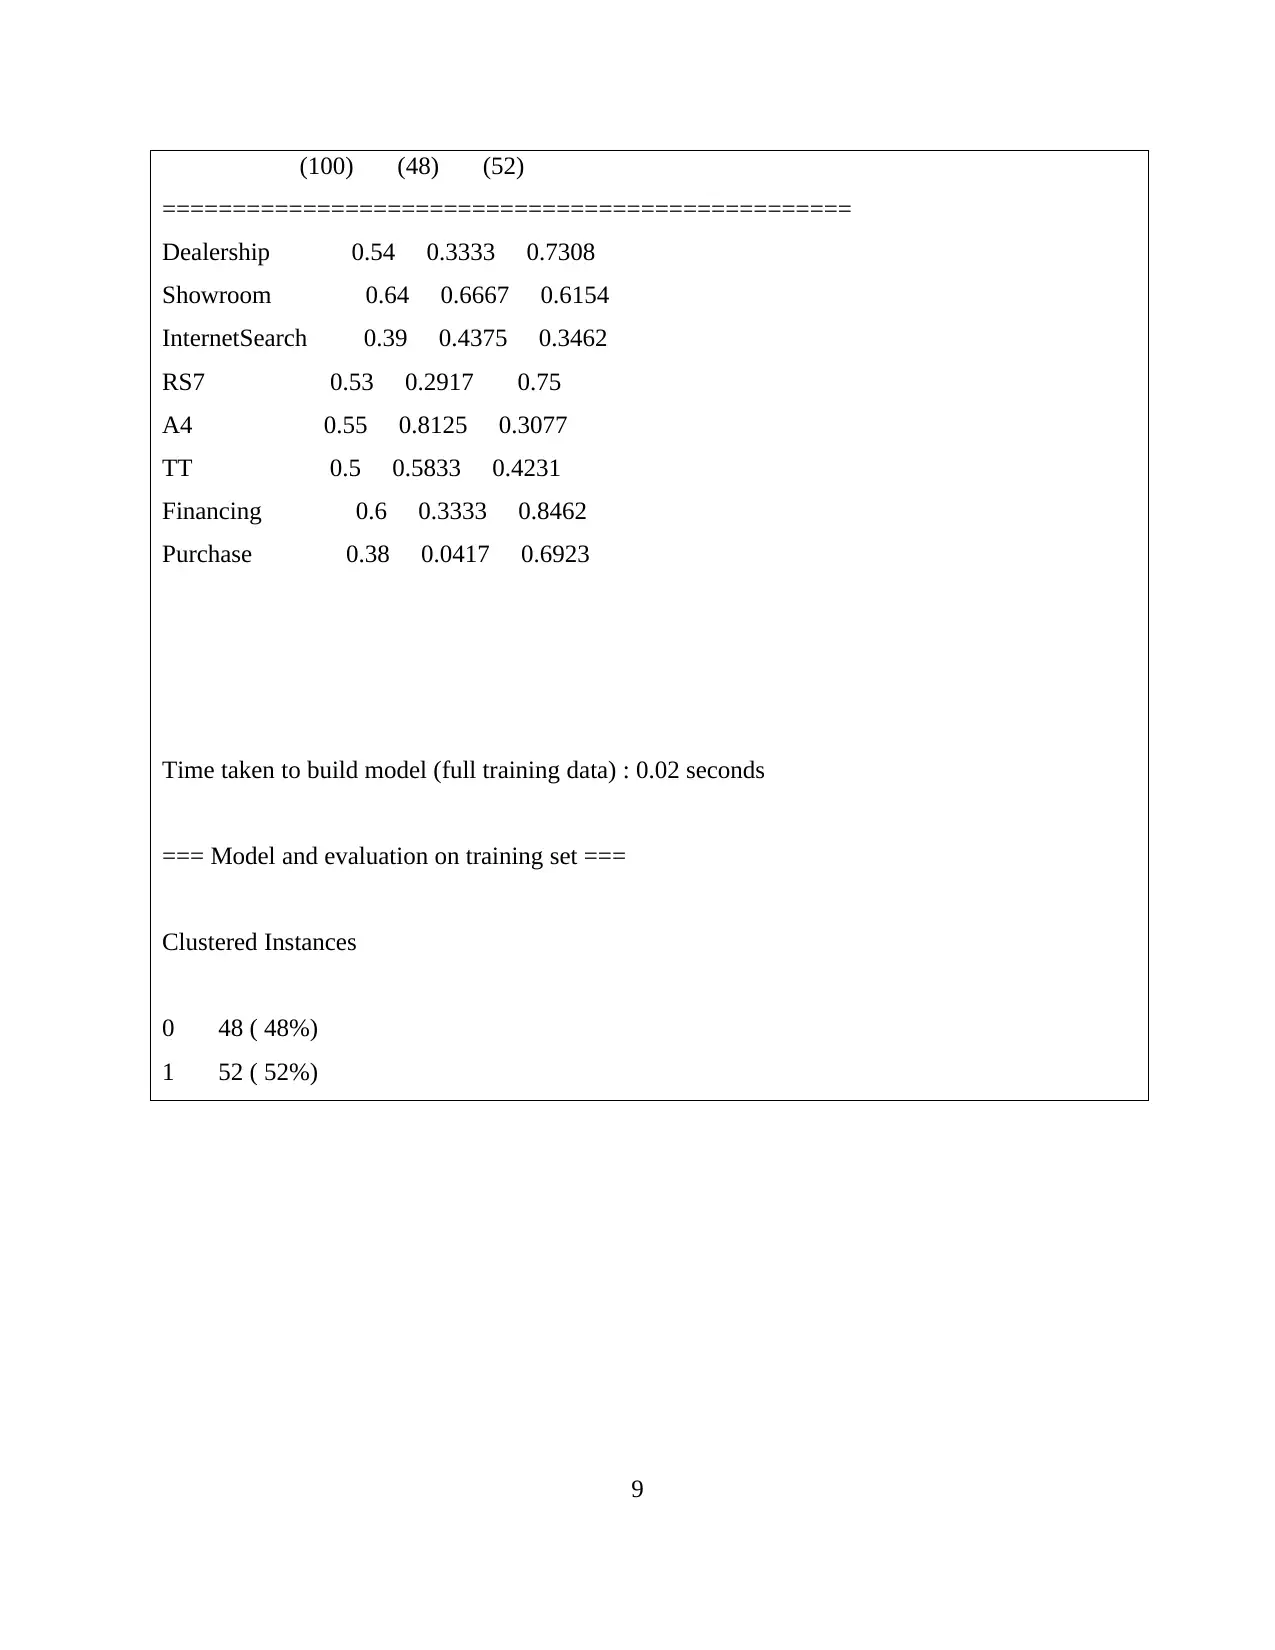
From the above results, it is clear that number of instances of 0 cluster is 48% and
number of 1 cluster is 52%; this implies that more than half person completes the steps of
walking inside the showrrom, looking over three versions of cars, undersatnding financing
options and buy a car. From the above results, few patterns are identified on of which is the
model A4 is most looked over car of the showroom which must be considered as perefernce of
consumers. Another identfied trend is that out of 100 people 60 understand their finnacing
options but only 38 really buy the car. This trend provides the opportunity to effectively enahnce
the financing options so that sales of this delearship can grow.
2.2 Explaining data mining methods that can be used in business with real world examples
As analysed in above sections data mining is the procedure by which a user can mine the
data to get more useful insights from the information. There are various methods by which this
method is conducted in business organisation. An analysis of few of these methods along with
their application with real life examples are explained as follows:
10
⊘ This is a preview!⊘
Do you want full access?
Subscribe today to unlock all pages.
Trusted by 1+ million students worldwide
1 out of 16
Related Documents


Your All-in-One AI-Powered Toolkit for Academic Success.
+13062052269
info@desklib.com
Available 24*7 on WhatsApp / Email
![[object Object]](/_next/static/media/star-bottom.7253800d.svg)
Unlock your academic potential
Copyright © 2020–2025 A2Z Services. All Rights Reserved. Developed and managed by ZUCOL.