Data Handling and Business Intelligence
VerifiedAdded on 2023/01/11
|13
|3507
|63
AI Summary
This report explores the use of Excel for data pre-processing, including IF functions, VLookup, and charts and graphs. It also discusses common data mining methods used in business with real-world examples. The report provides a comprehensive understanding of data handling and business intelligence techniques.
Contribute Materials
Your contribution can guide someone’s learning journey. Share your
documents today.

Data handling and
Business Intelligence
Business Intelligence
Secure Best Marks with AI Grader
Need help grading? Try our AI Grader for instant feedback on your assignments.
Contents
PART 1............................................................................................................................................3
1. Use of excel of pre-processing the data:.............................................................................3
1.1.1 Use of IF function in Excel:..........................................................................................5
1.1.2 VLookup:.......................................................................................................................5
1.1.3 Charts and Graphs:........................................................................................................6
PART 2............................................................................................................................................8
2.1 Using the audidealership.csv provided in conjunction with Weka give a specific example
of clustering............................................................................................................................8
2.2 Most common data mining methods which are used in business with real world examples.
................................................................................................................................................9
2.3 Advantages and disadvantages of Weka over excel.......................................................12
REEFRENCES..............................................................................................................................14
INTRODUCTION
In present time, businesses have large amount of data related to different operating
activities which is needed to be controlled and effectively managed to make useful results. Data
handling is a modern technique which support in managing and assorting of large data into
presentable group which make easy analysing and summarizing of key findings. In this report,
large data related to superstore of car is used to identify and critically evaluate the current trends
in data warehousing, business intelligence and data mining. In addition report also demonstrates
a comprehensive knowledge and systematic understanding of essential concepts and principles
by using predictive analytic software.
PART 1
1. Use of excel of pre-processing the data:
Prior to quantitative analysis, the data pre-processing comprises of a variety of measures
for converting raw database from data acquisition into a ‘safe’ and ‘tidy’ dataset. Data pre-
processing is a tool for the data mining which transforms raw data into a comprehensible format
(Pashazadeh and Navimipour, 2018).
The data are also presented in line graphs, diagrams and histograms. In Excel, we will play
with other kinds of information from different data facets. From production to small shops and
government agencies MS Excel is hardly used.
Individuals in every office realize what the key significance of the expression for this most
common program is:
1) Pivot Tables
PivotTables collects vast volumes of Excel data using a structured table where heading
for first row and Definitions or Attributes for the second row are used. The description of data is
versatile, but typically Pivot table values for some or all categories are included. Excel 2013 will
evaluate the data and propose Pivot Table for if is new to building Pivot Table. Tap on each
of cells either table in range:
How this function is working: In Pivot Table Suggested dialogue box, select one that
operates best and click OK every Pivot Table design. Excel can provide the data with a set of
suggested pivot tables. Excel after which positions, Pivot Table on new worksheet as well as
displays field list to reorganize the information to fit requirements.

2) Conditional Formatting
As name suggests, conditional layout adjusts the cell structure based on cell material, or
some cell or cells in workbook or some other. Conditional layout lets users easily concentrate on
main elements of a table or show mistakes and recognise relevant data trends.
The specified conditional formats are used for cell depending on the location one set or
on location generated by Excel by contrasting cell variables in range. For e.g., with any
compensation above a certain sum, any employee before a certain date or any individual with a
certain name, the status quo may be extended in a list of employees' salaries. The manager
enters. The salary column will have graphical conditional templates and the largest and lowest
amounts in the table will be evaluated by choice, but can also be overridden where possible.
3) Sorting and Filtering
Excel tablets help us to understand large quantities of data. You may order the details or simply
pick the data that you need, depending on the parameters you defined in MS Excel, to render it
easy to locate what you want. Order and sort the data saves time and increases the productivity of
your chart. Guess one had a list of 100 records, the dates, ages, different names, towns, and much
more. With Excel's sort and filter functionality, you can easily organize data as per user needs
(Patan and Babu, 2018).
4) Basic Math
The biggest challenges are numbers of every Excel row. One aspect that makes Excel so
efficient is the use of simple math functions which control such numbers. In Excel's formula bar,
simple measurement as it will be written down could be entered. Start the computation using the
= symbol, like all Excel equations. When one click Enter, the result emerges inside the cell or
shape bar. The equation should be placed straight onto cell or formula bar. A further option, as
can be found here (in which cell A1 (or 87) + cell A2 (or 16) is equitable to cell A3 (or 103)), is
to make multiple type cells.
5) Mixed Type Charts
The hybrid or mixed form charts blend two types of charts, including the Excel chart for the
column and the line chart for example. This layout can assist exhibit two distinct information
kinds or a wide variety of values. For instance, the no. of homes being sold during Jun to Dec.
and average monthly selling prices can be identified more easily using a line graph (Young-
Saver, and et.al., 2018).
Secure Best Marks with AI Grader
Need help grading? Try our AI Grader for instant feedback on your assignments.
1.1.1 Use of IF functions in Excel:
One should add the data using the IF feature in order that, when one has a valid state, one
outcome is retrieved and a second outcome is retrieved if the state is Incorrect. The IF feature
should be separated such that you can only use one criterion or nest while several conditions are
used to achieve TRUE or FALSE results. In this structure, one should look at date when
contracts and profitability were reduced and date when the supermarkets two contracts were
boosted (Zhou, and et.al., 2017).
• Rearranging the application date, structures and benefits on a separate sheet as a
subject of first importance.
• Actually, change the data which are first used by orchestrating the required exceedance
cap.
• Choose cell where "IF Function" is required
• Enter the code in the cell: = if
•Comma type: B2>B3,
• Enter what must show when condition has been encountered. When contents are
displayed, form inside declarations: "Reduction"
• Enter comma: Typing the code.
• If user are slightly unable to fulfil requirement in user declaration, type: "Augmentation"
• Close area and click Enter key at this stage.
• Above IF function would look such as this: = if pace or motivating factor in the cell B2 is
greater than B3, then display the decreasing and then display Increased if it's under the B3.
• One can get outcome of the cell B4 after pressing Enter key. Push handle of cell back to
cell D8400 when one need to see result.
1.1.2 VLookup:
User mainly looks for table value with this instruction. I'm going to teach you thoroughly
exactly how it operates, so let's start now. Two separate sheets A and B. Assume there are. When
one column in first sheet of other sheet should be valid for one record in both the sheets and only
then will data in the next sheet be found. For both the sheets, one data must have 1 data in
prevalent which is available in both the sheets. Even though the value is taken from Vlookup)
(and moved to the next sheet before the relation or specific details.
Syntax: =VLOOKUP(lookup_value, table_array, col_index_num, [range_lookup])

The search meaning is the meaning by which data will be scanned. Document,
numbers and dates may be used.
Demonstration of Look up work on given circumstance of Superstore Sale:
Using sheet of desires equally surpassed, the advances would be drawn:
Lookup Value: Choose cells G2, H2 and I2 for time, structure and benefit characteristics. The
observations on G3, H3 and I3 will be seen. Use cell H3 and bring Lookup to work; use Cell G3
as the Lookup Value.
Table series: Choose from the A2 to C8400 (A2:C8400) for the complete range.
[Range_ lookup]: Chosen cell has come to B2 to B8400 (B2:B8400). B2:B8400.
1.1.3 Charts and Graphs:
The Pie Graph is a representation in the Excel. The evaluation of some data is a lot of
support. By transforming this into a pie graphic, user can visualize complicated data quite
quickly. Assume you have Sensex tracked. If a certain share conducts well among top five
shares, then perhaps user can easily comprehend how much fluctuations have been noted during
any particular period of one year by comprehending performance of whole year of that share
(Birks, Lotter, Juggins and Smol, 2012).
Mixed or Combination Charts
The combined or mixed characteristics are one best in graphs. User may only connect 2 or even
more graphs to display the same diagram with only one chart.
Steps are:
Pick cell to be used to create a line chart.
Go to the insert option and then select line chart.
01/01/2009
10/03/2009
17/05/2009
24/07/2009
30/09/2009
07/12/2009
13/02/2010
22/04/2010
29/06/2010
05/09/2010
12/11/2010
19/01/2011
28/03/2011
04/06/2011
11/08/2011
18/10/2011
25/12/2011
02/03/2012
09/05/2012
16/07/2012
22/09/2012
29/11/2012
-20000
0
20000
40000
60000
80000
100000
Sales
Profit
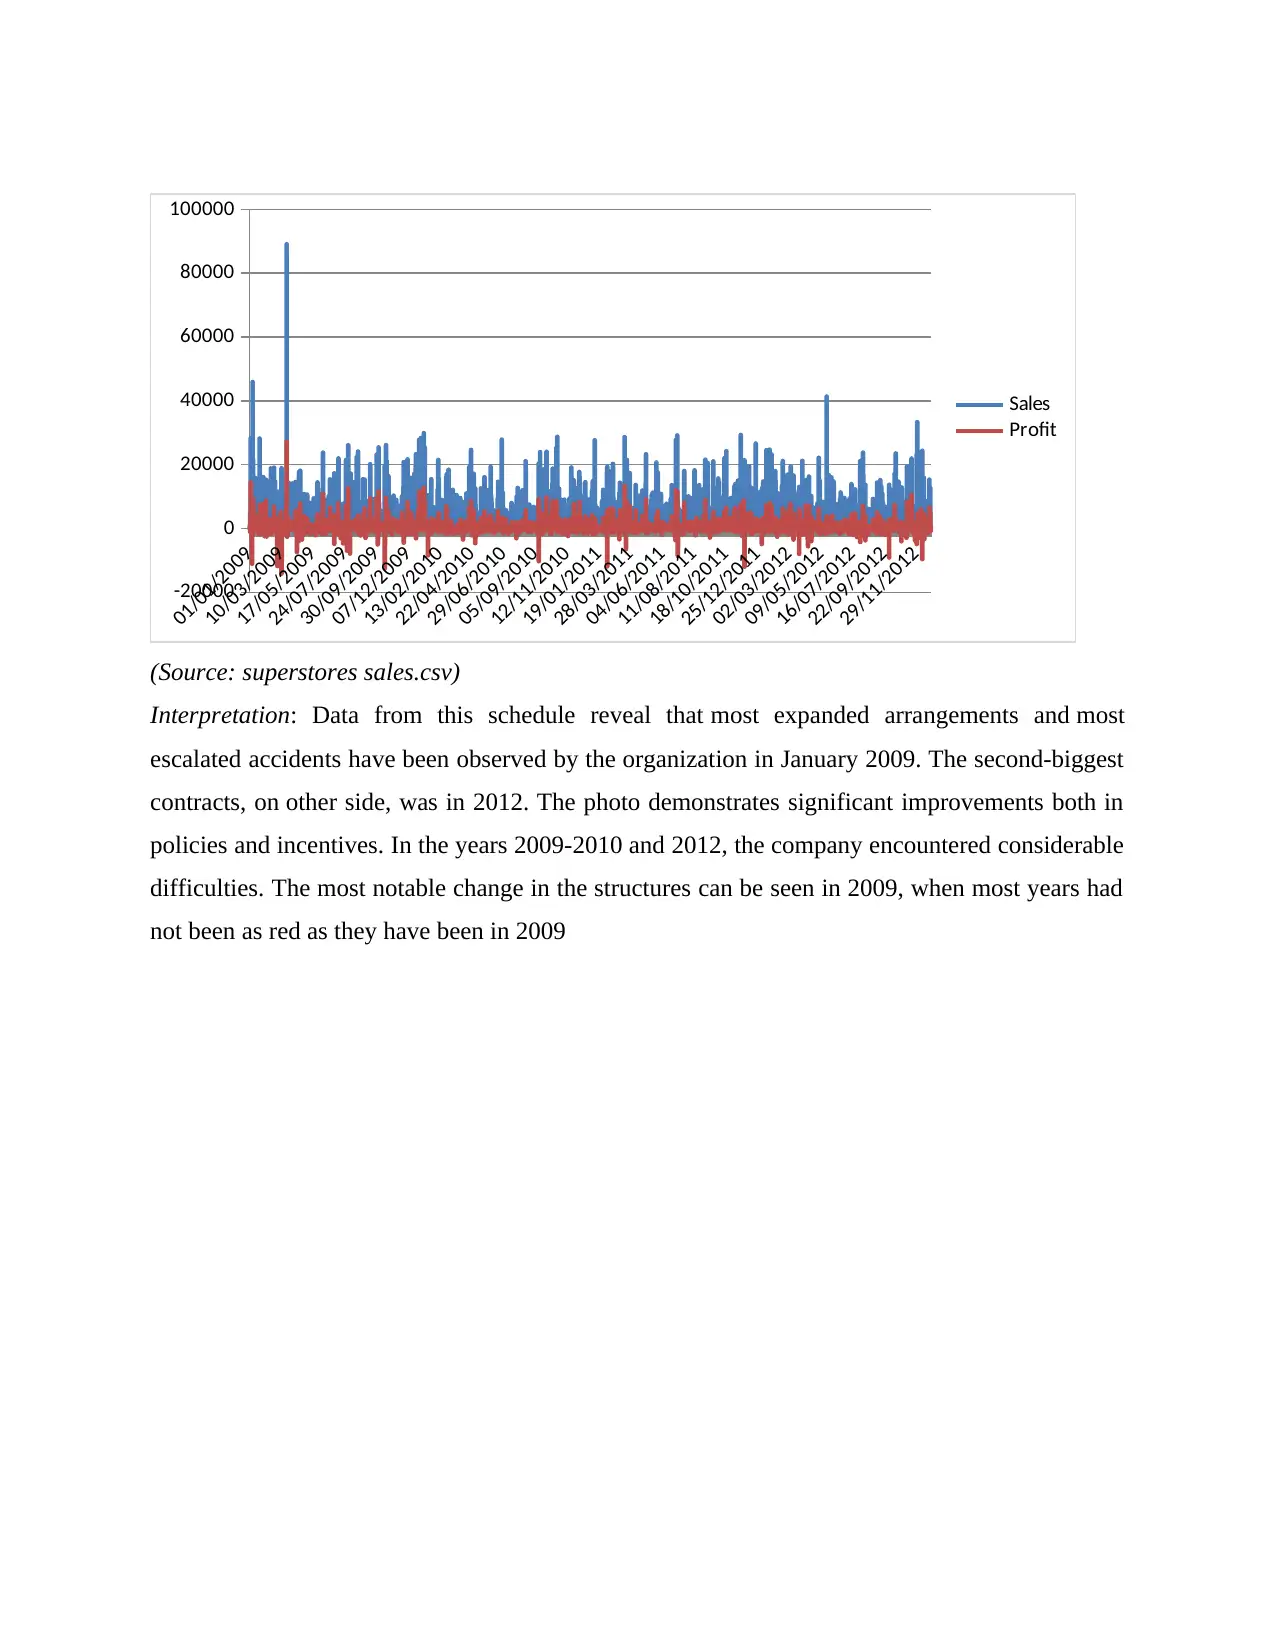
(Source: superstores sales.csv)
Interpretation: Data from this schedule reveal that most expanded arrangements and most
escalated accidents have been observed by the organization in January 2009. The second-biggest
contracts, on other side, was in 2012. The photo demonstrates significant improvements both in
policies and incentives. In the years 2009-2010 and 2012, the company encountered considerable
difficulties. The most notable change in the structures can be seen in 2009, when most years had
not been as red as they have been in 2009
10/03/2009
17/05/2009
24/07/2009
30/09/2009
07/12/2009
13/02/2010
22/04/2010
29/06/2010
05/09/2010
12/11/2010
19/01/2011
28/03/2011
04/06/2011
11/08/2011
18/10/2011
25/12/2011
02/03/2012
09/05/2012
16/07/2012
22/09/2012
29/11/2012
-20000
0
20000
40000
60000
80000
100000
Sales
Profit
(Source: superstores sales.csv)
Interpretation: Data from this schedule reveal that most expanded arrangements and most
escalated accidents have been observed by the organization in January 2009. The second-biggest
contracts, on other side, was in 2012. The photo demonstrates significant improvements both in
policies and incentives. In the years 2009-2010 and 2012, the company encountered considerable
difficulties. The most notable change in the structures can be seen in 2009, when most years had
not been as red as they have been in 2009
Paraphrase This Document
Need a fresh take? Get an instant paraphrase of this document with our AI Paraphraser
PART 2
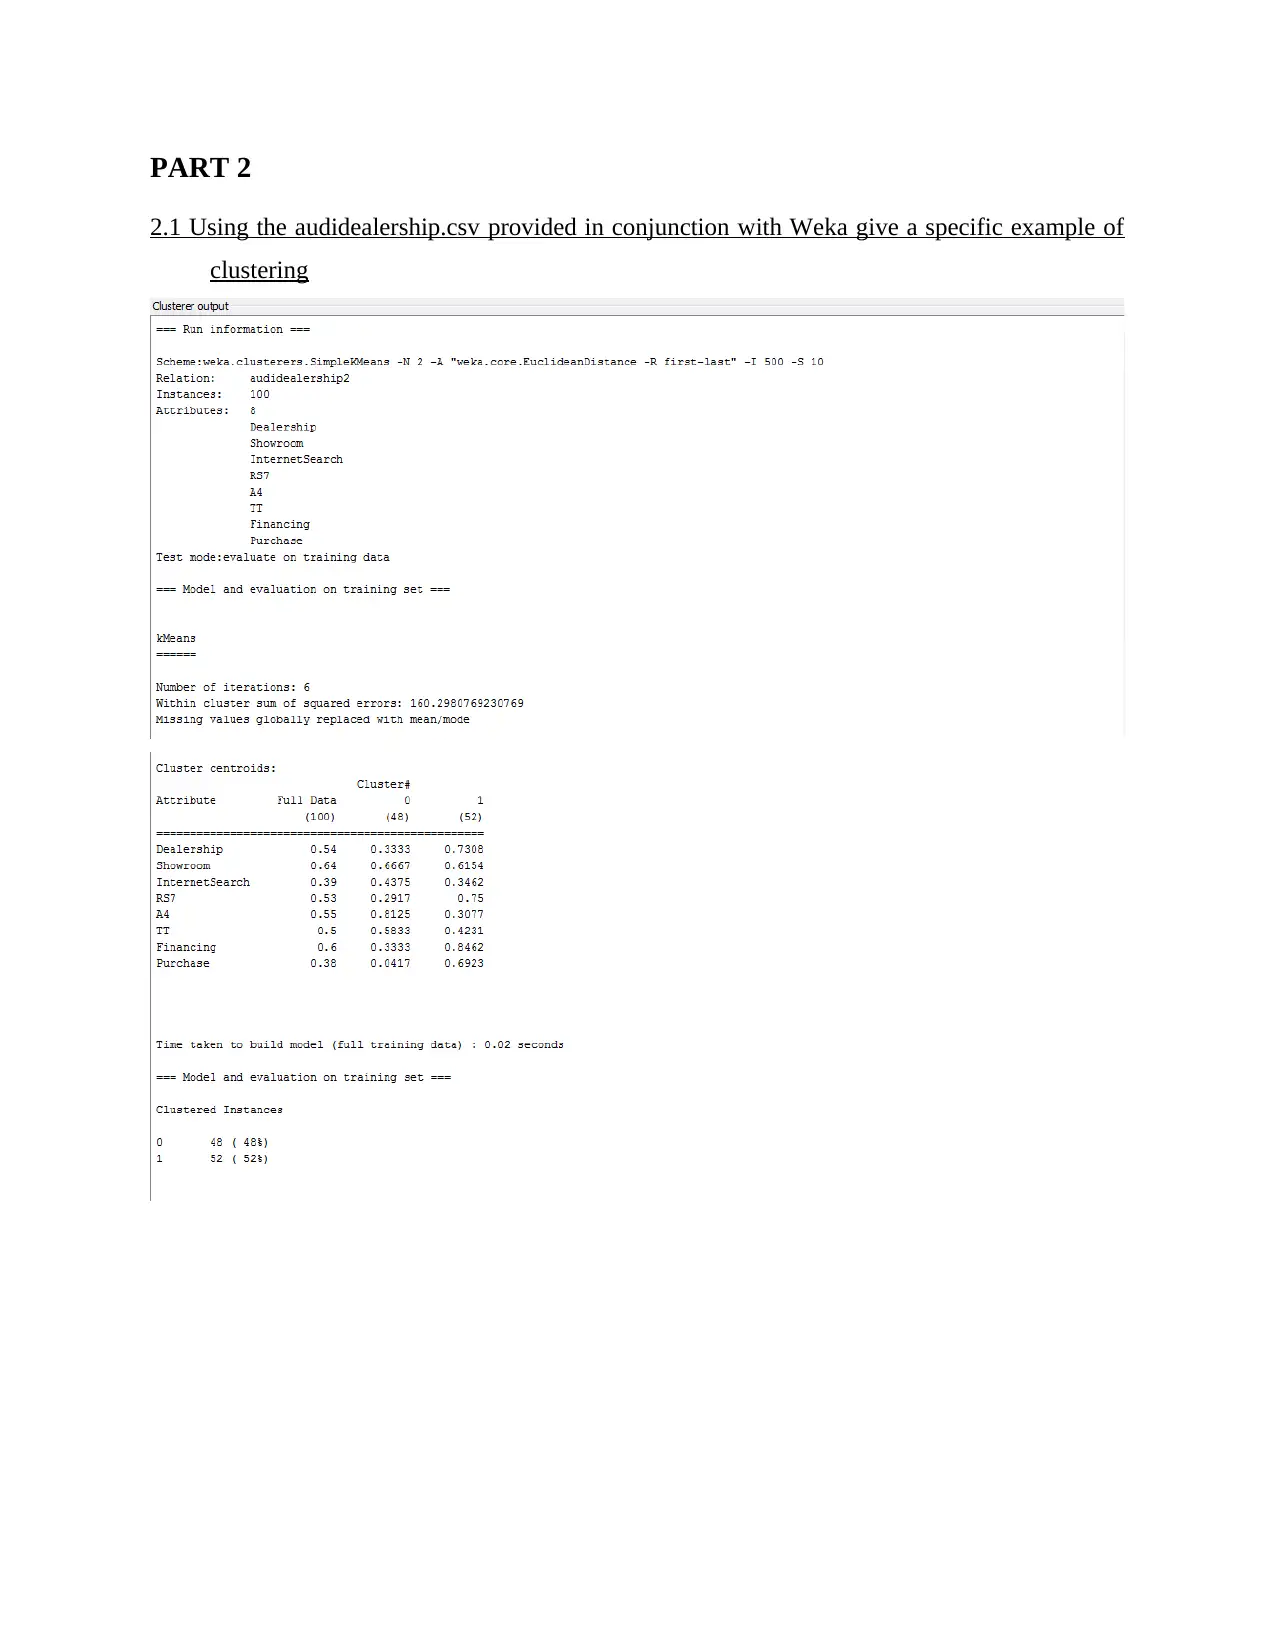
2.1 Using the audidealership.csv provided in conjunction with Weka give a specific example of
clustering
2.1 Using the audidealership.csv provided in conjunction with Weka give a specific example of
clustering
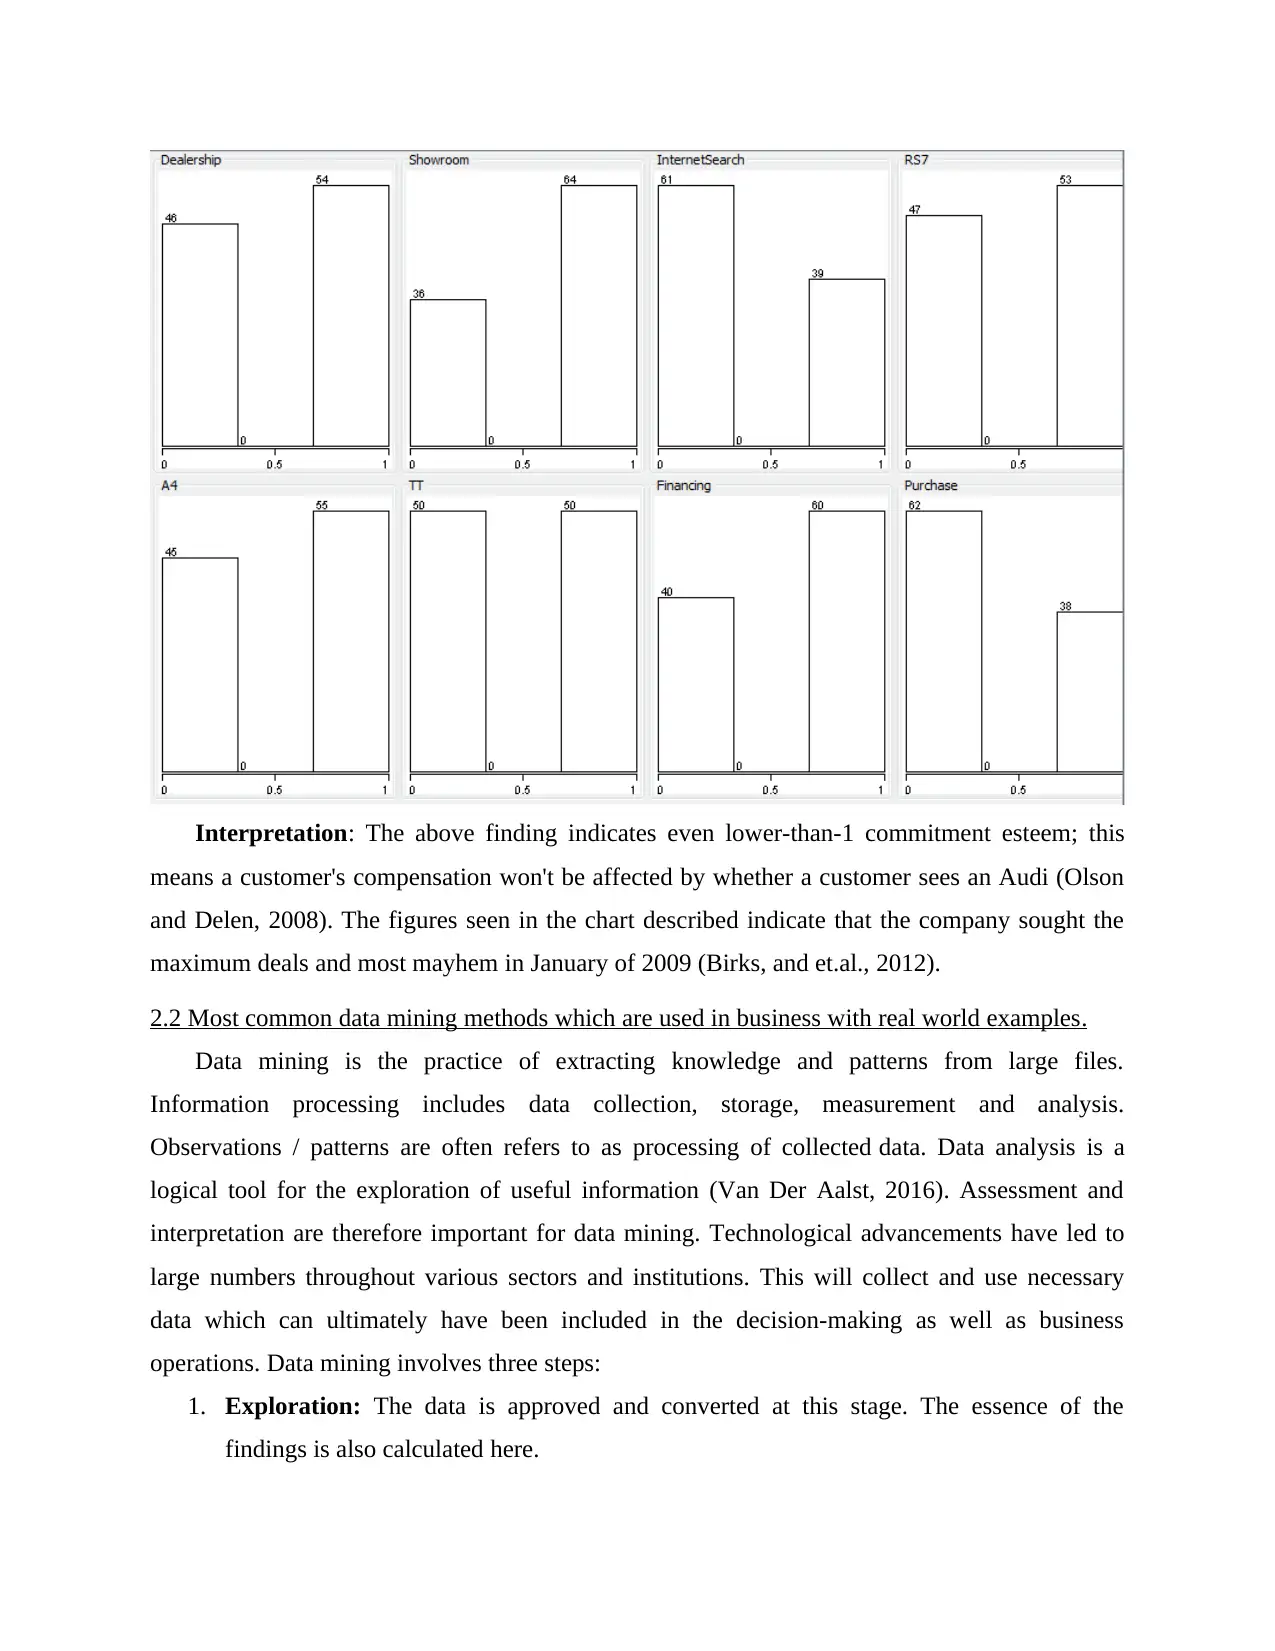
Interpretation: The above finding indicates even lower-than-1 commitment esteem; this
means a customer's compensation won't be affected by whether a customer sees an Audi (Olson
and Delen, 2008). The figures seen in the chart described indicate that the company sought the
maximum deals and most mayhem in January of 2009 (Birks, and et.al., 2012).
2.2 Most common data mining methods which are used in business with real world examples.
Data mining is the practice of extracting knowledge and patterns from large files.
Information processing includes data collection, storage, measurement and analysis.
Observations / patterns are often refers to as processing of collected data. Data analysis is a
logical tool for the exploration of useful information (Van Der Aalst, 2016). Assessment and
interpretation are therefore important for data mining. Technological advancements have led to
large numbers throughout various sectors and institutions. This will collect and use necessary
data which can ultimately have been included in the decision-making as well as business
operations. Data mining involves three steps:
1. Exploration: The data is approved and converted at this stage. The essence of the
findings is also calculated here.
2. Pattern Recognition: This is the next step is to select the framework which makes the
prediction the greatest.
3. Deployment: The existing patterns are used to achieve the required results.
Data mining technique:
Implementing the right data gathering techniques is among the most critical practices in the
industry. The Data gathering platform must be picked by the firm's competitiveness and issue
type (Gabrio, Mason and Baio, 2017). A standardized methodology should be used to increasing
the precision and cost-efficiency of application. This article deals with seven main data mining
strategies:
Statistical Methods: At specific time the mathematical world confronts the same major
challenge as data analytics: how to create accurate conclusions from inadequate earth-
consciousness. The most important method to data is a brief and clear description for the
connection between results and conclusions. The text implements the same protocol and
discusses a number of fundamental problems emerging from scientific data: hypothesis control,
trust estimation and ambiguous numeral measurement. Data mining is a process collecting
statistical results and explaining them.
1. What is pattern in the data network?
2. How often times could this happen?
3. What were the major business patterns?
4. How much a high-level overview of what the paper contains?
Clustering techniques: Clustering is among the main data mining strategies. Clustering is
really the process through which information is similarly clustered (Aditsania and Saonard,
2017). It offers an overview of inconsistencies between studies and their relations. This is also
referred to as optimization and helps users define the database operations. For instance, life
insurance companies can recognize their clients by employment, age and healthcare as well as
claim form. There are many options available on the cluster:
1. Methods for separation
2. Hierarchical agglomerative approaches
3. Methods basing on density
4. Tools Grid based
5. System based models
Secure Best Marks with AI Grader
Need help grading? Try our AI Grader for instant feedback on your assignments.
Tree Methodology for Induction Decision: A decision tree is an isolated device, and its
opinion means tree. Throughout this approach, each tree branch is often used as an identification
problem, as well as the tree shells are known for their divisions in the dataset. This method may
be used to simulate exploratory simulations and to pre-process. For a particular purpose, the
decision tree can be seen as a relatively small number of the initial dataset. The data in the
segment indicates certain gaps in predicting their outcomes. Decision trees give easy outcomes
for the user to comprehend.
Neural networks: Neural networks are yet another essential method principally employed
by human beings. This method is popular in early data collection (Sun, Chen, & Zhou, 2017).
Neural networks are user-friendly since they are conditioned and developers need not be
convinced of the scientific knowledge or software. An organization of machine learning
developed the Neural Network. Nonetheless, in order to operate effectively in machine learning,
users need to know:
1. How does it connect nodes?
2. How many processing units will there be?
3. By the time the teaching stops?
Strategy of Association Rule: The connection is established among two or even more
symbols. Also important is the connection between different variables in the computer system.
The proof for the grouping of factors and the persistent occurrence of multiple stimuli of the
same amounts is found in the underground pattern archive.
2.3 Advantages and disadvantages of Weka over excel
This information processing method is used to discern information items that don't adhere
to standard example or planned behaviour. Certain unexpected items about knowledge are
viewed as anomalies or commotion. These are effective in other areas, such as detection of
charging card misstatement, place of disruption, recognition of shortcomings etc. For example,
assume that the diagram below is plotted using in our server a few knowledge indexes. Thus, it
draws the best match side.
Advantage
Weka is a research scientist in the field of linux code extraction. It will not only assist
to measure the AI but will also enable the strength of understanding and meta-students (Park and
Snyder, 2018). The package contains three apps: a unix operating system and an Adventurer GUI
(that enables user to examine and determine and perception a small data set of GUIs and
prototypes). Using a package such as Weka is definitely compelling as of refraction collection
and calculation is part of the big number of specifics. This makes for very simple access to image
submissions and uploading procedures, as only one position is needed. There is also a software
kit available to ease their use in order to make maximum results.
Disadvantages
In certain methods, such as community evaluation, it is much less efficient: in this situation
only the principal procedures are provided. When working with massive quantities of data,
WEKA may have processing issues, because the data mining tool attempts to load them all up in
RAM. So the simple task scheduler (CLI) offers a work around that helps you to properly handle
vast volumes of data (Read and et.al., 2016).
CONCLUSION
In the end of report, it has been founded massive data can easily be categorise and assemble
into smaller groups with the help of data handling techniques such as Lookups, Pivot table etc.
This enables the user to make the sound results and discover areas which needs proper focus as it
can create problems in future. Weka is a series of algorithms for computer vision to explore data.
The techniques can be implemented to a dataset either specifically to a large volume of data
making quick and required results. Weka includes resources to pre-process, detect, regress,
cluster, connect rules and visualize results.

REEFRENCES
Books and Journals
Pashazadeh, A. and Navimipour, N. J., 2018. Big data handling mechanisms in the healthcare
applications: A comprehensive and systematic literature review. Journal of biomedical
informatics, 82, pp.47-62.
Patan, R. and Babu, M. R., 2018. A novel performance aware real-time data handling for big
data platforms on Lambda architecture. International Journal of Computer Aided
Engineering and Technology, 10(4), pp.418-430.
Young-Saver, D. F., and et.al., 2018. Handling of missing outcome data in acute stroke trials:
advantages of multiple imputation using baseline and postbaseline variables. Journal of
Stroke and Cerebrovascular Diseases, 27(12), pp.3662-3669.
Zhou, C., and et.al., 2017. Spatial Data Handling in Big Data Era. Springer.
Birks, H. J. B., and et,al., Tracking environmental change using lake sediments: data handling
and numerical techniques (Vol. 5). Springer Science & Business Media.
Van Der Aalst, W., 2016. Data science in action. In Process mining (pp. 3-23). Springer, Berlin,
Heidelberg.
Fisher, P. F. ed., 2006. Developments in Spatial Data Handling: 11th International Symposium
on Spatial Data Handling. Springer Science & Business Media.
Linoff, G. S. and Berry, M. J., 2011. Data mining techniques: for marketing, sales, and customer
relationship management. John Wiley & Sons.
Niglas, K., 2007. Media Review: Microsoft Office Excel Spreadsheet Software. Journal of
Mixed Methods Research, 1(3), pp.297-299.
Olson, D. L. and Delen, D., 2008. Advanced data mining techniques. Springer Science &
Business Media.
1 out of 13
Related Documents


Your All-in-One AI-Powered Toolkit for Academic Success.
+13062052269
info@desklib.com
Available 24*7 on WhatsApp / Email
![[object Object]](/_next/static/media/star-bottom.7253800d.svg)
Unlock your academic potential
© 2024 | Zucol Services PVT LTD | All rights reserved.