Data Handling and Decision Making Report: Robert Bosch GmbH Analysis
VerifiedAdded on 2023/01/13
|30
|6004
|43
Report
AI Summary
This report provides a comprehensive data analysis of Robert Bosch GmbH, focusing on data handling and its impact on decision-making. The analysis begins with an introduction to data handling and its importance, followed by an examination of Bosch's financial statements, including the balance sheet, income statement, and cash flow statement. The report explores data protection requirements, ethical considerations, and the role of stakeholders in data analysis. It also delves into the application of big data, strategic decision-making, and the impact of financial and non-financial data on business performance. The report includes data cleaning and preparation, along with an assessment of sample effectiveness and multicollinearity. Descriptive data analysis, including PBT and financial income/expenses, is presented, along with a forecast report and justification of the model. The interpretation of results, recommendations, and the application of a big data framework conclude the analysis, providing a thorough overview of data-driven decision-making at Bosch.
Data Handling and Decision
Making
Making
Paraphrase This Document
Need a fresh take? Get an instant paraphrase of this document with our AI Paraphraser
Table of Contents
INTRODUCTION...........................................................................................................................3
TASK 1............................................................................................................................................3
TASK 2............................................................................................................................................4
TASK 3............................................................................................................................................5
Task 4...............................................................................................................................................6
Business related information dataset presents.............................................................................6
Data cleaning and preparation.....................................................................................................6
Sample effectiveness...................................................................................................................7
Task 5...............................................................................................................................................7
Multicollinearity and descriptive data analysis...........................................................................7
PBT and financial income and expenses...........................................................................7
Forecast report...............................................................................................................................13
Table (1) Sales revenue COGS.................................................................................................13
Table (2) Sales revenue and Administrative expenses.............................................................14
Table (3) Sales revenue and R&D............................................................................................15
Table (4) Sales revenue and operating expenses.......................................................................16
Table (5) PBT and financial income.........................................................................................17
Table (6) PBT and financial expenses......................................................................................18
Justification of model................................................................................................................19
TASK 6..........................................................................................................................................19
Interpretation of results.............................................................................................................19
TASK 7..........................................................................................................................................27
Recommendation .....................................................................................................................27
Big data framework...................................................................................................................28
CONCLUSION..............................................................................................................................28
REFERENCES..............................................................................................................................29
INTRODUCTION
Data handling is referred to as an effective procedure which helps in ensuring that the
data researched is appropriately stored and disposed in the most secured manner (Luh, 2018).
Data is referred to as the numerical facts and figures who in turn tends to focus on protecting the
set information in an electronic and non- electronic mean. This study will highlight on the key
sources of the data collected, data protection requirements, major strategic decision making,
business related information, data mining and interpretations of the results and lastly effective
recommendation for the decision-making procedure.
Robert Bosch GmbH is one of the leading private company which was founded in the
year 1886 by Robert Bosh. This company is headquartered in the Gerlingen, Germany. This
company mainly deals in various range of products and services such as power tool, engineering,
home appliances, cloud computing, electronics, internet of things, automotive parts, security
system, etc.
TASK 1
The financial statements used by the Bosh company to make an appropriate decision
making mainly comprise balance sheet, statement of cash flow, statement of shareholder's equity
and income statement. Balance sheet in turn helps n providing a snapshot of the entity for the
specific period. On the other hand, income statement of the company in turn focuses on
effectively determining the capability of the company to generate high degree of profits. Cash
flow statement is crucial in the decision making procedure because it helps in effectively
determining the inflow ad outflow of the cash for the specific organization. As per the income
statement, the sales revenue of the company has been increasing from the year 2014 at 48951 to
78465 in the year 2018. But on the other hand the financial expenses of the company is also
increasing from 1769 in 2014 to 2391 ion 2018. This in turn leads to slower growth rate for the
Bosh company. Non – financial data associated with the environmental impacts, social
responsibility, relationship with vendors, etc. in turn is considered to be an effective measure for
appropriate decision making.
Data integrity is referred to as the completeness, accuracy and consistency of the data for
the specific time duration. The data presented in the financial and non financial statements tends
to have data integrity (Lavreniuk and et.al., 2016). Identification of the gap within the data
analysis in turn helps in recognition of the current state by electively measuring the money,
⊘ This is a preview!⊘
Do you want full access?
Subscribe today to unlock all pages.
Trusted by 1+ million students worldwide
labour and time in order to compare with the current market states of the Bosh company. The
financial data presented in the reports tends to assess that, the profit and growth of the company
has been increasing but in turn there seems to be a decreasing trend of growth in the Bosh
company.
Data source in turn is considered to be a digitalized information which in turn is useful in
streamlining the various set of data services across the internet. The key sources of the data for
the financial sources in turn mainly keeps all the important information with database
management system. This in turn helps in protecting the right information within prescribed time
frame. File data sources, machine data sources, etc. in turn is considered to be one of the most
appropriate tool in order to protect the data which in turn eventually leads to better decision
making (Konstantopoulos and Pantziou, 2018). Modern analytic, Internet of things and big data
are considered to be one of the key sources which in turn is considered to be very useful in
collection of data for better decision making. This in turn eventually leads to higher operational
growth and efficiency of the business.
TASK 2
Data protection in turn is referred to as the ethical issue because it tends to focus on
respecting the individual rights associated with the use of information and privacy (Prince, Vonn
and Gill, 2018). Stakeholders of the company tends to require financial position in order to gain
idea associated with the tactical and strategical plans of management. The board of directors of
the company tends to review the various ratios and financial and non- financial statements of the
company. Shareholders of the company are interested in income statement, balance sheet and
profitability ratios of the company in order to assess the return on the investment made within the
company (Financial Statements and Stakeholders, 2017). Operating profit margin is necessary for
effectively measuring the performance of the business. The trade creditors and suppliers of the
company tends to evaluate the cash flow, balance sheet and liquidity ratios of the company.
Other non- financial reports such as competitive reports, budgetary reports, etc. in turn are
considered to be an effective reports and statements which in turn is useful in improving the risk
management. Governance report, notes of the financial statements, etc., are considered to be an
effective report in order to improve the decision making capability within the organisation.
In order to ensure data integrity within the organization, Bosch must in turn focus on
cleaning and effectively maintaining the various range of data sets within the organization.
Paraphrase This Document
Need a fresh take? Get an instant paraphrase of this document with our AI Paraphraser
Automation, validation of the data, updating the data on the continuous basis in turn helps in
assessing the various sets of data within the specific organization. Giving proper training to the
employees and giving them liability in turn helps the Bosch company in improving the data
integrity of the business. Updating data on the continuous and regular basis in turn helps in the
Bosch company in improving the data integrity of the business. Automation of the task and
automating the data entry helps in saving more time. This helps management to focus on more
complex task.
The General data protection regulation in turn tends to focus on effectively analysing the
various support services in order to embrace compliance and effectively overhauls the way an
organization protects its personal data. Protection of financial and personal data in turn is
considered to be one of the ethical requirement to ethically carry out several business activities.
Meeting all the ethical standards and assurance engagement in turn is considered to be one of the
major requirement while protecting the data within the organization.
TASK 3
The Bosch company can use big data to enhance the quality of carrying organization
activities. Big data in turn is considered to be one of the effective field which in turn is useful in
analysing and systematically extracting information from large complex data. Big data in turn is
considered to be very useful in systematically extracting large set of complex information which
in turn tends to inundate business on the day top day basis. Big data in turn is referred to as the
wide set of the information that in turn tends to grow at a very increasing rate (Higgins and et.al.,
2019). Current financial and and non- financial information are effectively used by
systematically analysing the set data with the help of various financial models.
The key strategic decision of the Bosh is to lower their financial expenses in order to gain
higher growth in the current financial year. The company also tends to focus on delivering
innovation and also improve the quality of life across the globe. This in turn eventually leads to
long term growth and sustainability for the Bosch company. The diversification strategy of the
Bosh in turn is considered to be as one of the most effective strategy in order to sustain in the
competitive market. Bosch company must in turn also focus on reducing its financial expenses
and cost reduction. This in turn helps in attaining economies of scale and growth of the company
over the years. Another effective strategy associated with the Bosch is to focus on the research
and development (Yuniarti and et.al., 2017, October). These strategies in turn is considered to be
one of the most appropriate which in turn helps in gaining competitive advantage and is also
useful in the improvement of the performance.
The Bosch company must focus on increasing the research and development expenditure of the
company in order to perform effective functions within the organization. Increase in the cost of
the creaser and expenditure will in turn results in effectively carrying several business
operations. The research and development expenditure of Bosch has been increasing over the
years from 3889 in 2008 to 7264 in 2017. On the other hand, the research and development
expenditure has in turn fallen down to 5963 million euros in the year 2018. The lower research
and development expenditure in turn tends to result in lower growth for the company (__-).
High degree of R&D expenditure in turn leads higher sustainable growth within the business
operations.
Task 4
Business related information dataset presents
Dataset presents business revenue, PBT and expenditures it made in its business. By
analysing dataset areas where firm need to work will be clearly identified and pin points will be
identified. In category of expenditure varied items are included like COGS, Distribution and
administrative cost, R&D Cost, Other operating expenses and Financial expenses.
Data cleaning and preparation
As can be seen that data is related to company financial performance and due to this
reason, no efforts are made for its preparation as it is already available in the Bosch annual report
in the final format. Data cleaning is done and no outliers are identified because every year
performance get changed slightly and due to this reason, no changes are made to the raw data. It
is very important to do data cleaning because in the data there are number of fluctuations that are
observed. These fluctuations are occasional in nature and observed only few times. In other
words, it can be said that these fluctuations do not represent actual behaviour of the variable.
Hence, it is very important to remove these data points from the variable so that more actual
picture of the variable can be seen about the variable by the analyst. Hence, in the analytics
analyst before using data for regression purpose clean it. Under this, spikes that are observed in
the data set are completely removed. In this regard varied approaches can be used and use of box
plot chart is one of them. In this chart quartiles are plotted and outliers can be easily seen in the
⊘ This is a preview!⊘
Do you want full access?
Subscribe today to unlock all pages.
Trusted by 1+ million students worldwide
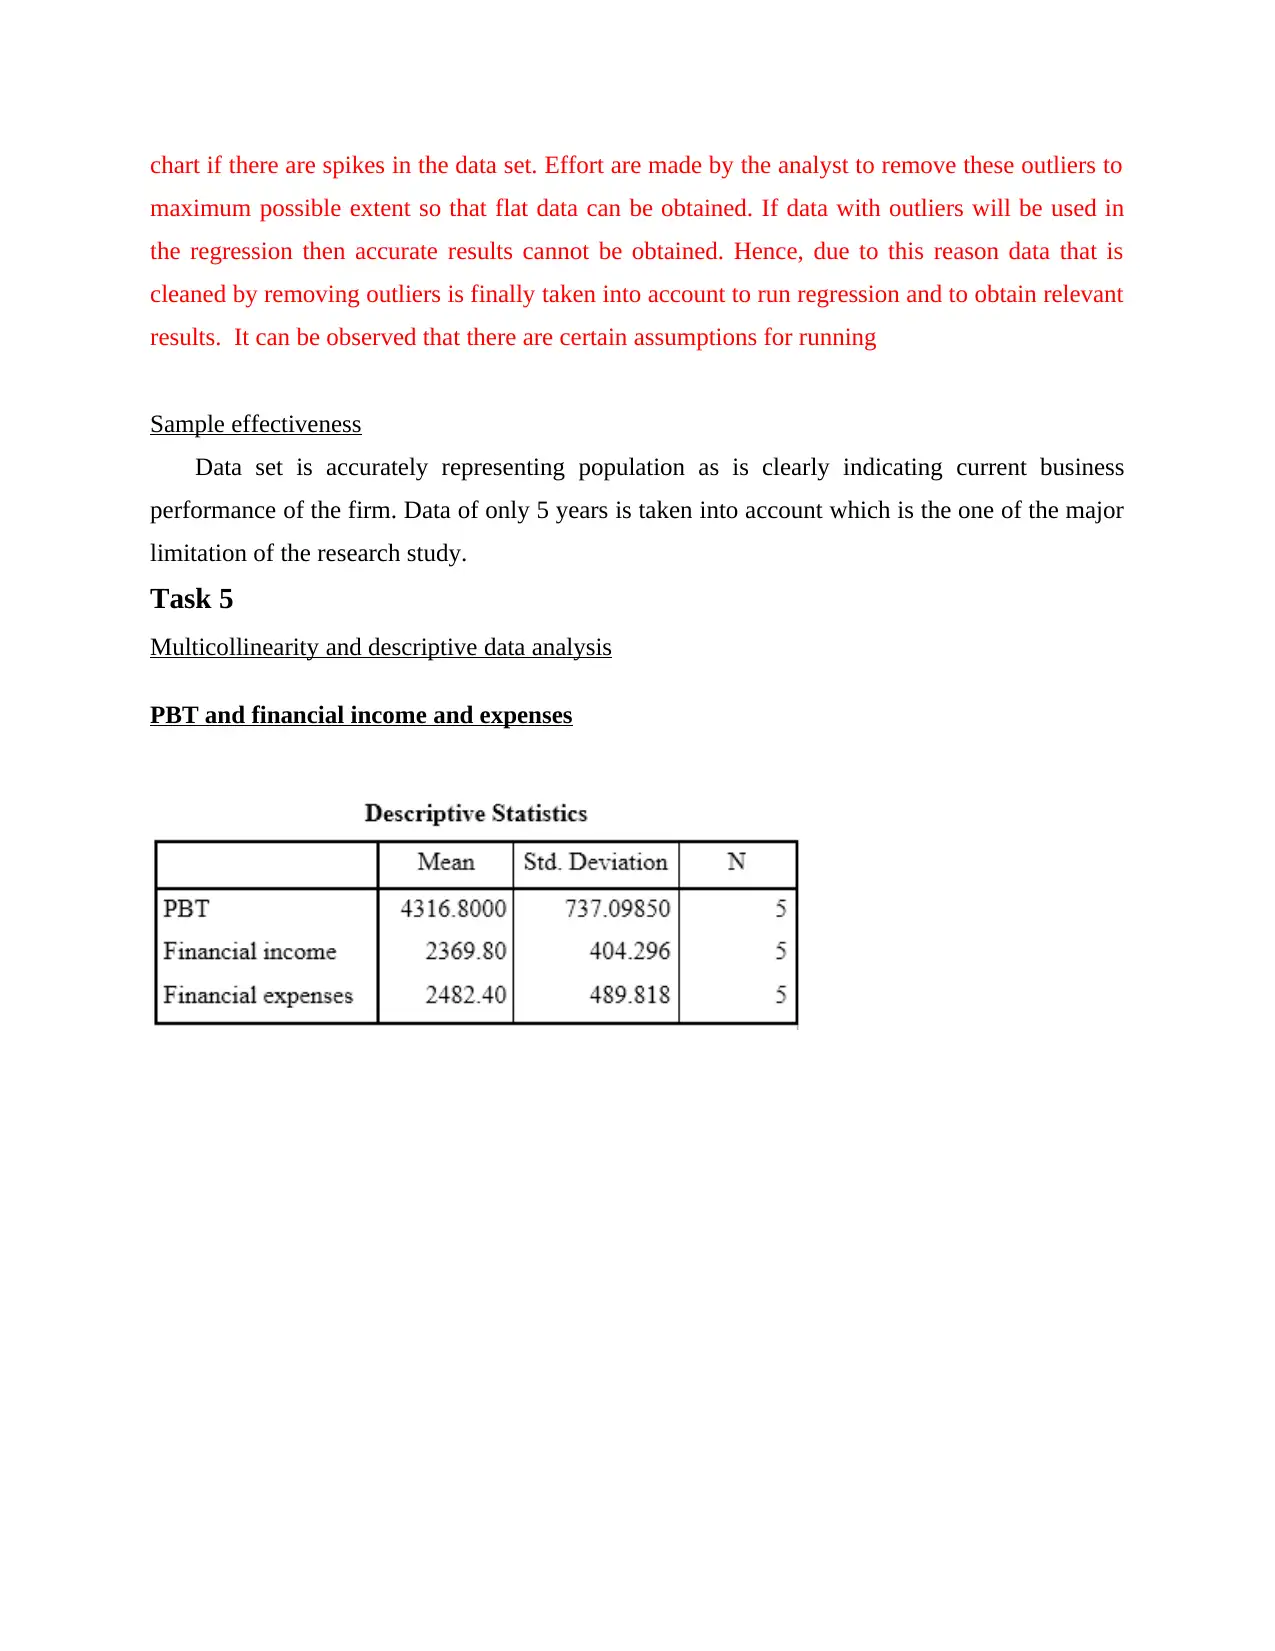
chart if there are spikes in the data set. Effort are made by the analyst to remove these outliers to
maximum possible extent so that flat data can be obtained. If data with outliers will be used in
the regression then accurate results cannot be obtained. Hence, due to this reason data that is
cleaned by removing outliers is finally taken into account to run regression and to obtain relevant
results. It can be observed that there are certain assumptions for running
Sample effectiveness
Data set is accurately representing population as is clearly indicating current business
performance of the firm. Data of only 5 years is taken into account which is the one of the major
limitation of the research study.
Task 5
Multicollinearity and descriptive data analysis
PBT and financial income and expenses
Paraphrase This Document
Need a fresh take? Get an instant paraphrase of this document with our AI Paraphraser
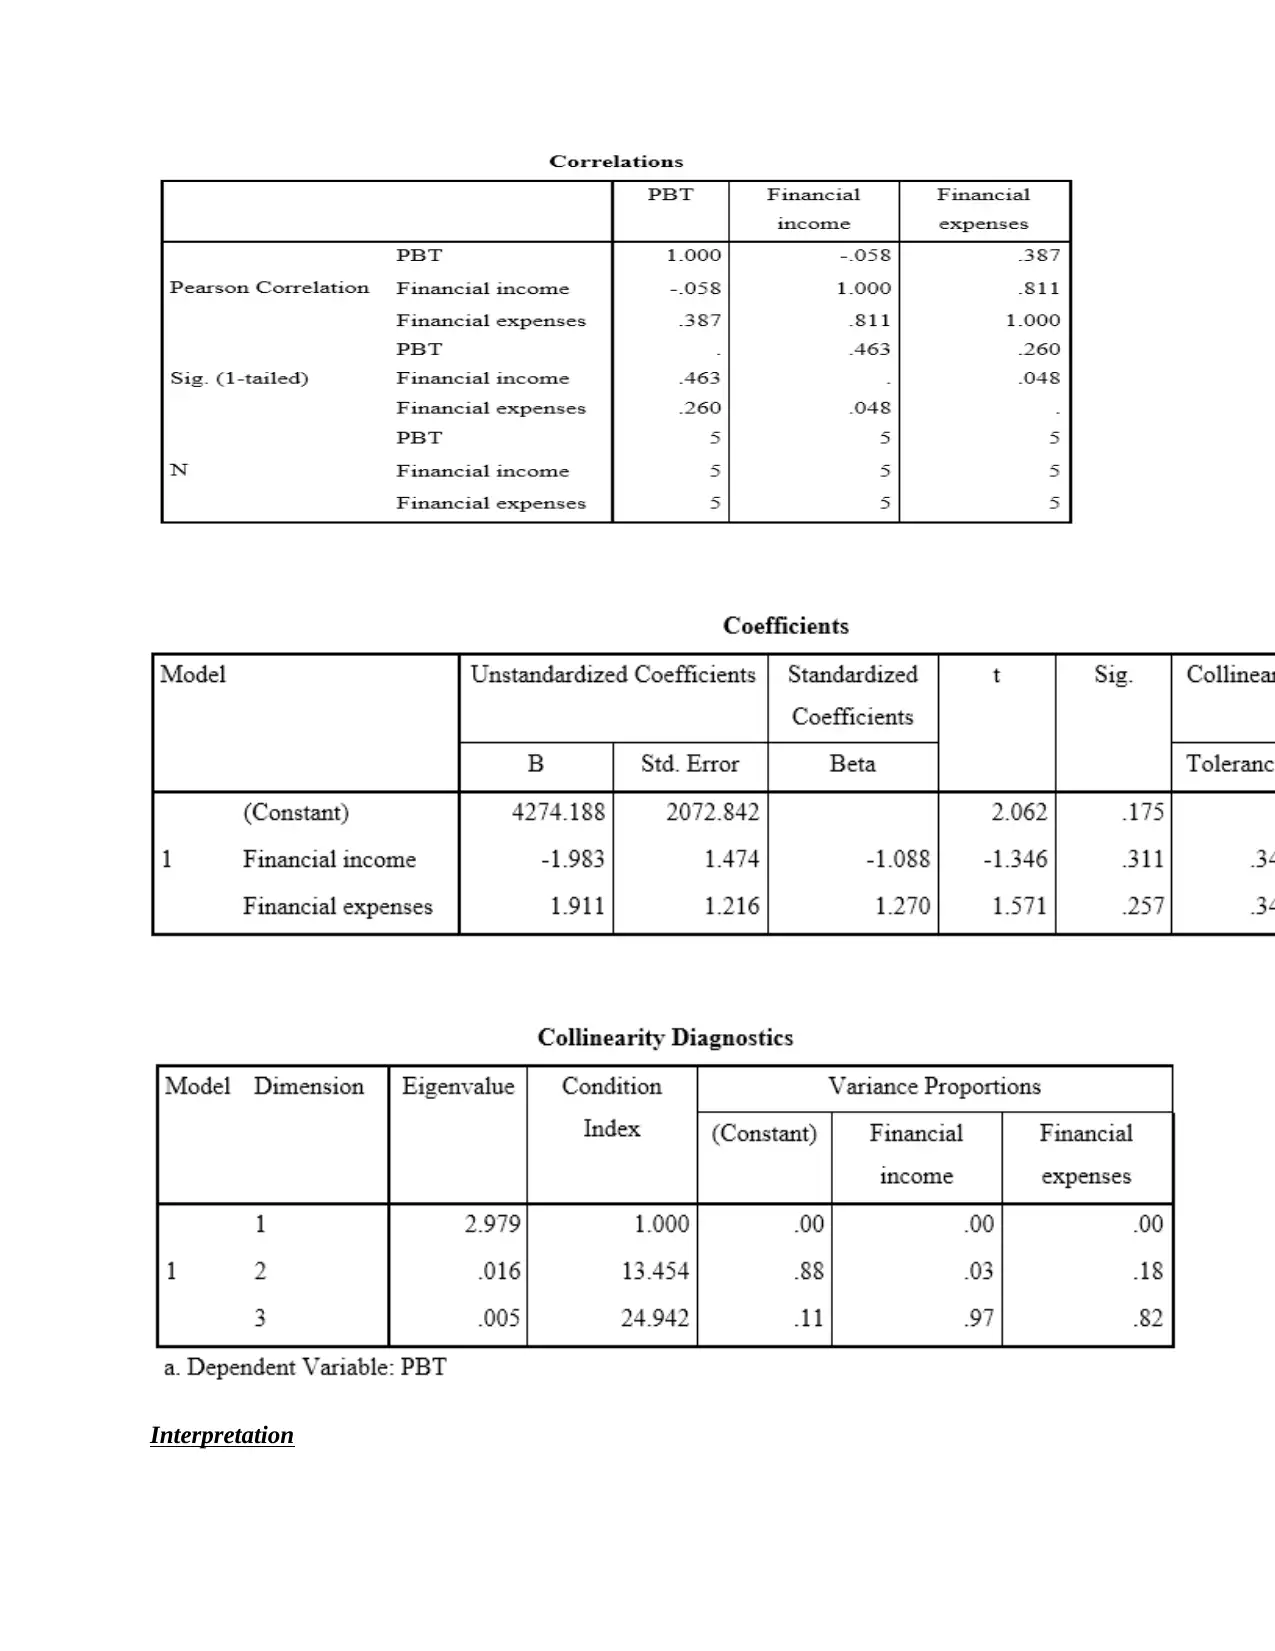
Interpretation
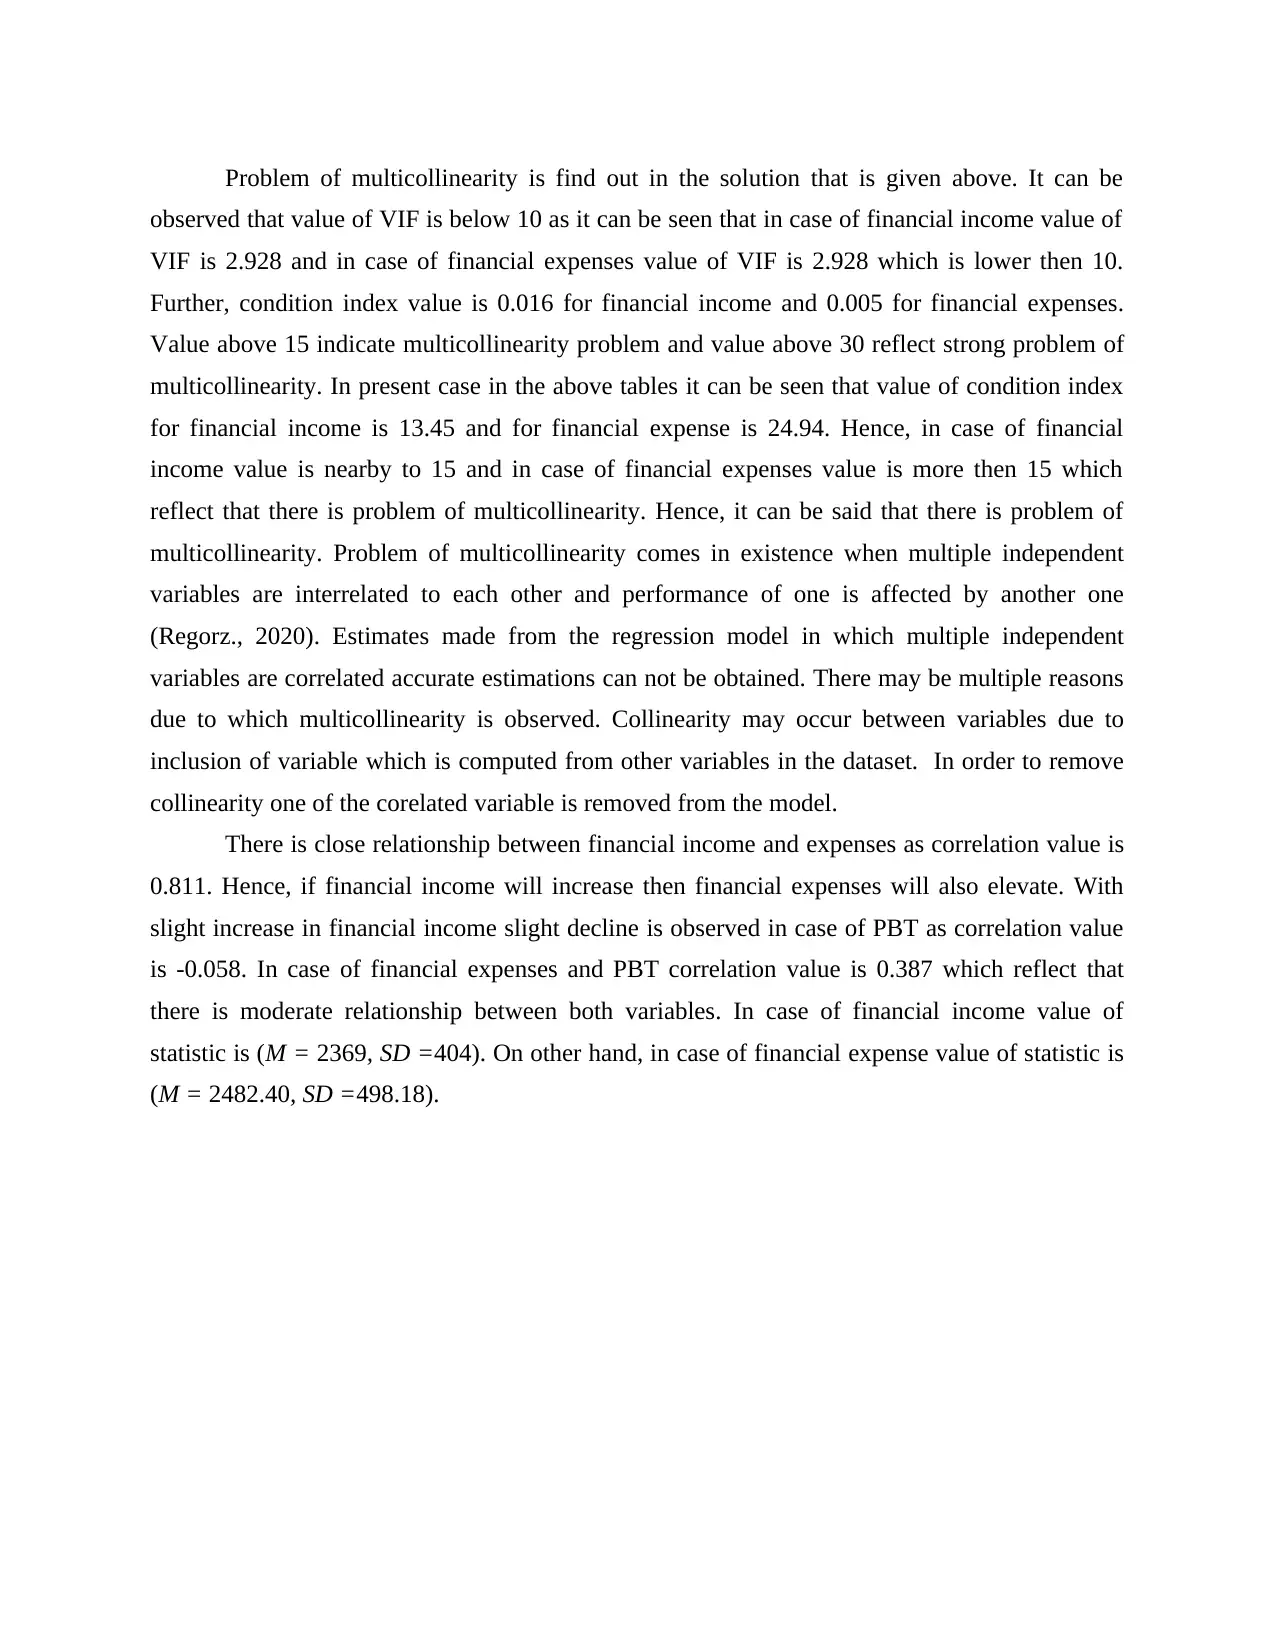
Problem of multicollinearity is find out in the solution that is given above. It can be
observed that value of VIF is below 10 as it can be seen that in case of financial income value of
VIF is 2.928 and in case of financial expenses value of VIF is 2.928 which is lower then 10.
Further, condition index value is 0.016 for financial income and 0.005 for financial expenses.
Value above 15 indicate multicollinearity problem and value above 30 reflect strong problem of
multicollinearity. In present case in the above tables it can be seen that value of condition index
for financial income is 13.45 and for financial expense is 24.94. Hence, in case of financial
income value is nearby to 15 and in case of financial expenses value is more then 15 which
reflect that there is problem of multicollinearity. Hence, it can be said that there is problem of
multicollinearity. Problem of multicollinearity comes in existence when multiple independent
variables are interrelated to each other and performance of one is affected by another one
(Regorz., 2020). Estimates made from the regression model in which multiple independent
variables are correlated accurate estimations can not be obtained. There may be multiple reasons
due to which multicollinearity is observed. Collinearity may occur between variables due to
inclusion of variable which is computed from other variables in the dataset. In order to remove
collinearity one of the corelated variable is removed from the model.
There is close relationship between financial income and expenses as correlation value is
0.811. Hence, if financial income will increase then financial expenses will also elevate. With
slight increase in financial income slight decline is observed in case of PBT as correlation value
is -0.058. In case of financial expenses and PBT correlation value is 0.387 which reflect that
there is moderate relationship between both variables. In case of financial income value of
statistic is (M = 2369, SD =404). On other hand, in case of financial expense value of statistic is
(M = 2482.40, SD =498.18).
⊘ This is a preview!⊘
Do you want full access?
Subscribe today to unlock all pages.
Trusted by 1+ million students worldwide
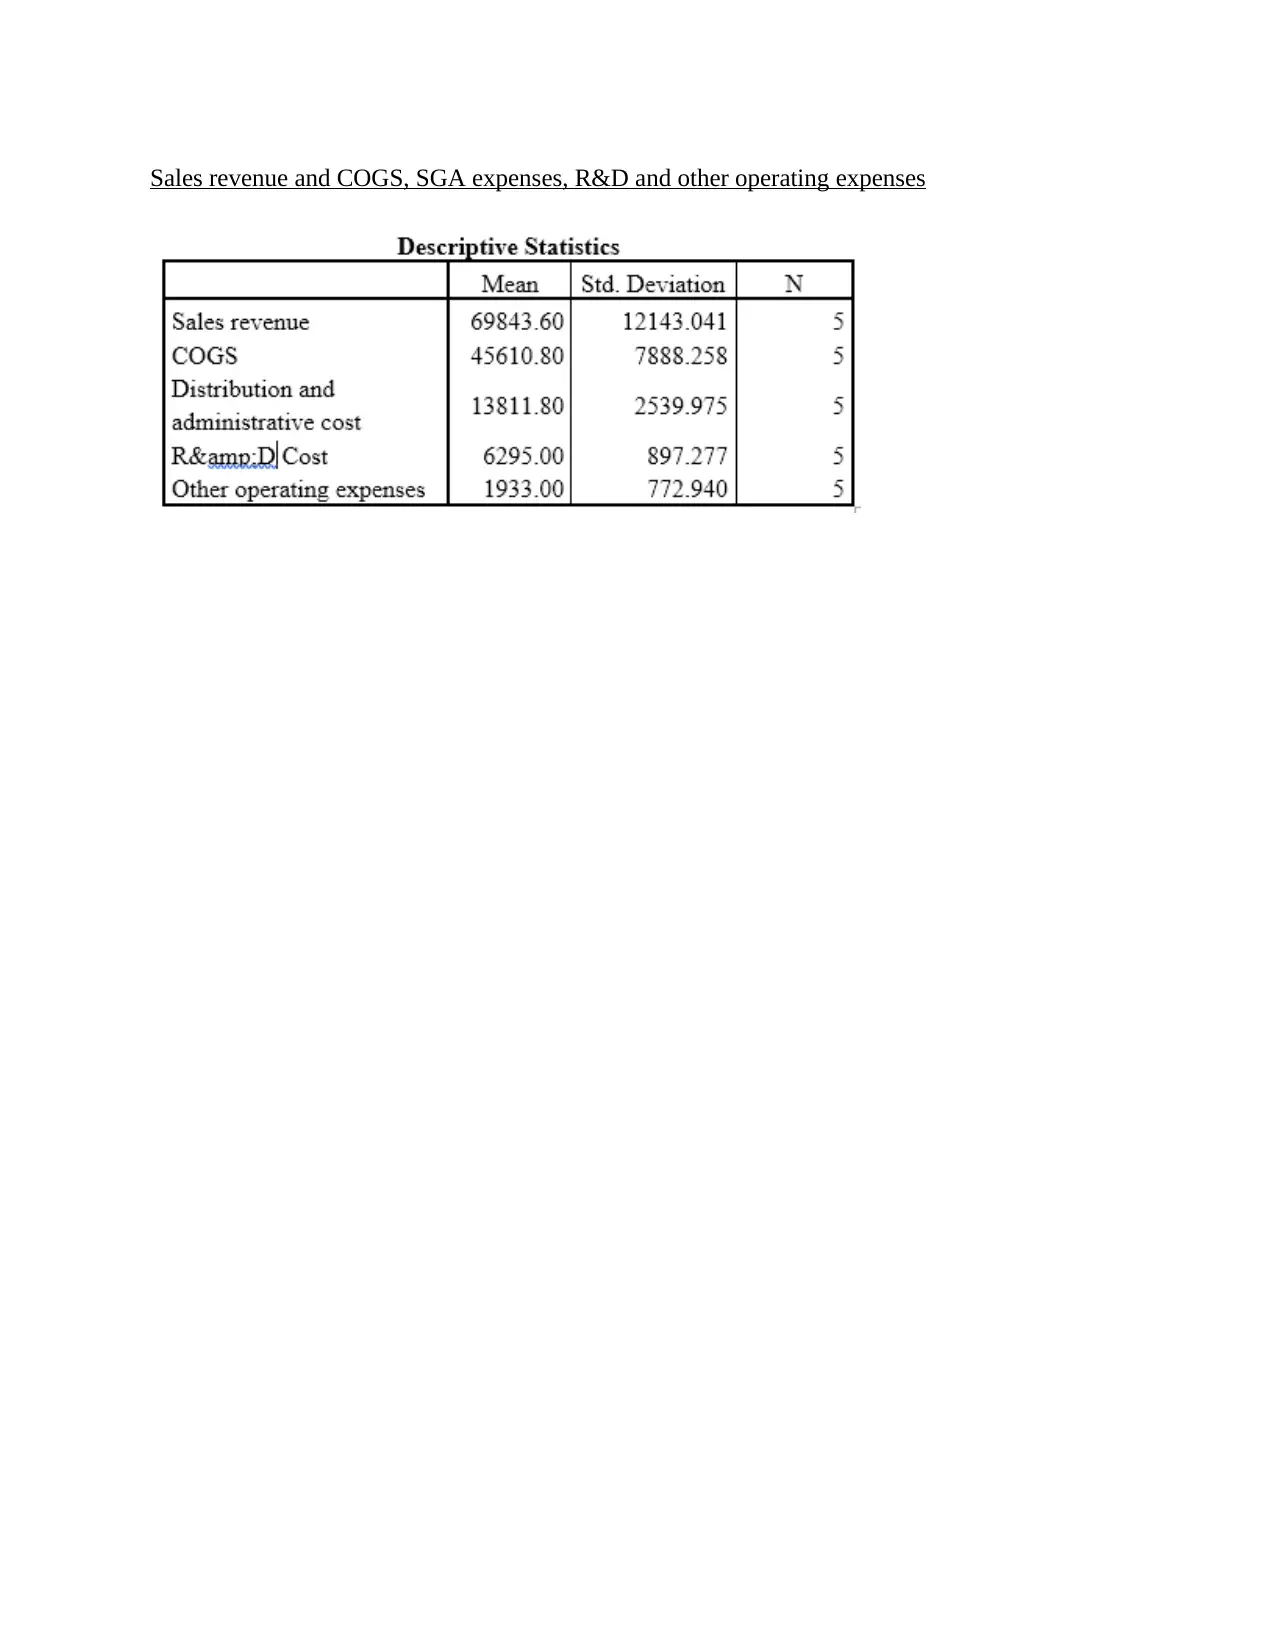
Sales revenue and COGS, SGA expenses, R&D and other operating expenses
Paraphrase This Document
Need a fresh take? Get an instant paraphrase of this document with our AI Paraphraser
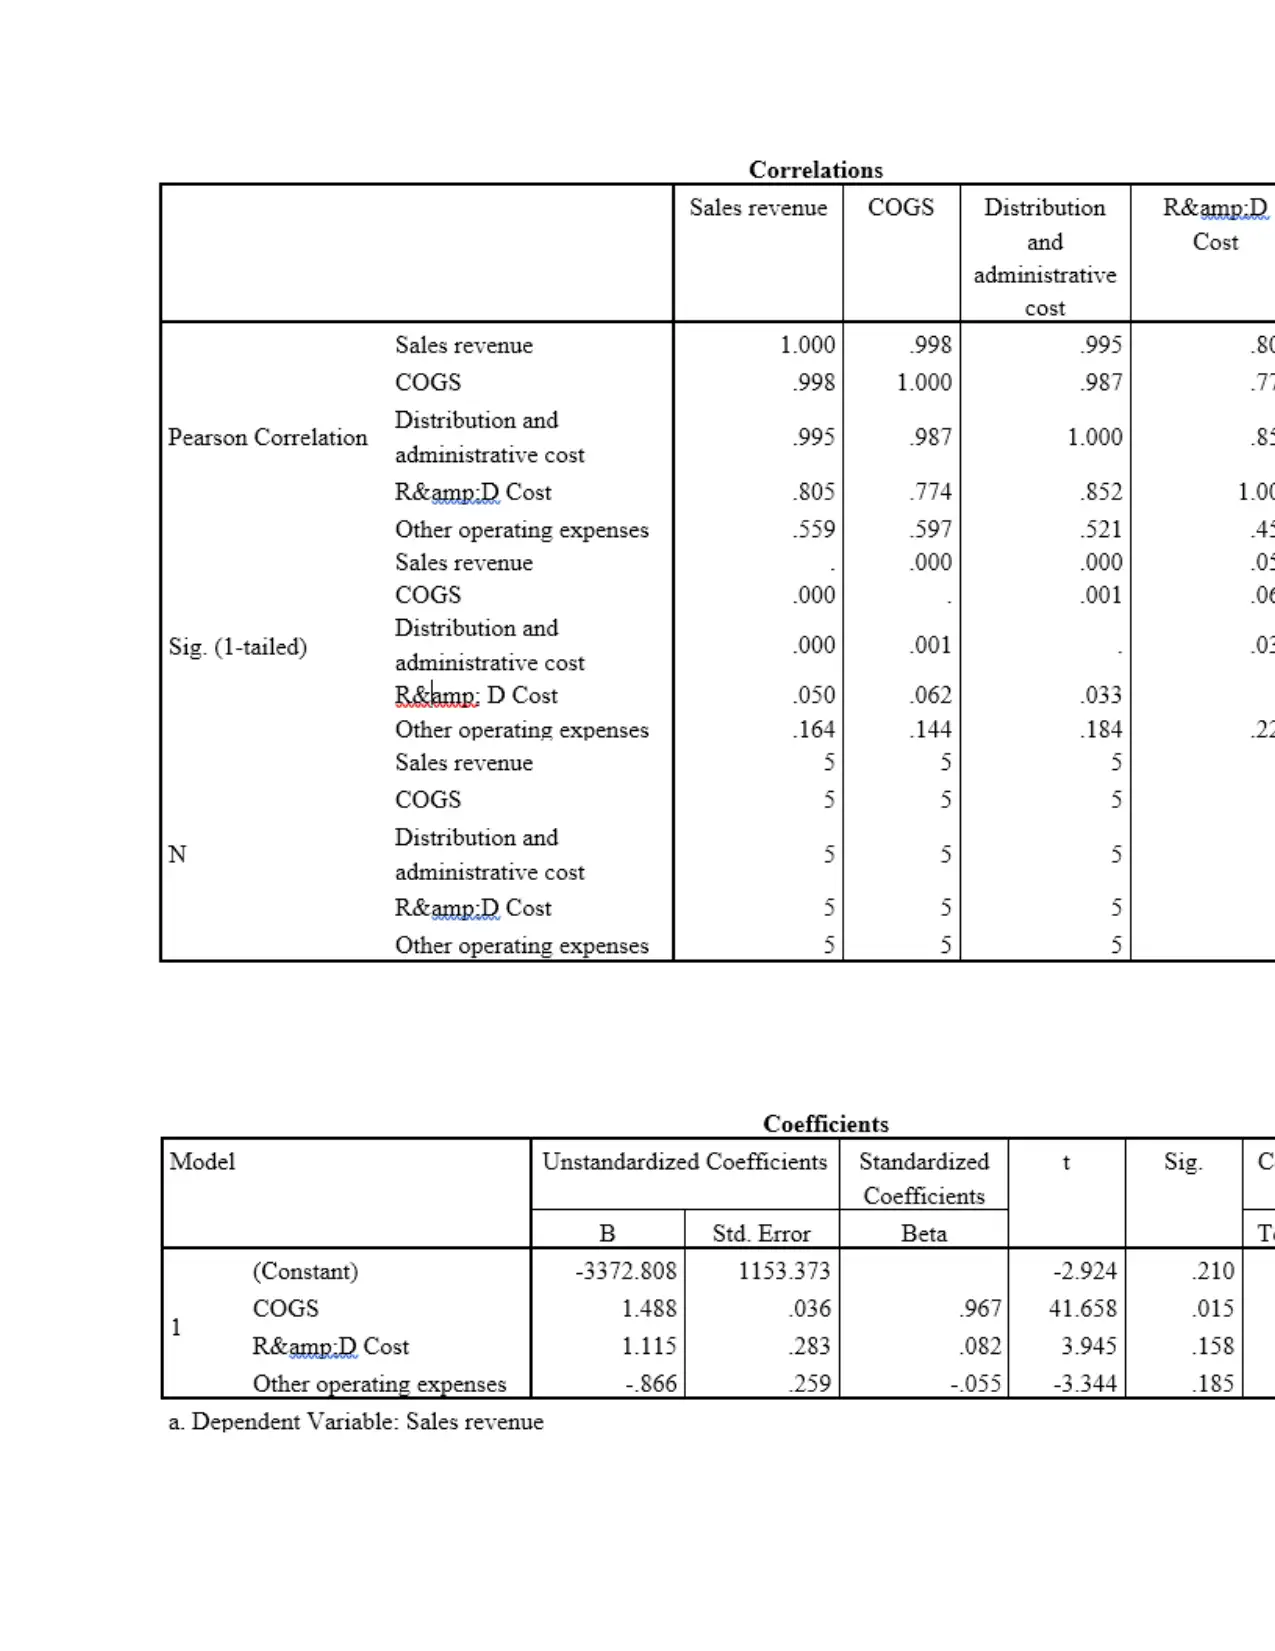
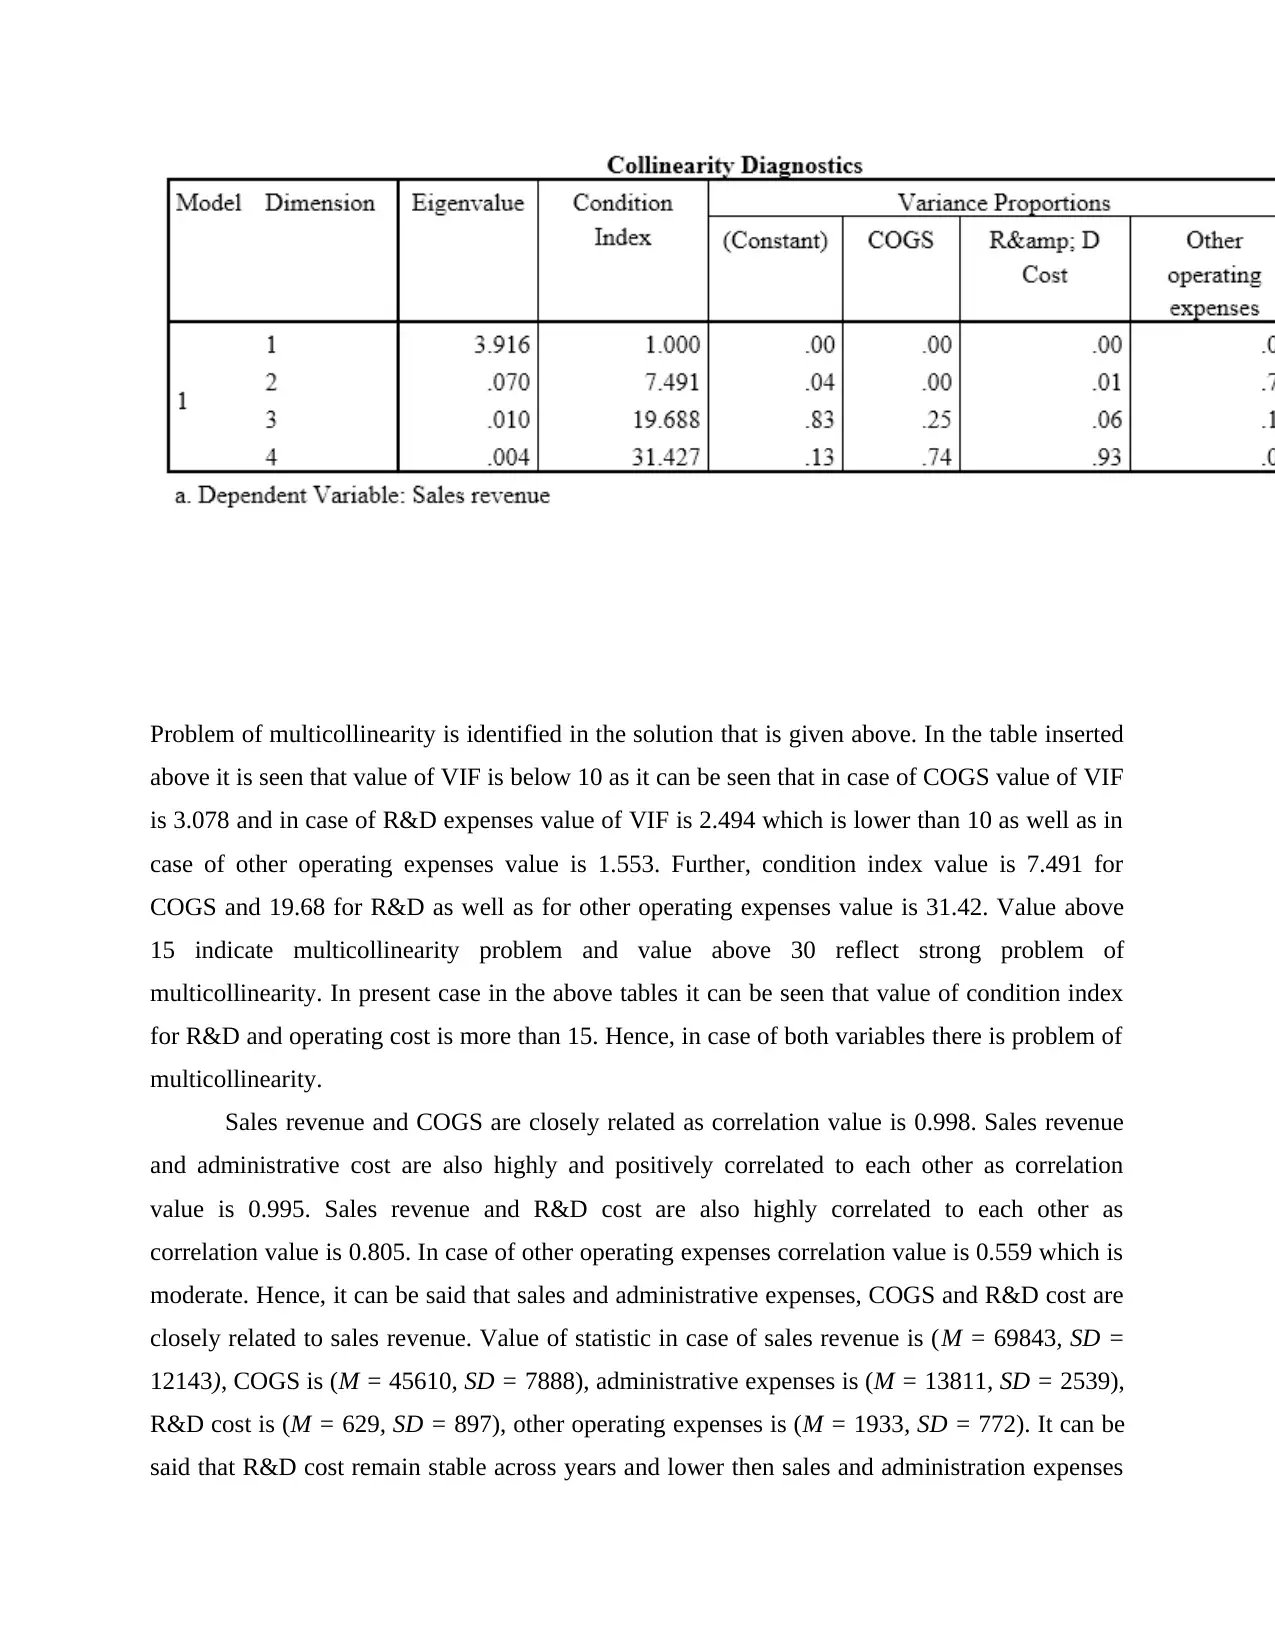
Problem of multicollinearity is identified in the solution that is given above. In the table inserted
above it is seen that value of VIF is below 10 as it can be seen that in case of COGS value of VIF
is 3.078 and in case of R&D expenses value of VIF is 2.494 which is lower than 10 as well as in
case of other operating expenses value is 1.553. Further, condition index value is 7.491 for
COGS and 19.68 for R&D as well as for other operating expenses value is 31.42. Value above
15 indicate multicollinearity problem and value above 30 reflect strong problem of
multicollinearity. In present case in the above tables it can be seen that value of condition index
for R&D and operating cost is more than 15. Hence, in case of both variables there is problem of
multicollinearity.
Sales revenue and COGS are closely related as correlation value is 0.998. Sales revenue
and administrative cost are also highly and positively correlated to each other as correlation
value is 0.995. Sales revenue and R&D cost are also highly correlated to each other as
correlation value is 0.805. In case of other operating expenses correlation value is 0.559 which is
moderate. Hence, it can be said that sales and administrative expenses, COGS and R&D cost are
closely related to sales revenue. Value of statistic in case of sales revenue is (M = 69843, SD =
12143), COGS is (M = 45610, SD = 7888), administrative expenses is (M = 13811, SD = 2539),
R&D cost is (M = 629, SD = 897), other operating expenses is (M = 1933, SD = 772). It can be
said that R&D cost remain stable across years and lower then sales and administration expenses
⊘ This is a preview!⊘
Do you want full access?
Subscribe today to unlock all pages.
Trusted by 1+ million students worldwide
1 out of 30