LCBB5000 - Data Handling & Business Intelligence Report
VerifiedAdded on 2023/06/18
|15
|3056
|305
Report
AI Summary
This report delves into data handling and business intelligence, utilizing Excel for preprocessing, analysis, and visualization to determine sales and profit declines through charts and graphs. It explores SPSS in conjunction with K-means clustering, detailing the steps for calculation and interpretation. The report also discusses common data mining methods used in business with real-world examples, and compares the advantages and disadvantages of SPSS over Excel, providing both theoretical and practical arguments. The analysis includes applying filters, sum formulas, and chart development to superstore data to identify the relationship between sales, profit, and discount, referencing literature to support findings. Furthermore, it involves gender and age analysis of Smile Clinic customers using SPSS, alongside K-means clustering to assign values and interpret results.
DATA HANDLING AND
BUSINESS INTELLIGENCE
BUSINESS INTELLIGENCE
Paraphrase This Document
Need a fresh take? Get an instant paraphrase of this document with our AI Paraphraser
TABLE OF CONTENTS
PART 1............................................................................................................................................1
Use of Excel for pre-processing the data, data analysis and data visualization. Determination
of decline in sales and profit using chart and graphs...................................................................1
PART 2............................................................................................................................................5
2.1 Conjunction with SPSS with screenshots and findings of K-means.....................................6
2.2 Most common data mining methods used in business with real world examples...............11
2.3 Discuss advantages/disadvantages of SPSS over Excel with theoretical arguments and
practical arguments....................................................................................................................12
REFERENCES..............................................................................................................................13
PART 1
Use of Excel for pre-processing the data, data analysis and data visualization. Determination of
decline in sales and profit using chart and graphs
Excel is one of the most important tool which is required to be used by organizations as it
helps in analysing and interpreting raw data into meaningful data that can be used by
organizations for various purposes such as decision making etc. Excel can be used for evaluating
raw information or data so that it can be processed easily and can be understood easily by its
users so that required and important information can be extracted from it (Martino, 2019). One of
the most important purpose because of which Excel is being used by organizations is pre-
processing in which data or information is entered into Excel in a manner in which it can be
understood properly. Excel provides rows and column in which data can be entered in such a
manner that its users can understand and use this data easily. Pre-processing data also help in
extracting important and useful part of Excel that can further help in extracting or evaluating any
kind of important information and gain other important information associated with it.
When pre-processing of data is done then in order to evaluate and extract important data
analysis of the data is done. Analysis of data is another important feature of excel (Kajáti, Miškuf
and Papcun, 2017). For analysis of data stored within Excel, Excel provides various kinds of in-
built formulas that can be used by users for analysis of data. Excel provides various kinds of
inbuilt features such as calculation of average, mean, mode, searching for value, etc. These
features can be used by users as per their convenience, requirement and use. But in order to make
analysis more presentable and easy to understand Excel provide visualization of data feature as
well. Using this feature, users can create graph, charts, histograms of their analysed data so that
extracted or analysed results can be understood in more accurate and effective manner.
For analysing and visualizing data in Excel, Excel provide various other features for
making extraction and interpretation of data more easy and one of those feature is Pivot tables
and charts (Becker and Gould, 2019). This feature of Excel help users in identifying and
selecting the data that they want to analyse and save that data in Pivot table so that users can
mold that data in any way they want, present any data they want, bring chances within data in
many manner users want without affecting actual an final data.
Excel is one of the most effective tool when it comes to pre-processing of data but has
some drawbacks as well such as in Excel values that are left bank can work as a barrier when it
1
⊘ This is a preview!⊘
Do you want full access?
Subscribe today to unlock all pages.
Trusted by 1+ million students worldwide
comes to analysis of data, any value in pre-processing of data is entered wrong them all the
analysis can go wrong and there is no feature in excel that can help in understanding that value
entered is wrong (Kajáti, Miškuf and Papcun, 2017). But despite of this, Excel is one of the best
and most appropriate or accurate tool that can be used for bingers when it comes to data storage,
analysis and visualization.
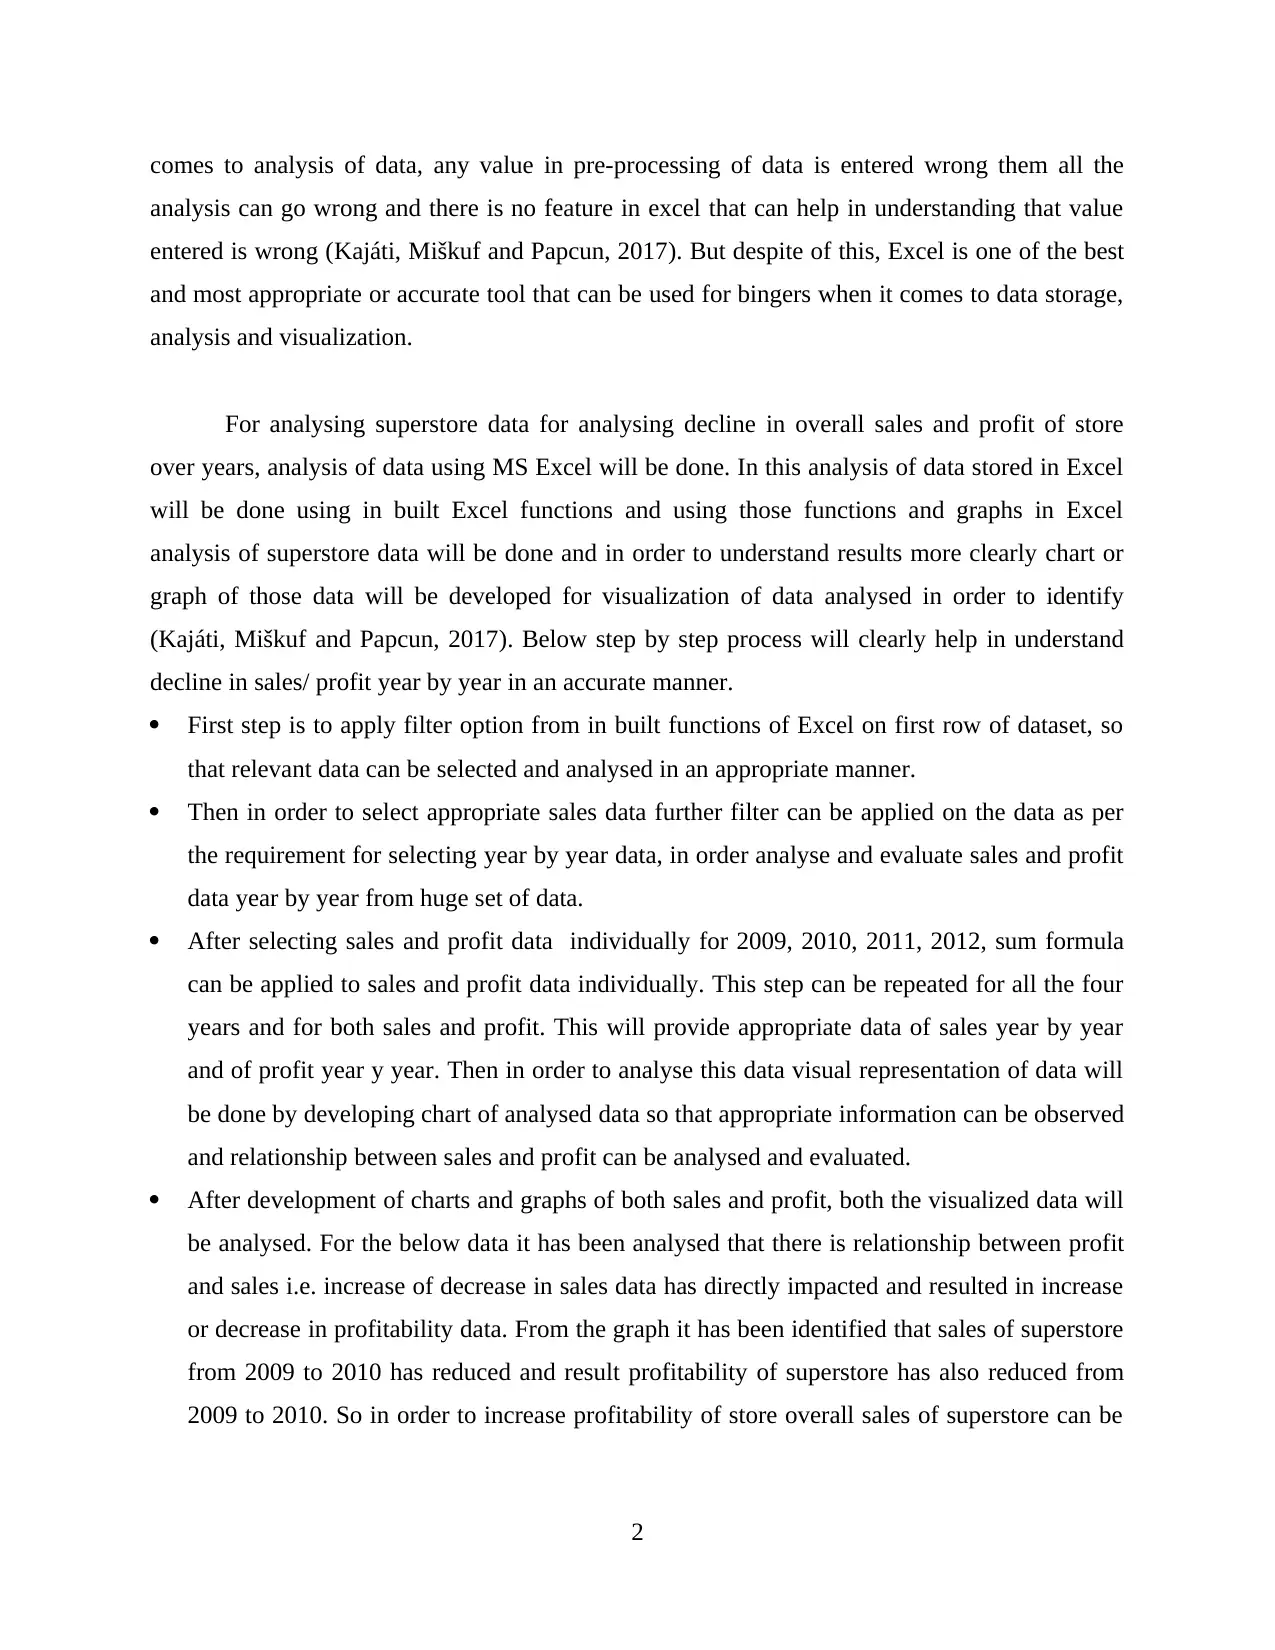
For analysing superstore data for analysing decline in overall sales and profit of store
over years, analysis of data using MS Excel will be done. In this analysis of data stored in Excel
will be done using in built Excel functions and using those functions and graphs in Excel
analysis of superstore data will be done and in order to understand results more clearly chart or
graph of those data will be developed for visualization of data analysed in order to identify
(Kajáti, Miškuf and Papcun, 2017). Below step by step process will clearly help in understand
decline in sales/ profit year by year in an accurate manner.
First step is to apply filter option from in built functions of Excel on first row of dataset, so
that relevant data can be selected and analysed in an appropriate manner.
Then in order to select appropriate sales data further filter can be applied on the data as per
the requirement for selecting year by year data, in order analyse and evaluate sales and profit
data year by year from huge set of data.
After selecting sales and profit data individually for 2009, 2010, 2011, 2012, sum formula
can be applied to sales and profit data individually. This step can be repeated for all the four
years and for both sales and profit. This will provide appropriate data of sales year by year
and of profit year y year. Then in order to analyse this data visual representation of data will
be done by developing chart of analysed data so that appropriate information can be observed
and relationship between sales and profit can be analysed and evaluated.
After development of charts and graphs of both sales and profit, both the visualized data will
be analysed. For the below data it has been analysed that there is relationship between profit
and sales i.e. increase of decrease in sales data has directly impacted and resulted in increase
or decrease in profitability data. From the graph it has been identified that sales of superstore
from 2009 to 2010 has reduced and result profitability of superstore has also reduced from
2009 to 2010. So in order to increase profitability of store overall sales of superstore can be
2
analysis can go wrong and there is no feature in excel that can help in understanding that value
entered is wrong (Kajáti, Miškuf and Papcun, 2017). But despite of this, Excel is one of the best
and most appropriate or accurate tool that can be used for bingers when it comes to data storage,
analysis and visualization.
For analysing superstore data for analysing decline in overall sales and profit of store
over years, analysis of data using MS Excel will be done. In this analysis of data stored in Excel
will be done using in built Excel functions and using those functions and graphs in Excel
analysis of superstore data will be done and in order to understand results more clearly chart or
graph of those data will be developed for visualization of data analysed in order to identify
(Kajáti, Miškuf and Papcun, 2017). Below step by step process will clearly help in understand
decline in sales/ profit year by year in an accurate manner.
First step is to apply filter option from in built functions of Excel on first row of dataset, so
that relevant data can be selected and analysed in an appropriate manner.
Then in order to select appropriate sales data further filter can be applied on the data as per
the requirement for selecting year by year data, in order analyse and evaluate sales and profit
data year by year from huge set of data.
After selecting sales and profit data individually for 2009, 2010, 2011, 2012, sum formula
can be applied to sales and profit data individually. This step can be repeated for all the four
years and for both sales and profit. This will provide appropriate data of sales year by year
and of profit year y year. Then in order to analyse this data visual representation of data will
be done by developing chart of analysed data so that appropriate information can be observed
and relationship between sales and profit can be analysed and evaluated.
After development of charts and graphs of both sales and profit, both the visualized data will
be analysed. For the below data it has been analysed that there is relationship between profit
and sales i.e. increase of decrease in sales data has directly impacted and resulted in increase
or decrease in profitability data. From the graph it has been identified that sales of superstore
from 2009 to 2010 has reduced and result profitability of superstore has also reduced from
2009 to 2010. So in order to increase profitability of store overall sales of superstore can be
2
Paraphrase This Document
Need a fresh take? Get an instant paraphrase of this document with our AI Paraphraser
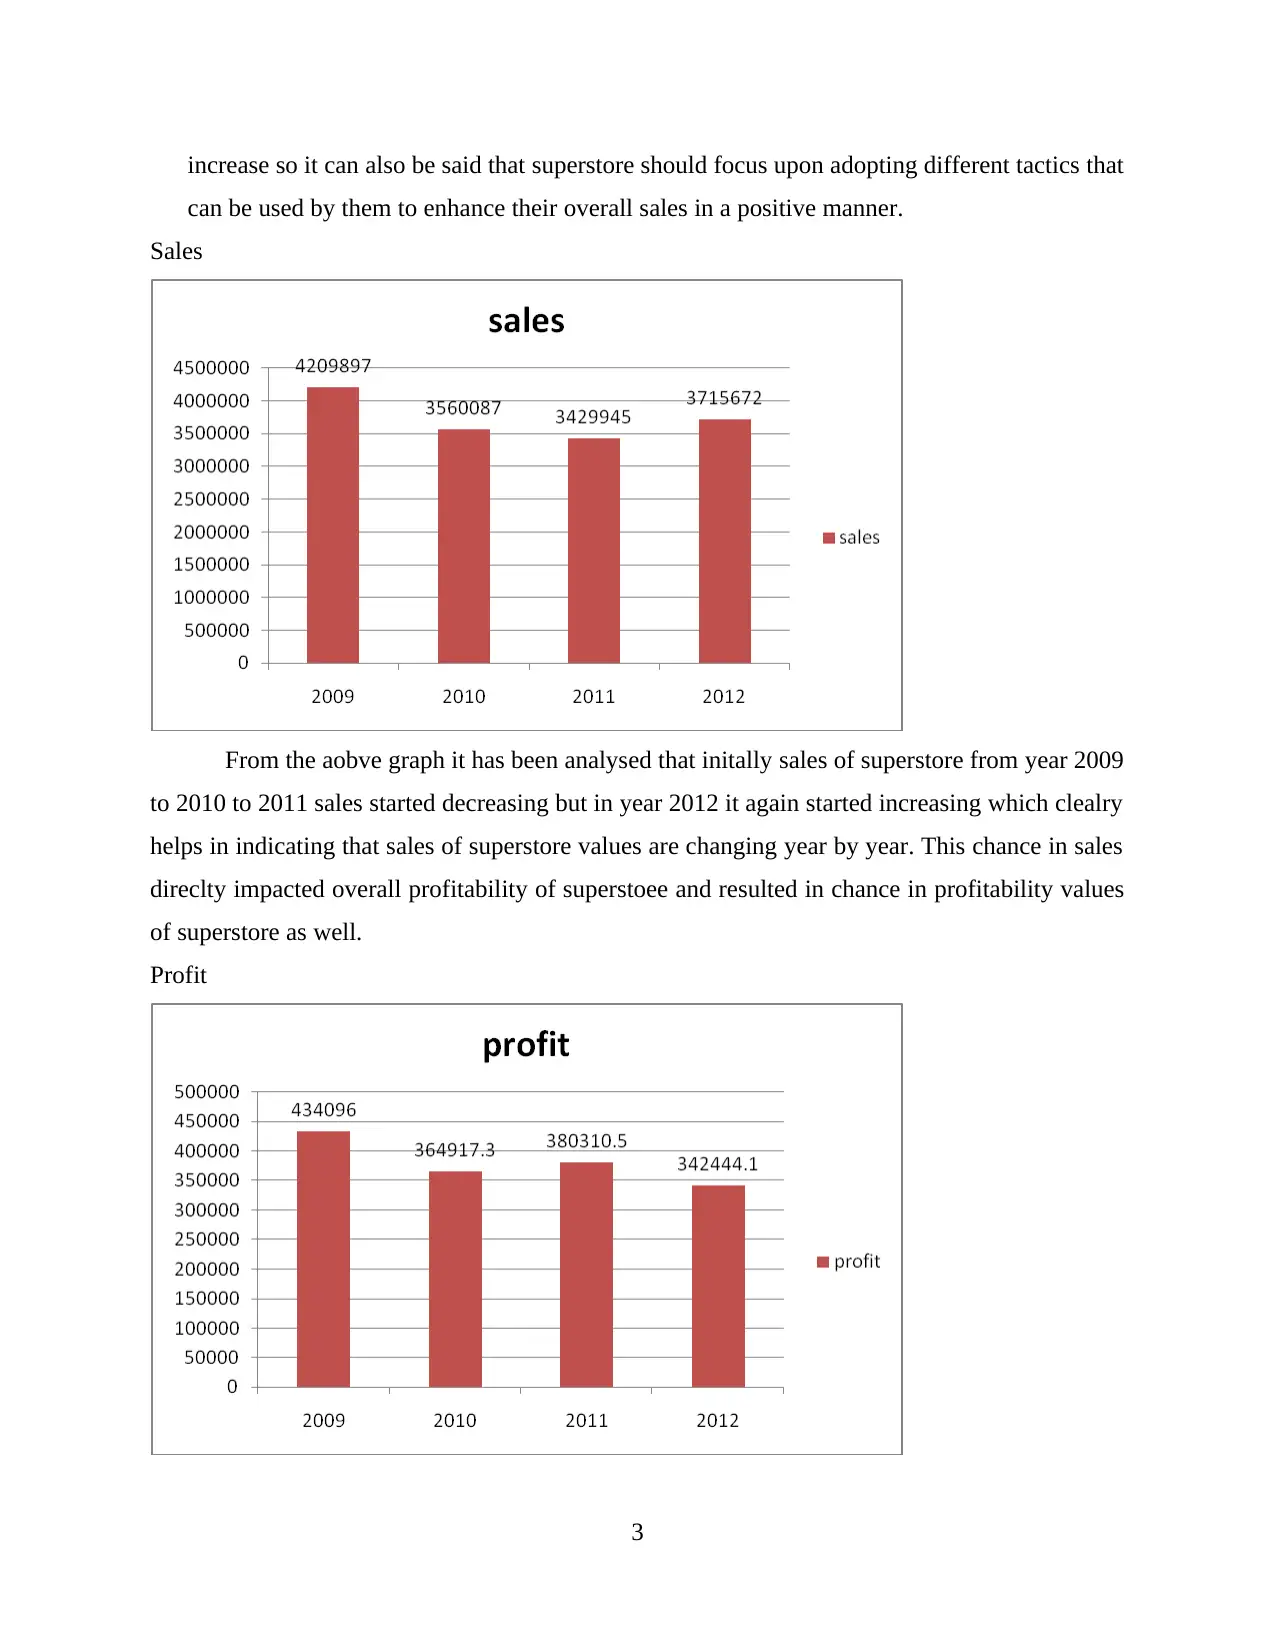
increase so it can also be said that superstore should focus upon adopting different tactics that
can be used by them to enhance their overall sales in a positive manner.
Sales
From the aobve graph it has been analysed that initally sales of superstore from year 2009
to 2010 to 2011 sales started decreasing but in year 2012 it again started increasing which clealry
helps in indicating that sales of superstore values are changing year by year. This chance in sales
direclty impacted overall profitability of superstoee and resulted in chance in profitability values
of superstore as well.
Profit
3
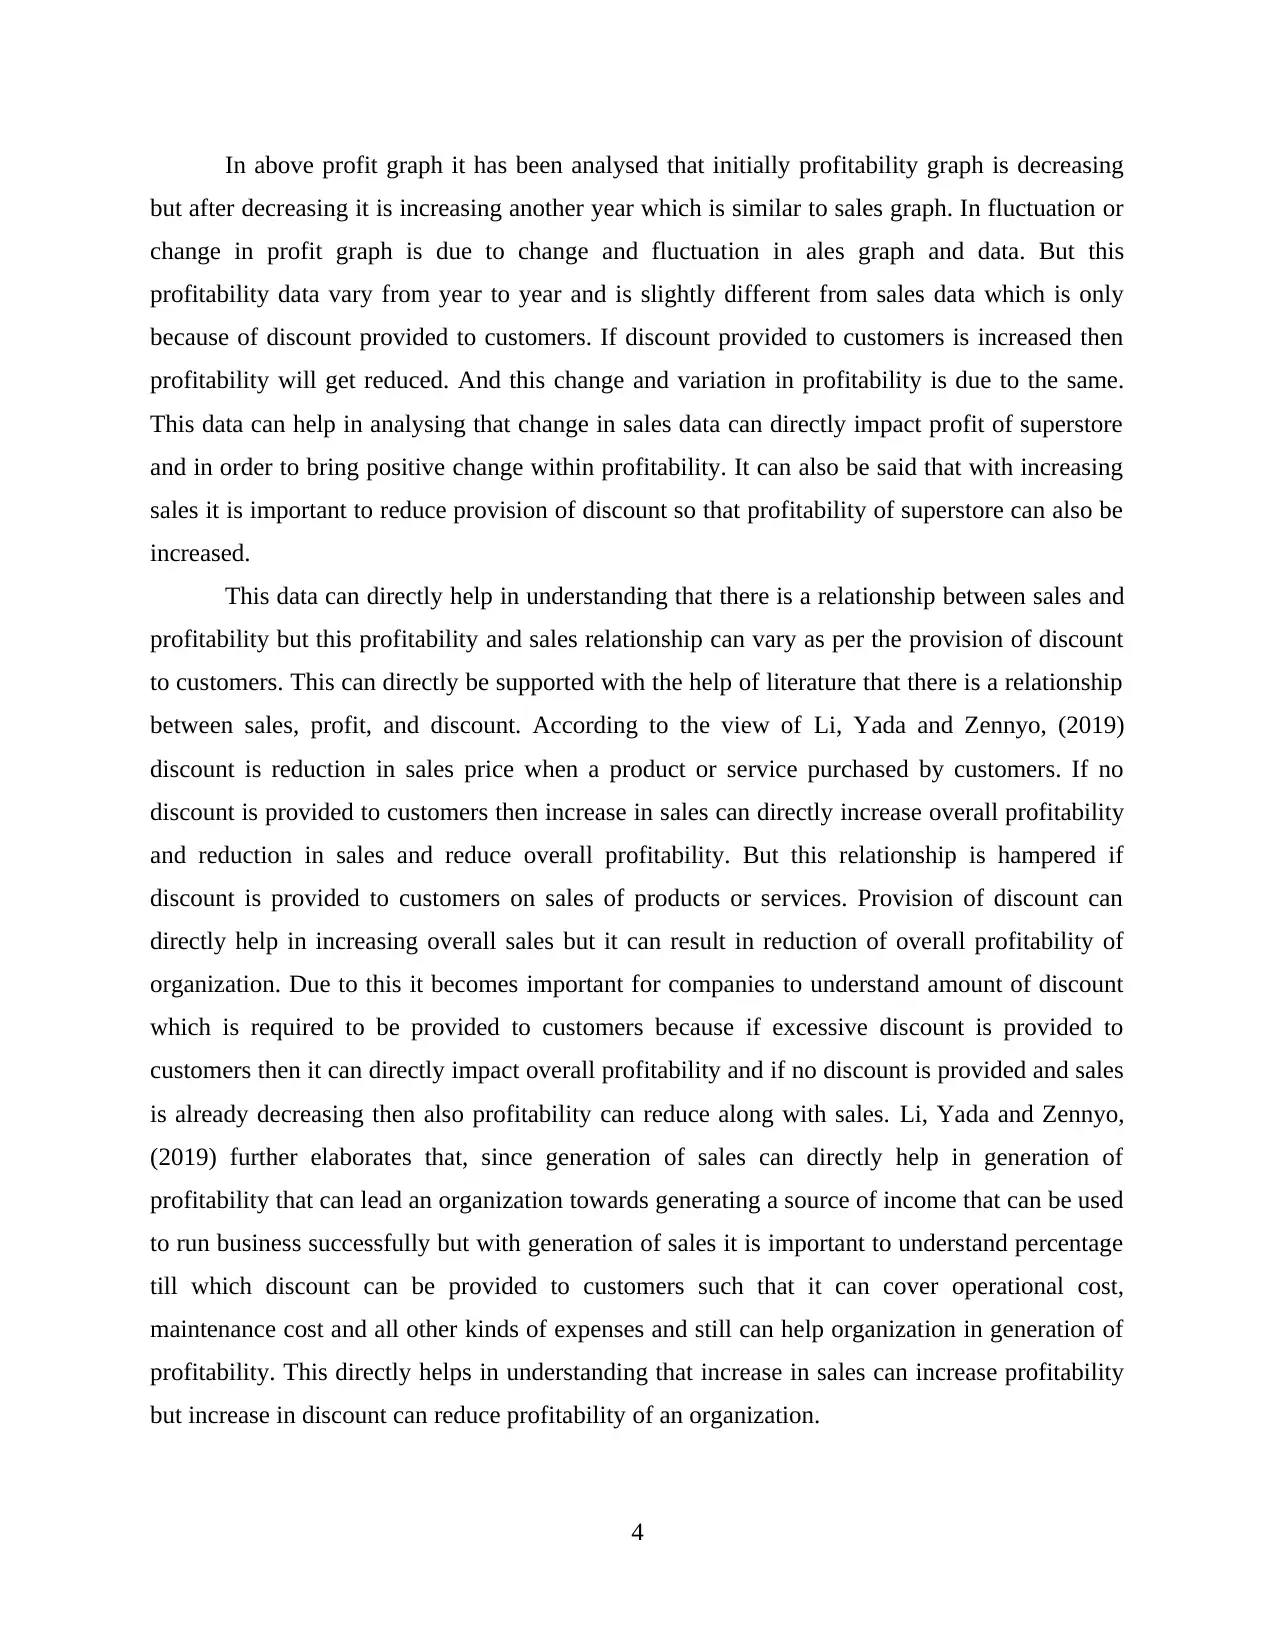
In above profit graph it has been analysed that initially profitability graph is decreasing
but after decreasing it is increasing another year which is similar to sales graph. In fluctuation or
change in profit graph is due to change and fluctuation in ales graph and data. But this
profitability data vary from year to year and is slightly different from sales data which is only
because of discount provided to customers. If discount provided to customers is increased then
profitability will get reduced. And this change and variation in profitability is due to the same.
This data can help in analysing that change in sales data can directly impact profit of superstore
and in order to bring positive change within profitability. It can also be said that with increasing
sales it is important to reduce provision of discount so that profitability of superstore can also be
increased.
This data can directly help in understanding that there is a relationship between sales and
profitability but this profitability and sales relationship can vary as per the provision of discount
to customers. This can directly be supported with the help of literature that there is a relationship
between sales, profit, and discount. According to the view of Li, Yada and Zennyo, (2019)
discount is reduction in sales price when a product or service purchased by customers. If no
discount is provided to customers then increase in sales can directly increase overall profitability
and reduction in sales and reduce overall profitability. But this relationship is hampered if
discount is provided to customers on sales of products or services. Provision of discount can
directly help in increasing overall sales but it can result in reduction of overall profitability of
organization. Due to this it becomes important for companies to understand amount of discount
which is required to be provided to customers because if excessive discount is provided to
customers then it can directly impact overall profitability and if no discount is provided and sales
is already decreasing then also profitability can reduce along with sales. Li, Yada and Zennyo,
(2019) further elaborates that, since generation of sales can directly help in generation of
profitability that can lead an organization towards generating a source of income that can be used
to run business successfully but with generation of sales it is important to understand percentage
till which discount can be provided to customers such that it can cover operational cost,
maintenance cost and all other kinds of expenses and still can help organization in generation of
profitability. This directly helps in understanding that increase in sales can increase profitability
but increase in discount can reduce profitability of an organization.
4
⊘ This is a preview!⊘
Do you want full access?
Subscribe today to unlock all pages.
Trusted by 1+ million students worldwide
PART 2
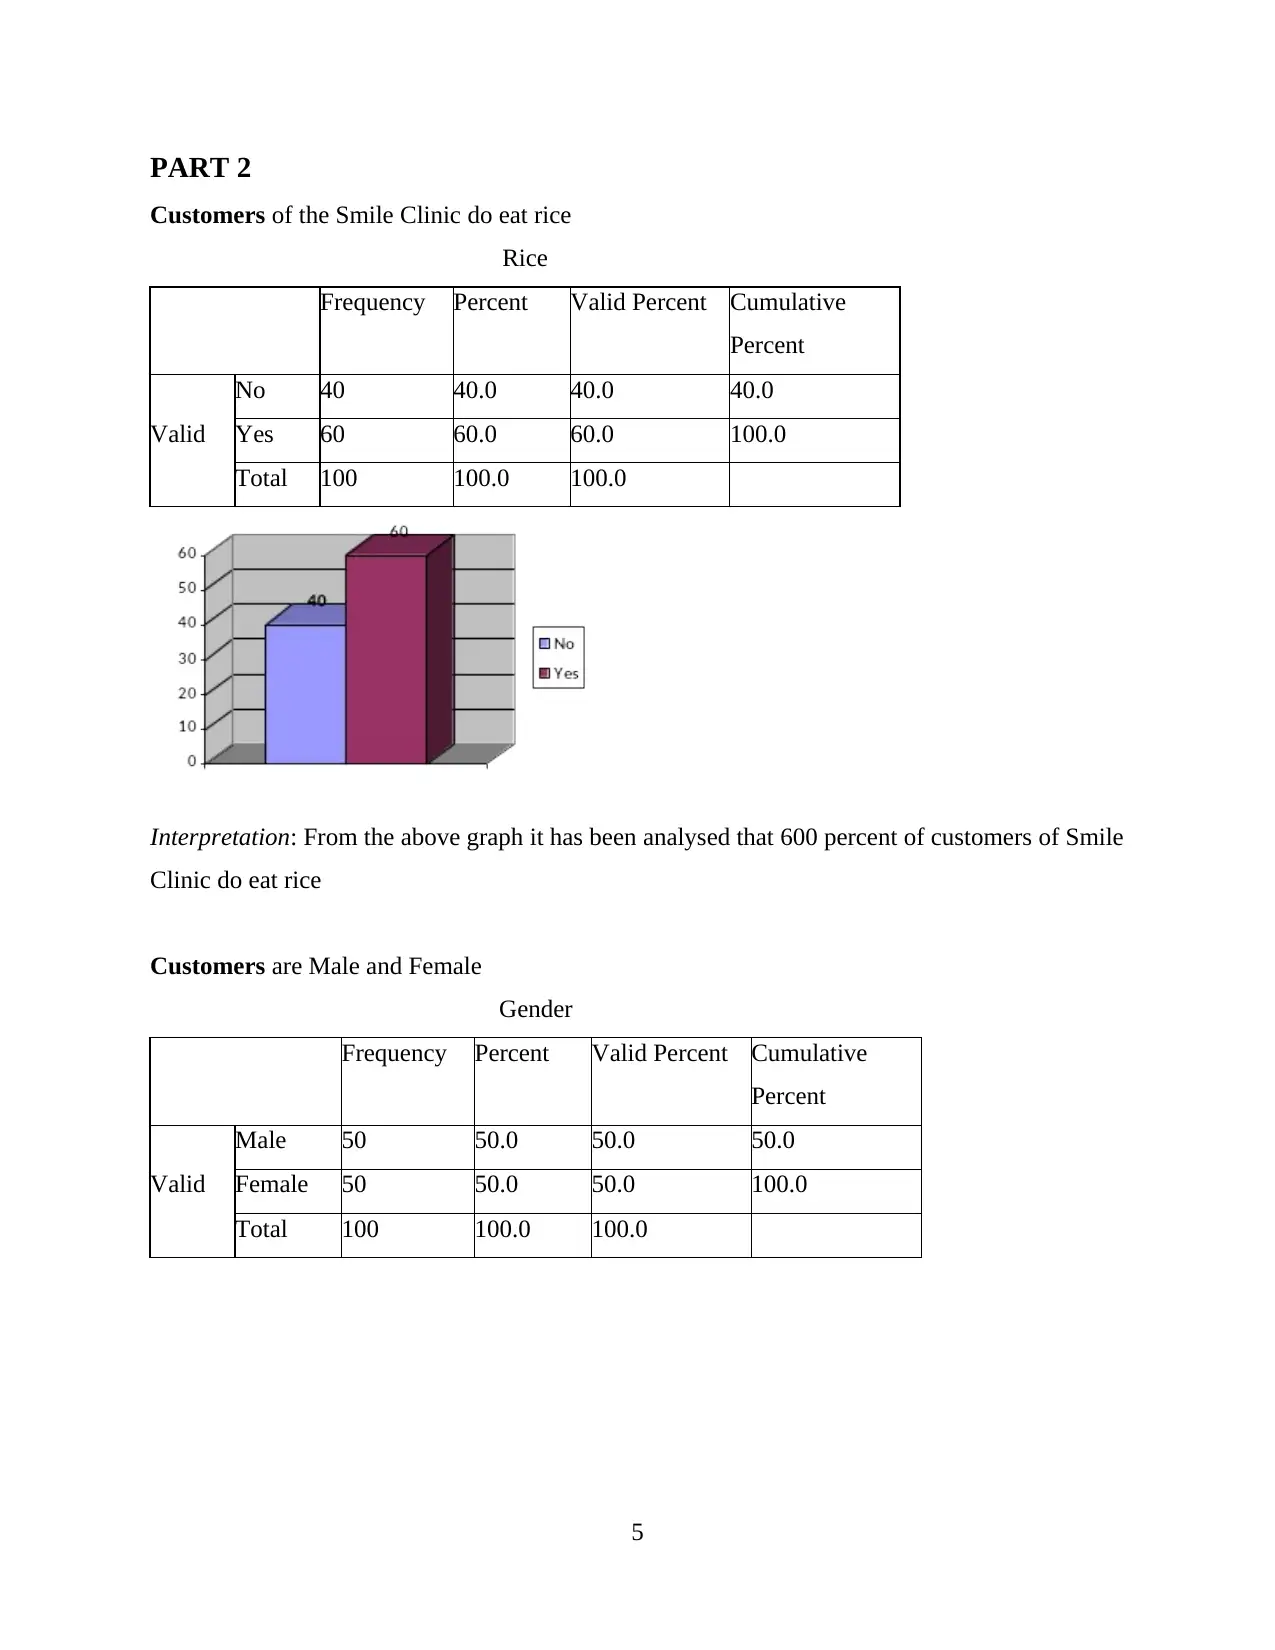
Customers of the Smile Clinic do eat rice
Rice
Frequency Percent Valid Percent Cumulative
Percent
Valid
No 40 40.0 40.0 40.0
Yes 60 60.0 60.0 100.0
Total 100 100.0 100.0
Interpretation: From the above graph it has been analysed that 600 percent of customers of Smile
Clinic do eat rice
Customers are Male and Female
Gender
Frequency Percent Valid Percent Cumulative
Percent
Valid
Male 50 50.0 50.0 50.0
Female 50 50.0 50.0 100.0
Total 100 100.0 100.0
5
Paraphrase This Document
Need a fresh take? Get an instant paraphrase of this document with our AI Paraphraser
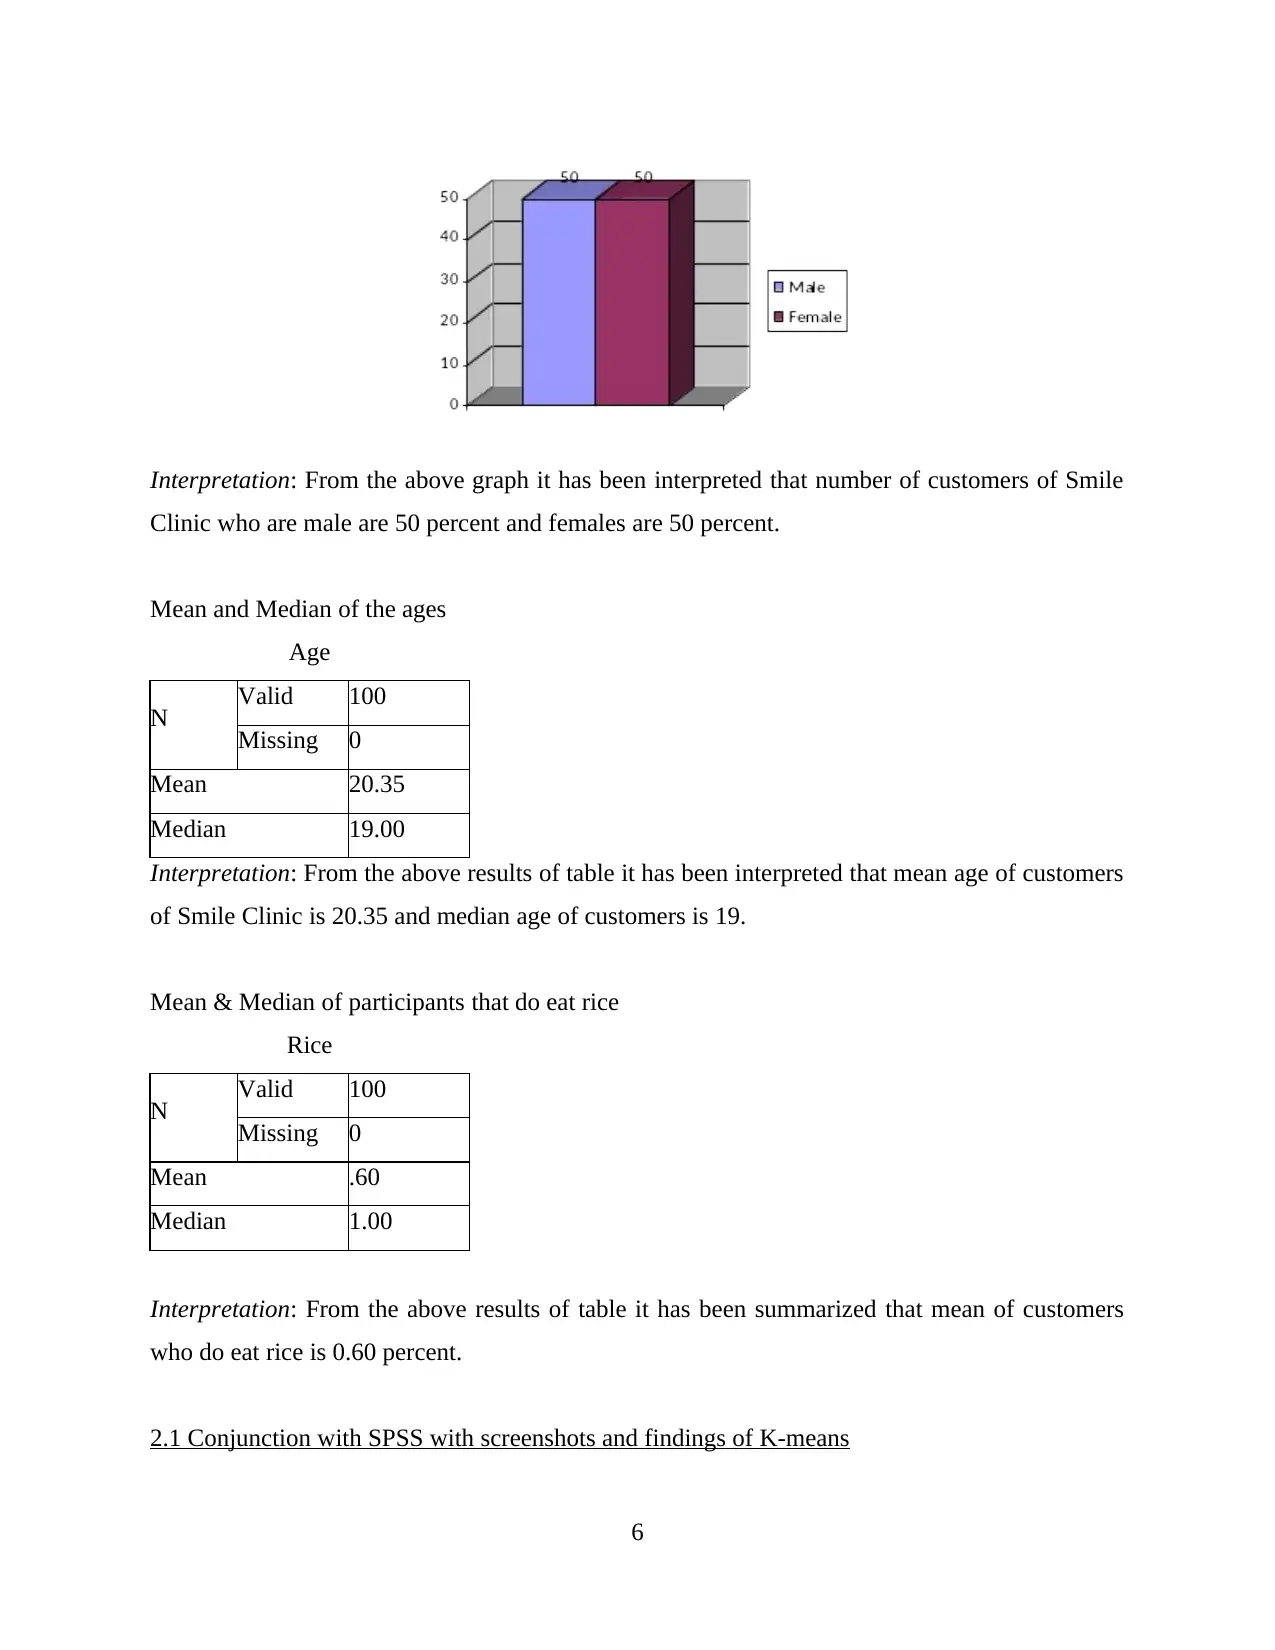
Interpretation: From the above graph it has been interpreted that number of customers of Smile
Clinic who are male are 50 percent and females are 50 percent.
Mean and Median of the ages
Age
N Valid 100
Missing 0
Mean 20.35
Median 19.00
Interpretation: From the above results of table it has been interpreted that mean age of customers
of Smile Clinic is 20.35 and median age of customers is 19.
Mean & Median of participants that do eat rice
Rice
N Valid 100
Missing 0
Mean .60
Median 1.00
Interpretation: From the above results of table it has been summarized that mean of customers
who do eat rice is 0.60 percent.
2.1 Conjunction with SPSS with screenshots and findings of K-means
6
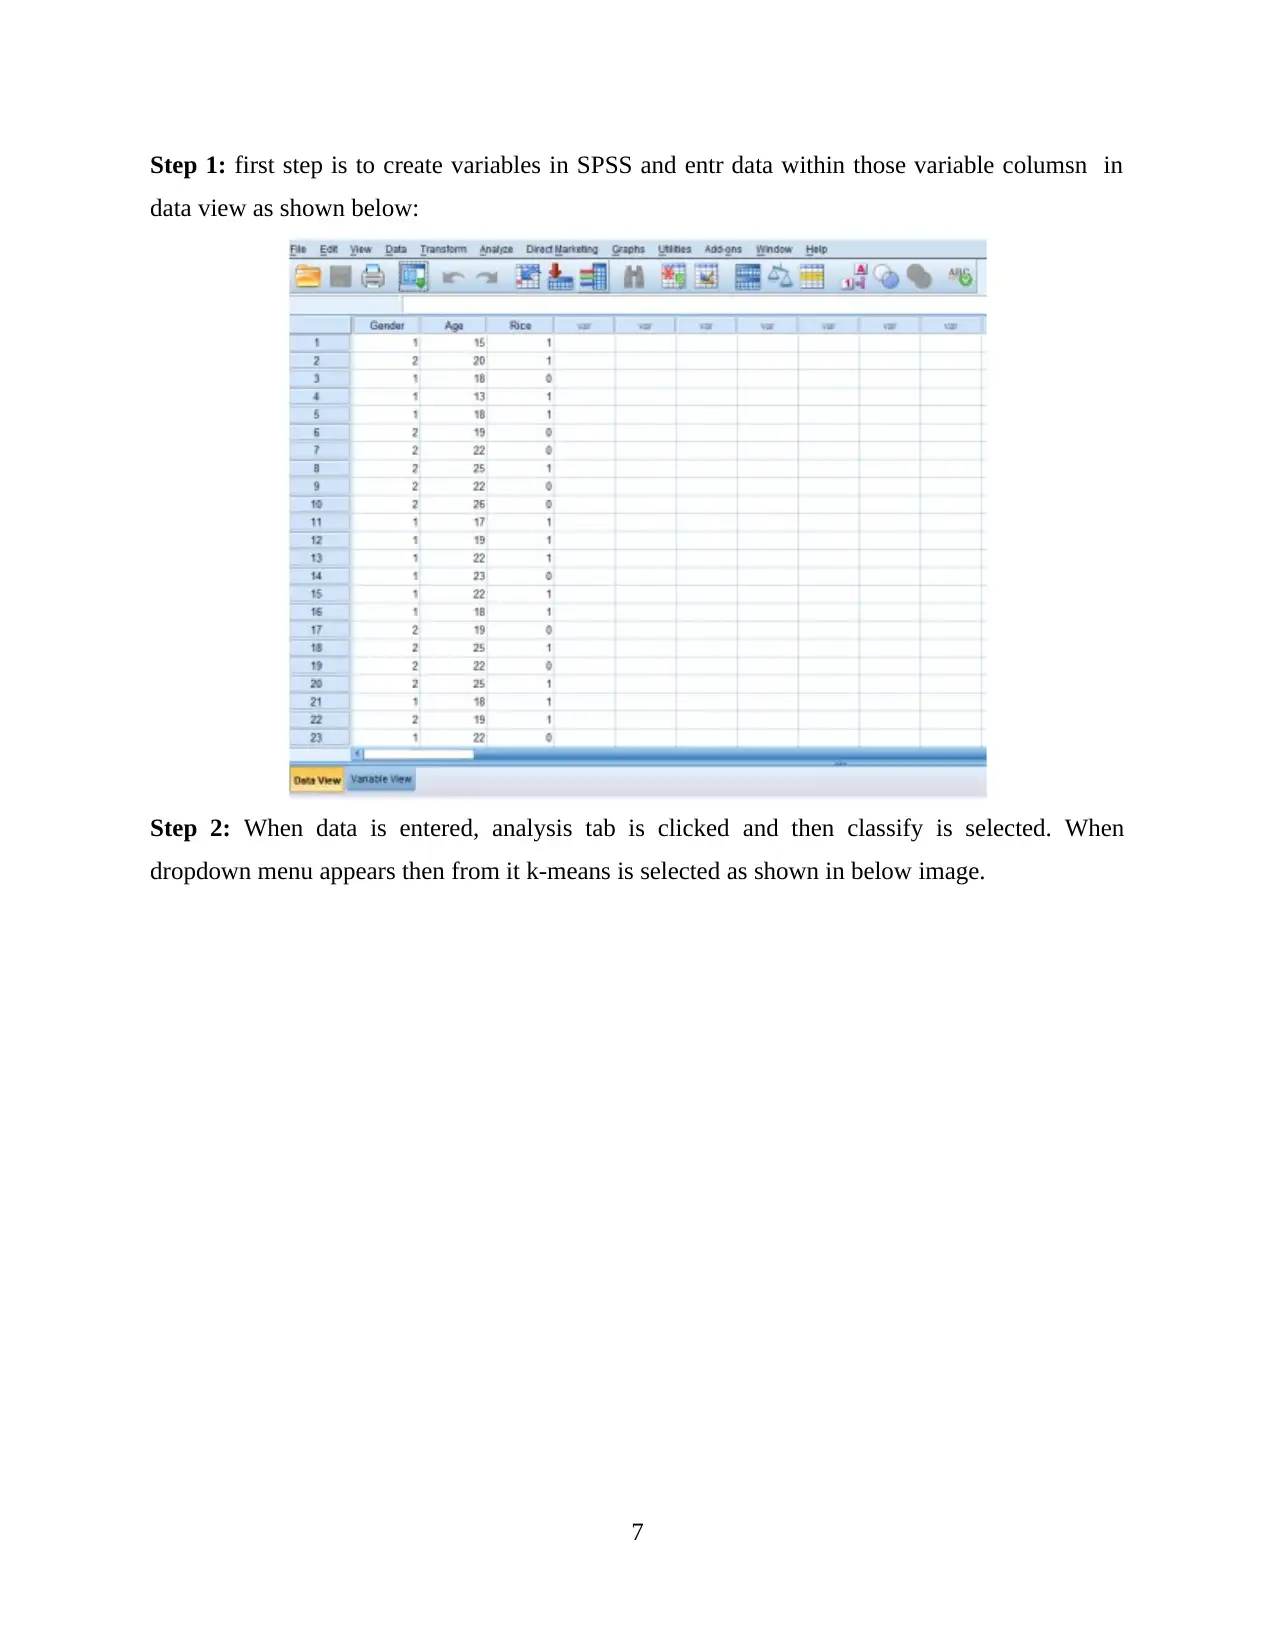
Step 1: first step is to create variables in SPSS and entr data within those variable columsn in
data view as shown below:
Step 2: When data is entered, analysis tab is clicked and then classify is selected. When
dropdown menu appears then from it k-means is selected as shown in below image.
7
data view as shown below:
Step 2: When data is entered, analysis tab is clicked and then classify is selected. When
dropdown menu appears then from it k-means is selected as shown in below image.
7
⊘ This is a preview!⊘
Do you want full access?
Subscribe today to unlock all pages.
Trusted by 1+ million students worldwide
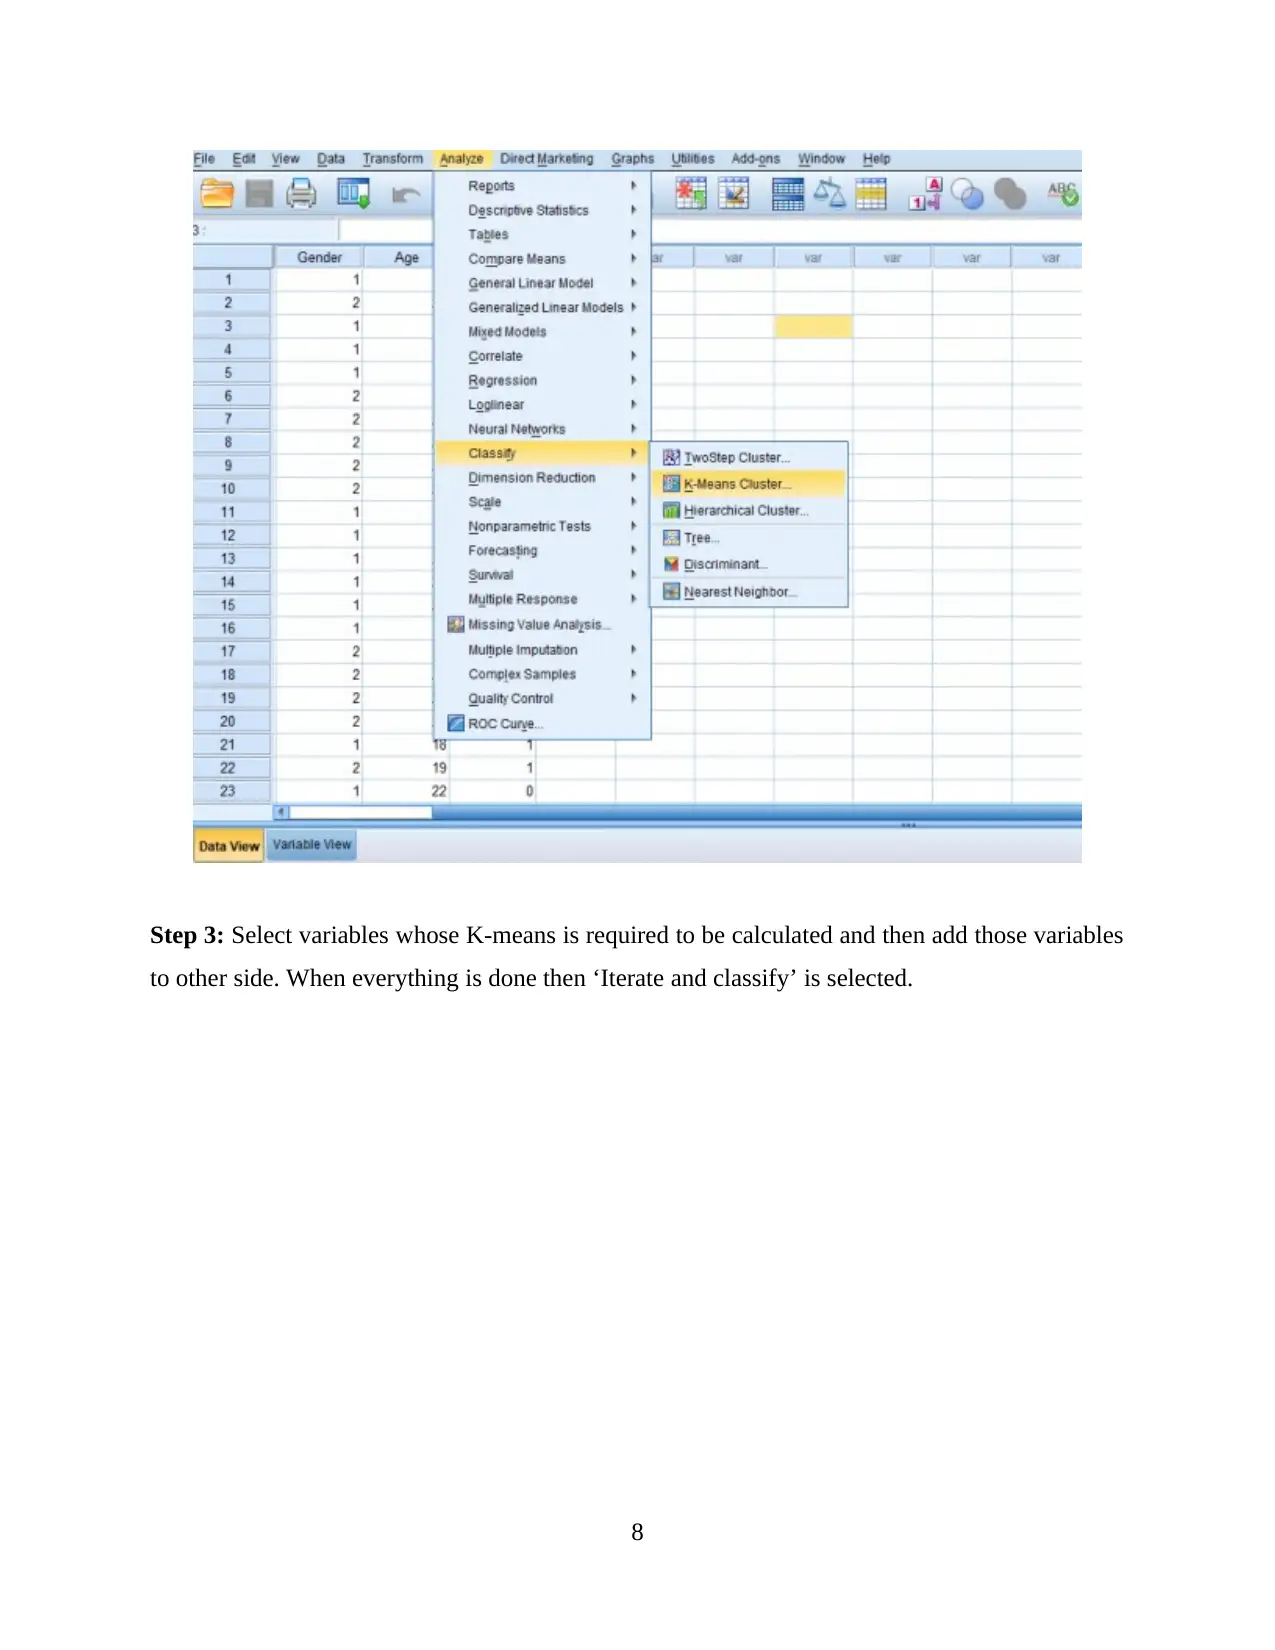
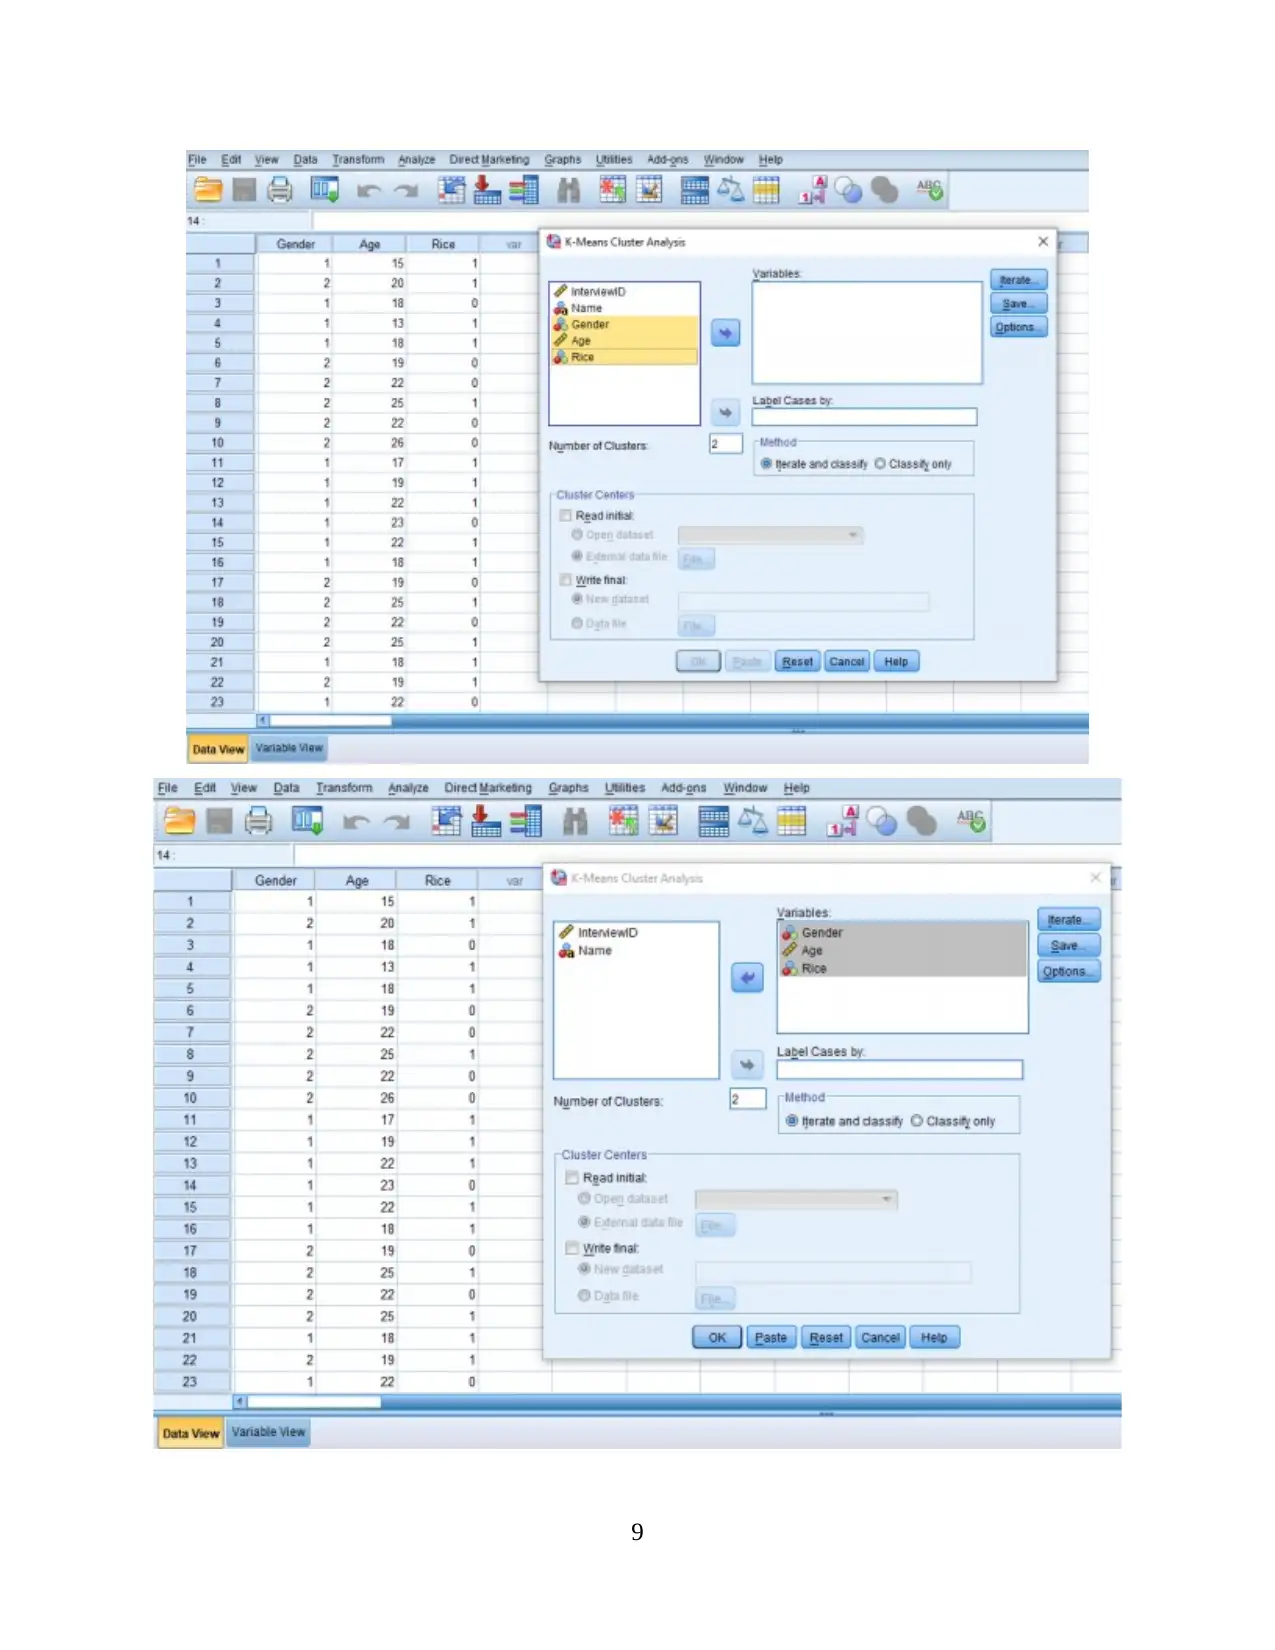
Step 3: Select variables whose K-means is required to be calculated and then add those variables
to other side. When everything is done then ‘Iterate and classify’ is selected.
8
to other side. When everything is done then ‘Iterate and classify’ is selected.
8
Paraphrase This Document
Need a fresh take? Get an instant paraphrase of this document with our AI Paraphraser
9
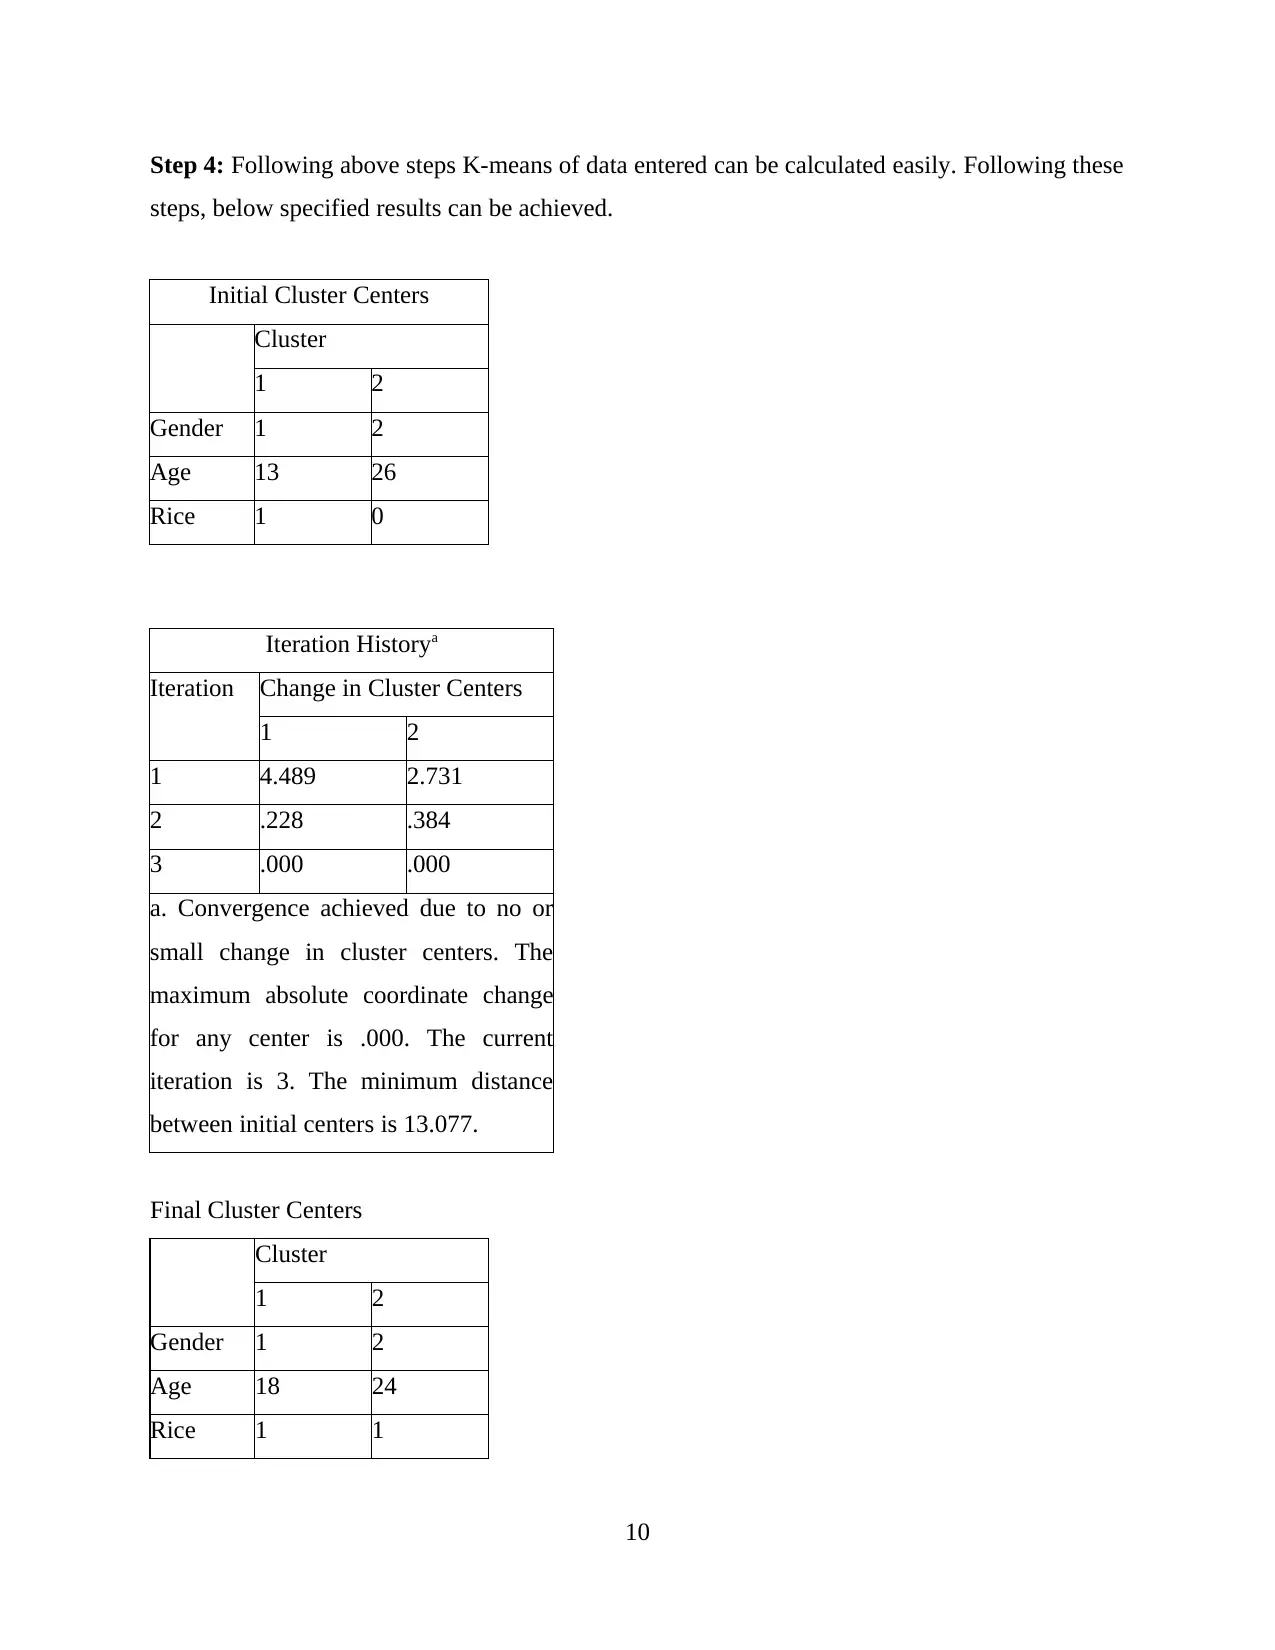
Step 4: Following above steps K-means of data entered can be calculated easily. Following these
steps, below specified results can be achieved.
Initial Cluster Centers
Cluster
1 2
Gender 1 2
Age 13 26
Rice 1 0
Iteration Historya
Iteration Change in Cluster Centers
1 2
1 4.489 2.731
2 .228 .384
3 .000 .000
a. Convergence achieved due to no or
small change in cluster centers. The
maximum absolute coordinate change
for any center is .000. The current
iteration is 3. The minimum distance
between initial centers is 13.077.
Final Cluster Centers
Cluster
1 2
Gender 1 2
Age 18 24
Rice 1 1
10
⊘ This is a preview!⊘
Do you want full access?
Subscribe today to unlock all pages.
Trusted by 1+ million students worldwide
1 out of 15
Related Documents


Your All-in-One AI-Powered Toolkit for Academic Success.
+13062052269
info@desklib.com
Available 24*7 on WhatsApp / Email
![[object Object]](/_next/static/media/star-bottom.7253800d.svg)
Unlock your academic potential
Copyright © 2020–2025 A2Z Services. All Rights Reserved. Developed and managed by ZUCOL.