Data Handling & Using ICT

Verified

Added on  2022/11/29

|11
|1013
|295
Presentation
AI Summary
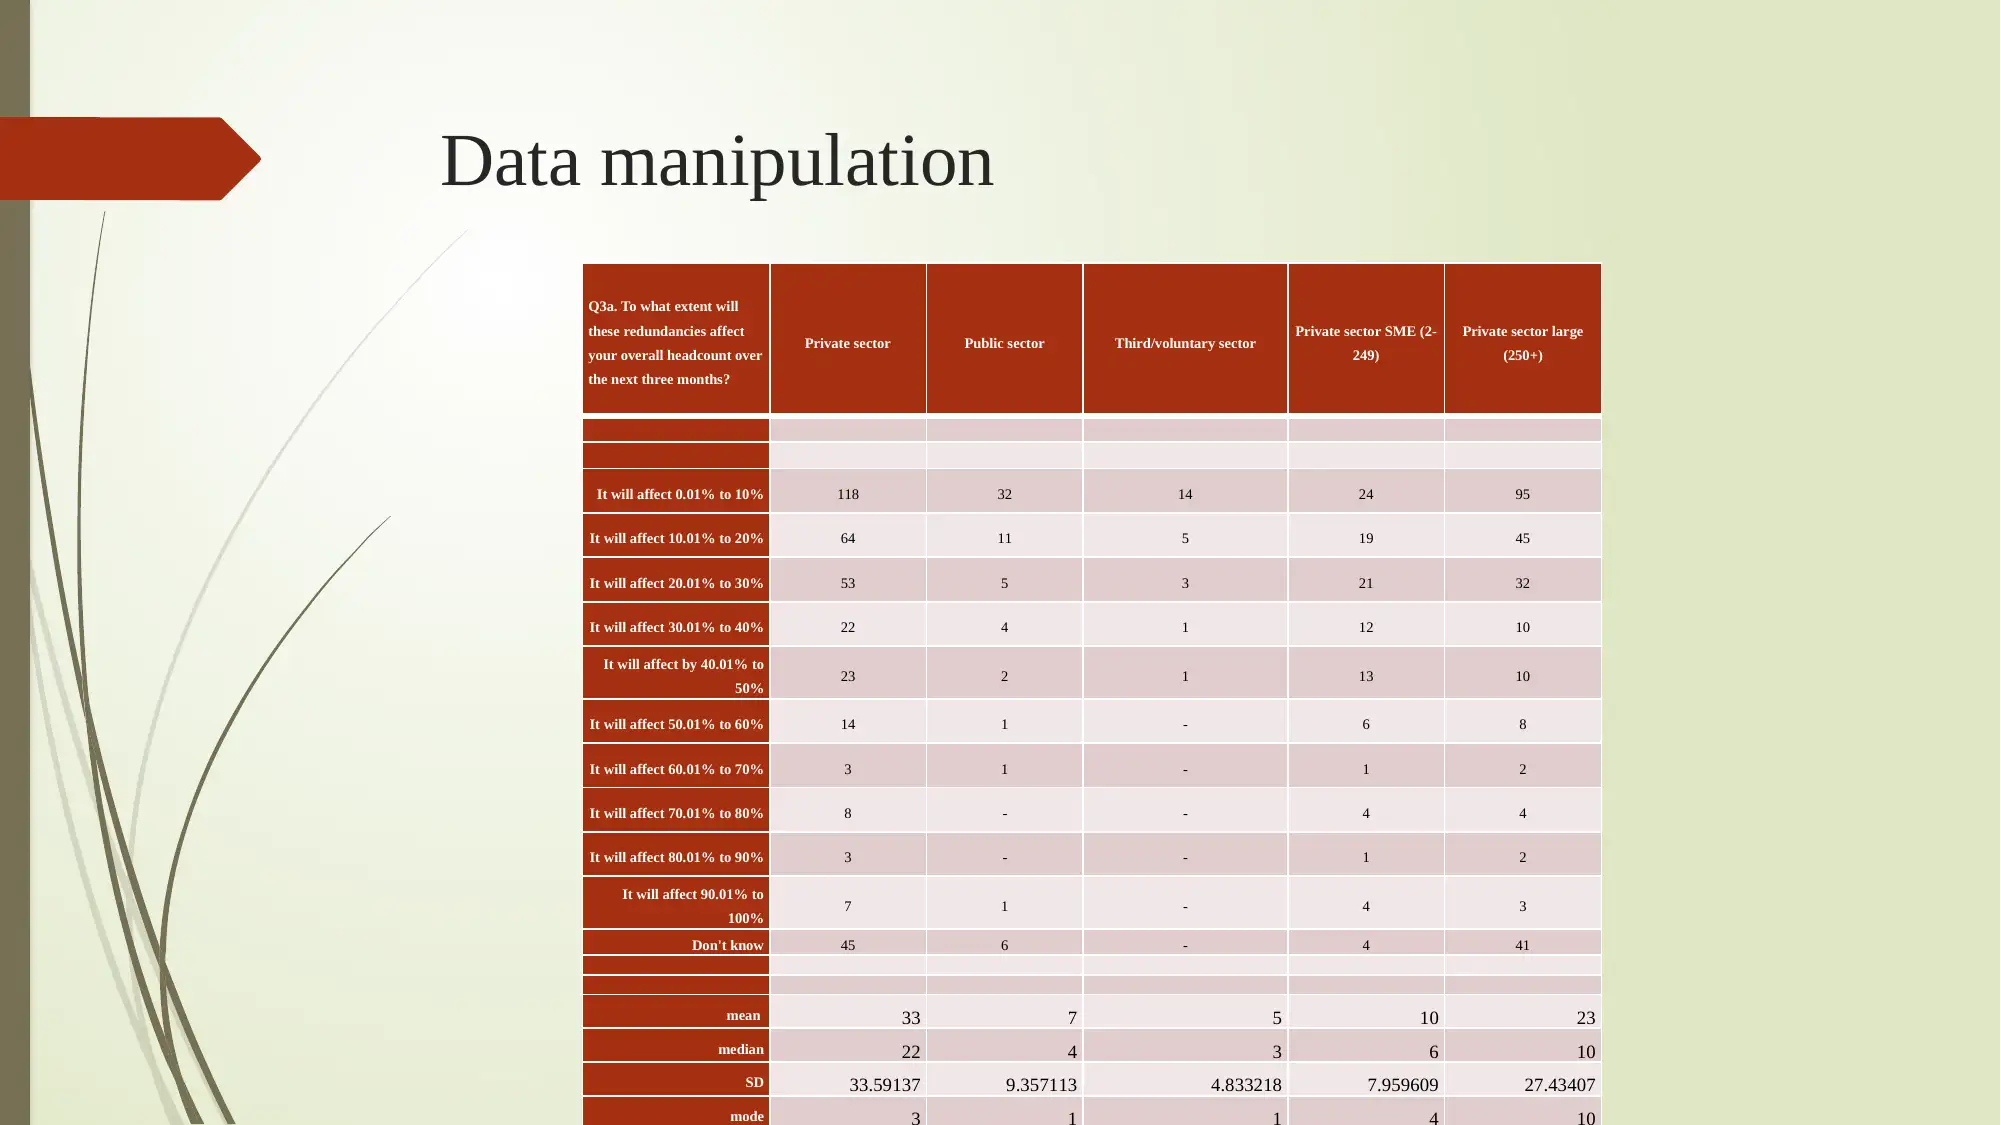
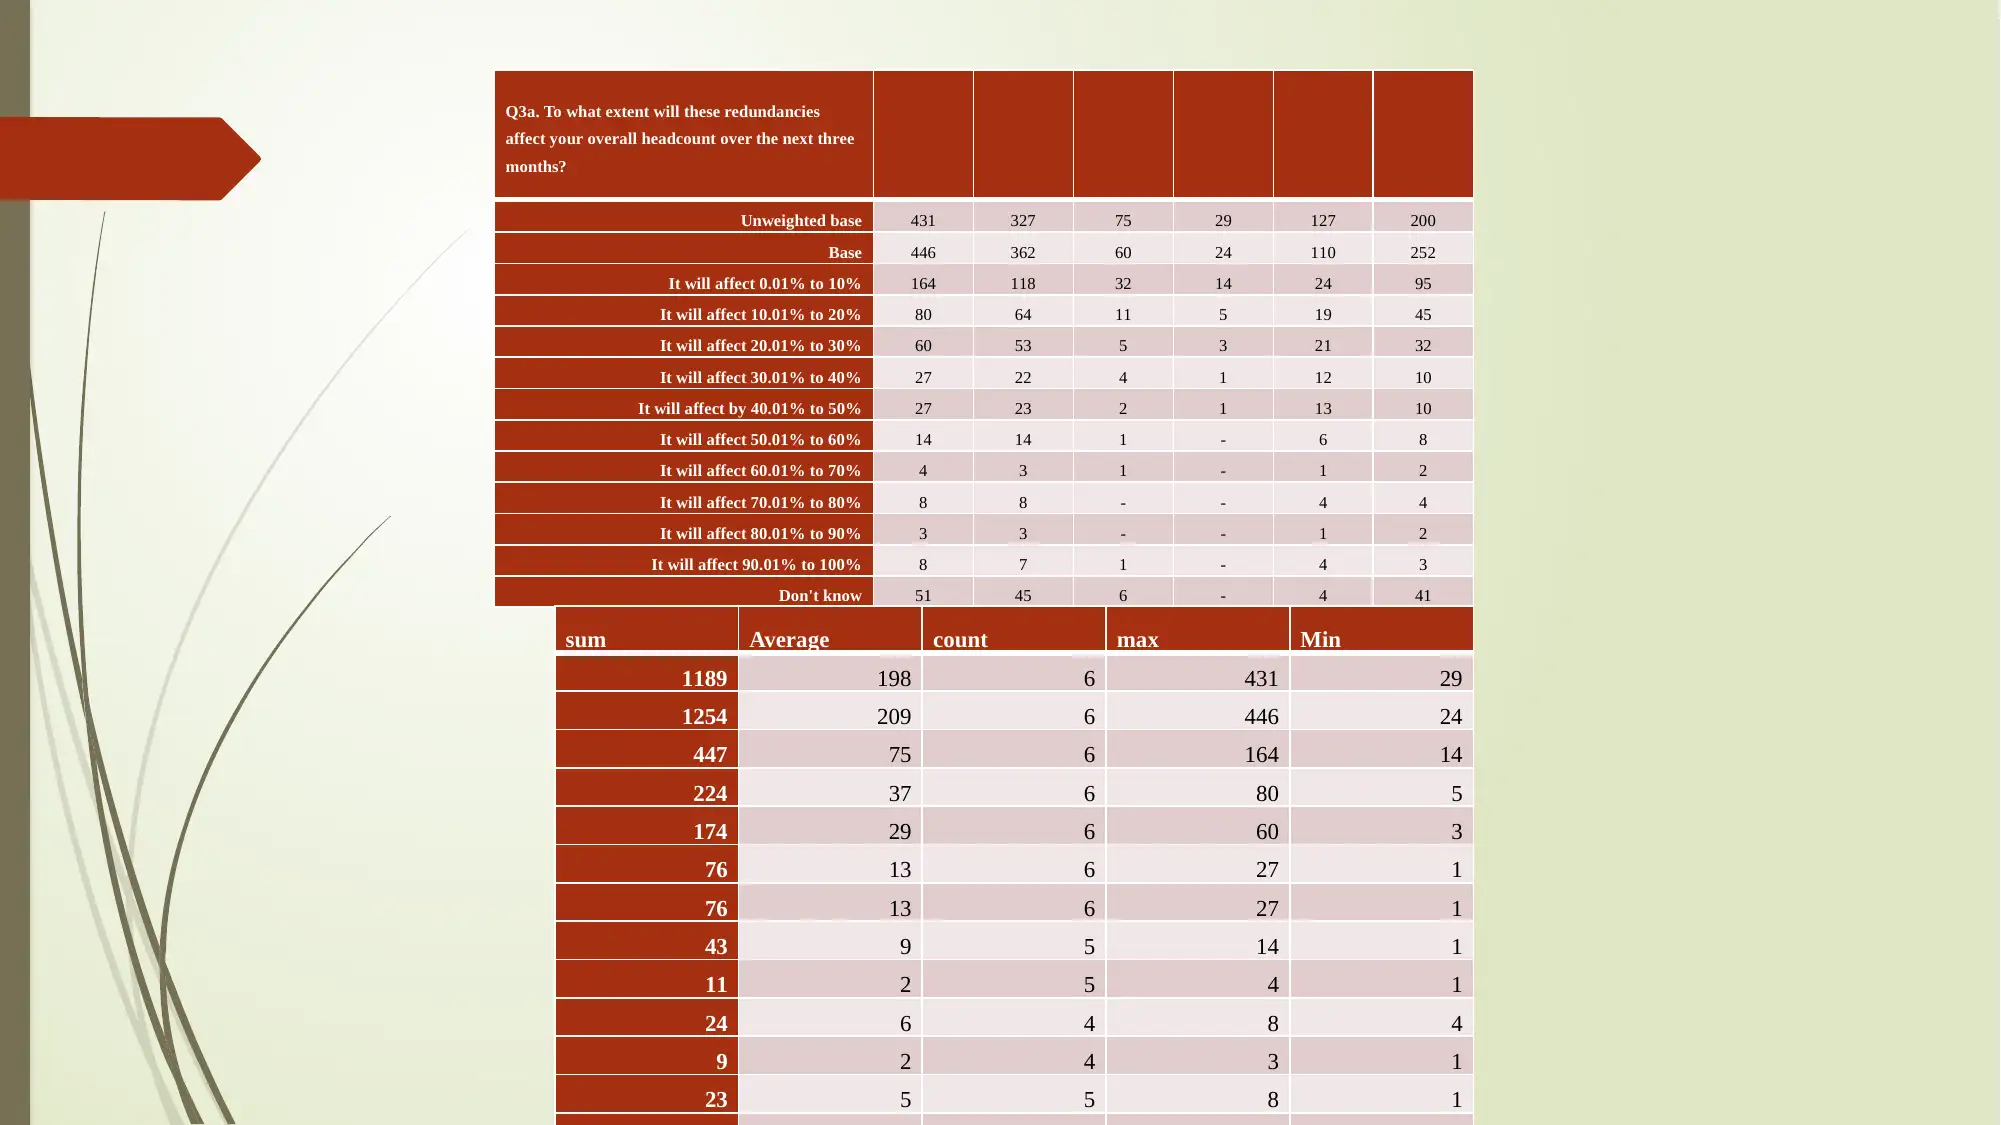
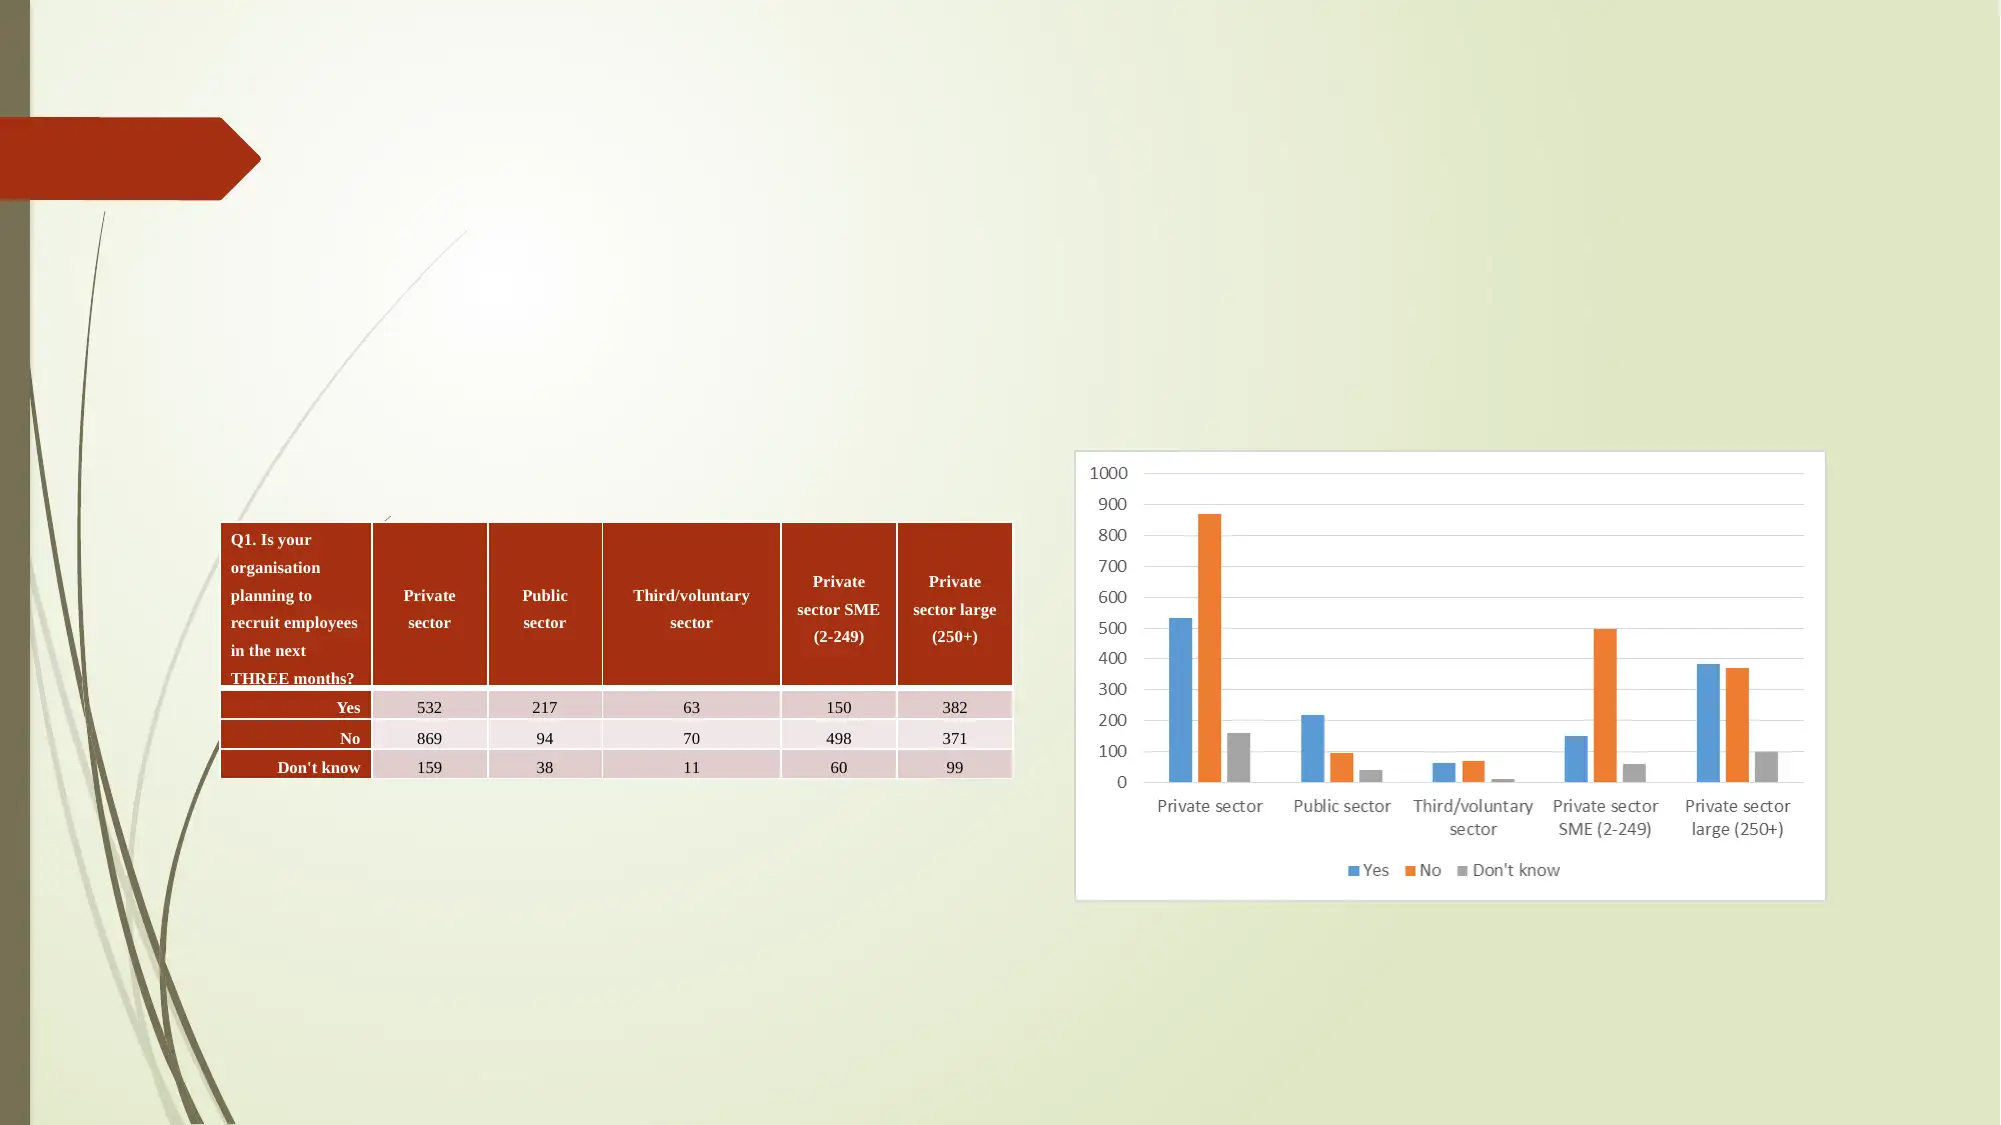
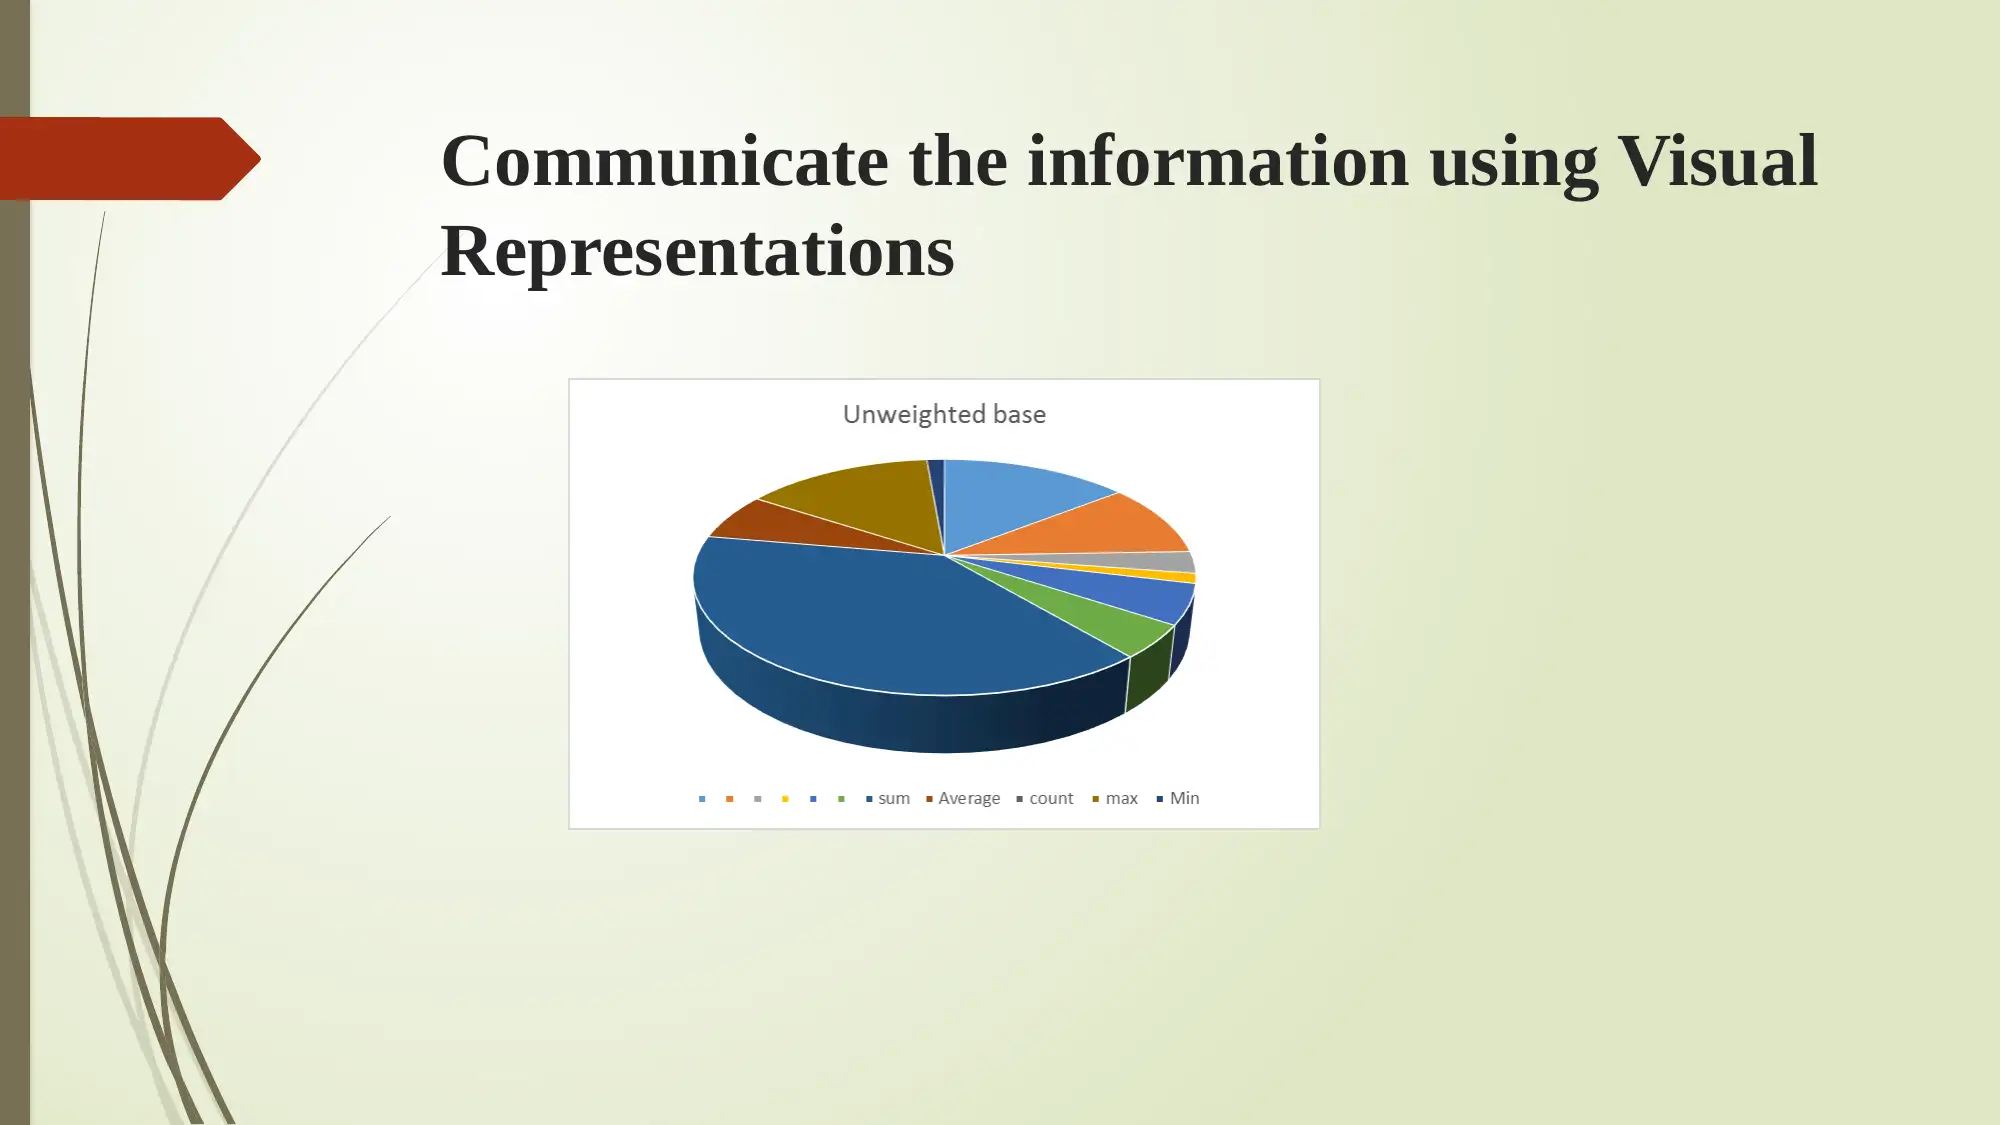
This presentation explores the topic of data handling and using ICT. It discusses the impact of Brexit on private and public organizations in the UK. Statistical techniques such as mean, median, and mode are explained. The presentation also covers data manipulation and its effects on organizations. Visual representations are used to communicate information. References are provided for further reading.
tabler-icon-diamond-filled.svg

Contribute Materials

Your contribution can guide someone’s learning journey. Share your documents today.
Document Page
Data Handling & Using ICT
tabler-icon-diamond-filled.svg

Secure Best Marks with AI Grader

Need help grading? Try our AI Grader for instant feedback on your assignments.
Document Page
Topic of understanding
The research topic is related to the impact of Brexit on private and public
organization and SME of UK. As per selecting the topic in order to perform the
mathematical data and manage or control in proper manner (Vivaudou, 2019).
the research topic is all about identify the any kind of planning redundancies during next
three months. These are directly affecting on the performance of Private and public
organization.
Document Page
Statistical Techniques
Mean- it is based on the concept in mathematics and statistics. The mean is that calculate
average or most common value in collection of numbers. In context of statistics, it can be
measured the central tendency of probability distribution among mode, median. For Data
set, the arithmetic means, also known as average (Dunbar, 2020).
Median – it is basically define the middle number of group of numbers. That is half of
number have identified the values which become greater than median, half the number
have values that are less than median (Grech, 2018).
Document Page
Cont..
Mode- it is another kind of technique which may consider values that appears most
frequently in a large data set (Schmidt, Church and Riley, 2020). This the best technique is
helping to measure central tendency which include mean, middle value in set.
tabler-icon-diamond-filled.svg

Secure Best Marks with AI Grader

Need help grading? Try our AI Grader for instant feedback on your assignments.
Document Page
Data manipulation
Q3a. To what extent will
these redundancies affect
your overall headcount over
the next three months?
Private sector Public sector Third/voluntary sector Private sector SME (2-
249)
Private sector large
(250+)
It will affect 0.01% to 10% 118 32 14 24 95
It will affect 10.01% to 20% 64 11 5 19 45
It will affect 20.01% to 30% 53 5 3 21 32
It will affect 30.01% to 40% 22 4 1 12 10
It will affect by 40.01% to
50% 23 2 1 13 10
It will affect 50.01% to 60% 14 1 - 6 8
It will affect 60.01% to 70% 3 1 - 1 2
It will affect 70.01% to 80% 8 - - 4 4
It will affect 80.01% to 90% 3 - - 1 2
It will affect 90.01% to
100% 7 1 - 4 3
Don't know 45 6 - 4 41
mean 33 7 5 10 23
median 22 4 3 6 10
SD 33.59137 9.357113 4.833218 7.959609 27.43407
mode
Document Page
Q3a. To what extent will these redundancies
affect your overall headcount over the next three
months?
Unweighted base 431 327 75 29 127 200
Base 446 362 60 24 110 252
It will affect 0.01% to 10% 164 118 32 14 24 95
It will affect 10.01% to 20% 80 64 11 5 19 45
It will affect 20.01% to 30% 60 53 5 3 21 32
It will affect 30.01% to 40% 27 22 4 1 12 10
It will affect by 40.01% to 50% 27 23 2 1 13 10
It will affect 50.01% to 60% 14 14 1 - 6 8
It will affect 60.01% to 70% 4 3 1 - 1 2
It will affect 70.01% to 80% 8 8 - - 4 4
It will affect 80.01% to 90% 3 3 - - 1 2
It will affect 90.01% to 100% 8 7 1 - 4 3
Don't know 51 45 6 - 4 41
sum Average count max Min
1189 198 6 431 29
1254 209 6 446 24
447 75 6 164 14
224 37 6 80 5
174 29 6 60 3
76 13 6 27 1
76 13 6 27 1
43 9 5 14 1
11 2 5 4 1
24 6 4 8 4
9 2 4 3 1
23 5 5 8 1
Document Page
Q1. Is your
organisation
planning to
recruit employees
in the next
THREE months?
Private
sector
Public
sector
Third/voluntary
sector
Private
sector SME
(2-249)
Private
sector large
(250+)
Yes 532 217 63 150 382
No 869 94 70 498 371
Don't know 159 38 11 60 99
tabler-icon-diamond-filled.svg

Paraphrase This Document

Need a fresh take? Get an instant paraphrase of this document with our AI Paraphraser
Document Page
Communicate the information using Visual
Representations
Document Page
Conclusions
From above discussion, it has been summarized about the concept of statistical
technique or method that help for calculating the accurate result and outcome. It has been
chosen the large data set about the Brexit where different public and private of SMEs
perform significant operations in UK. As per analysis, it has summarized that select
appropriate data for sampling, present raw data on spreadsheet and perform the excel
functions such as mean, median and mode. Furthermore, it has been described the
communication of information in order to represent into the form of different charts.
Document Page
REFERENCES
Book and Journals
Dunbar, L., 2020. The Other Part of the Job: Rapid Data Analysis with Excel and
Sheets. General Music Today. 33(2). pp.83-86.
Grech, V., 2018. WASP (Write a Scientific Paper) using Excel—1: Data entry and
validation. Early human development. 117. pp.98-103.
Schmidt, P.J., Church, K.S. and Riley, J., 2020. Clinging to Excel as a security blanket:
Investigating accountants' resistance to emerging data analytics technology. Journal of
Emerging Technologies in Accounting. 17(1). pp.33-39.
Vivaudou, M., 2019. eeFit: a Microsoft Excel-embedded program for interactive analysis
and fitting of experimental dose–response data. BioTechniques. 66(4). pp.186-193.
tabler-icon-diamond-filled.svg

Secure Best Marks with AI Grader

Need help grading? Try our AI Grader for instant feedback on your assignments.
Document Page
THANK YOU
chevron_up_icon
1 out of 11
circle_padding
hide_on_mobile
zoom_out_icon
[object Object]

Your All-in-One AI-Powered Toolkit for Academic Success.

Available 24*7 on WhatsApp / Email

[object Object]