MG413 Data Insights Presentation: Marketing Research and Analysis

Verified

Added on  2023/06/10

|16
|1116
|115
Presentation
AI Summary
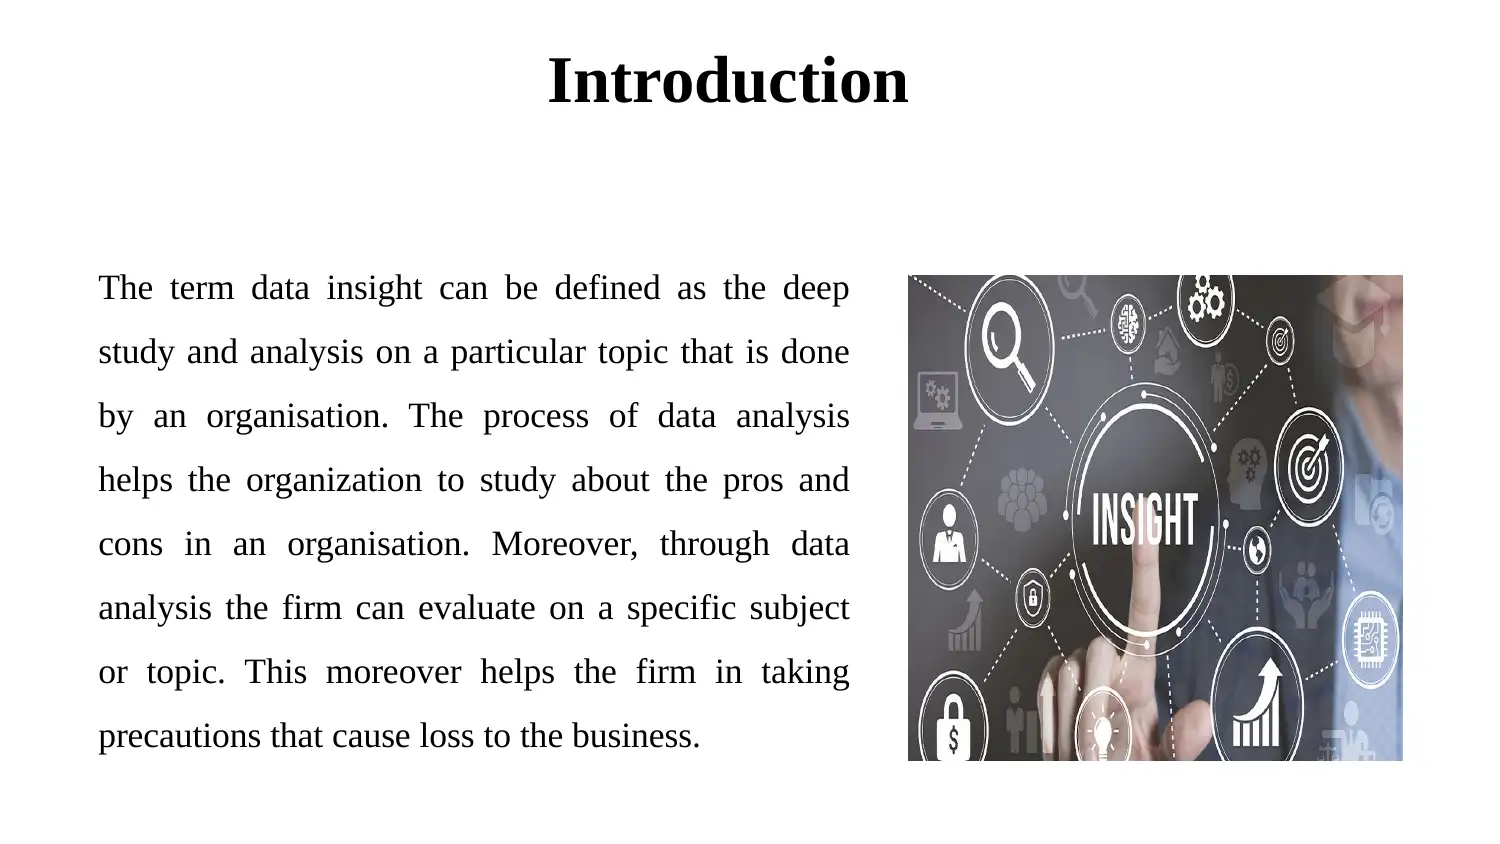
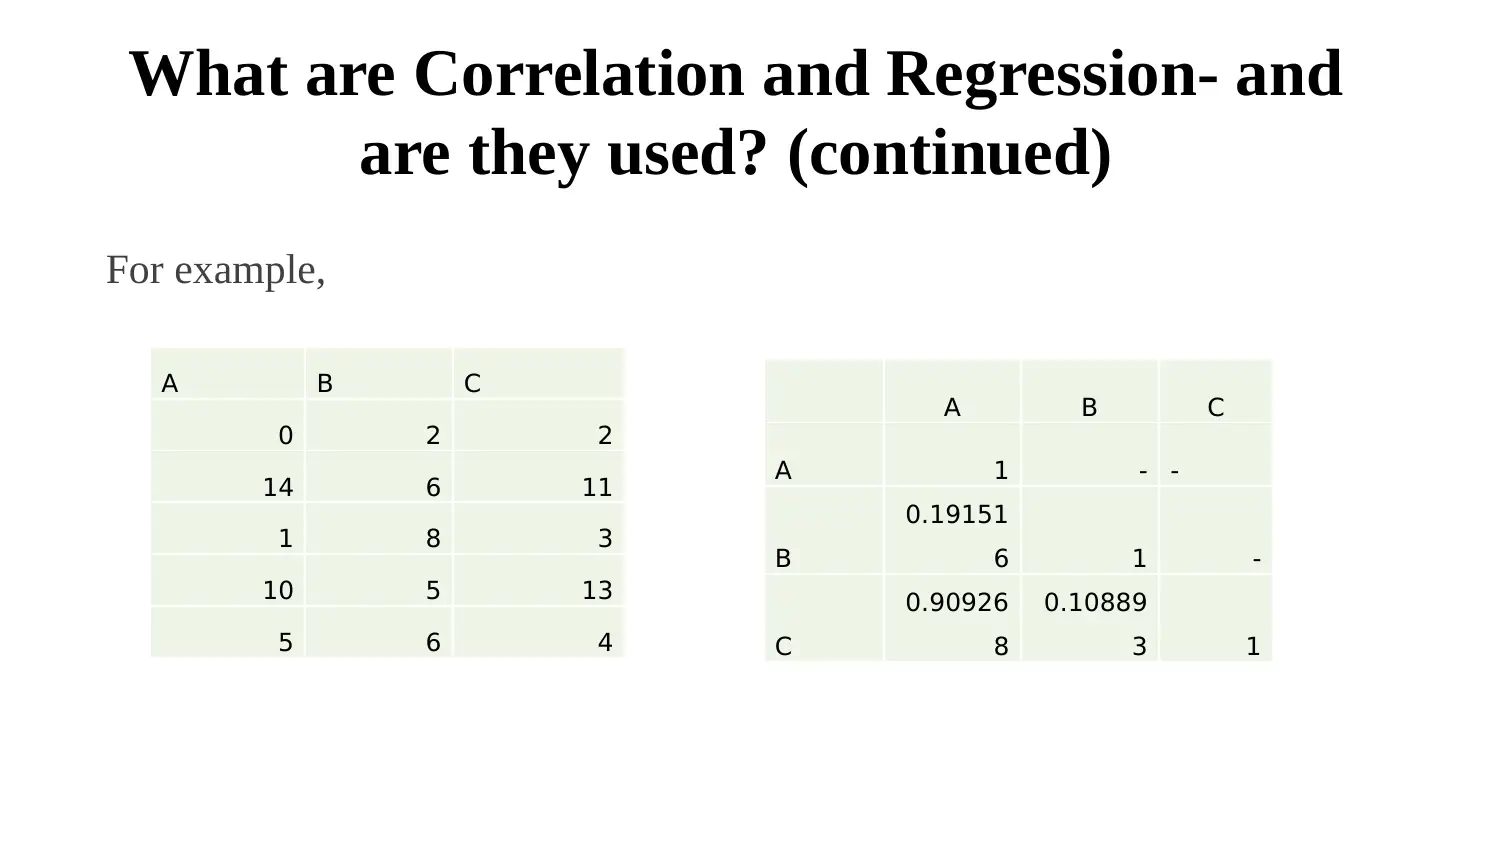
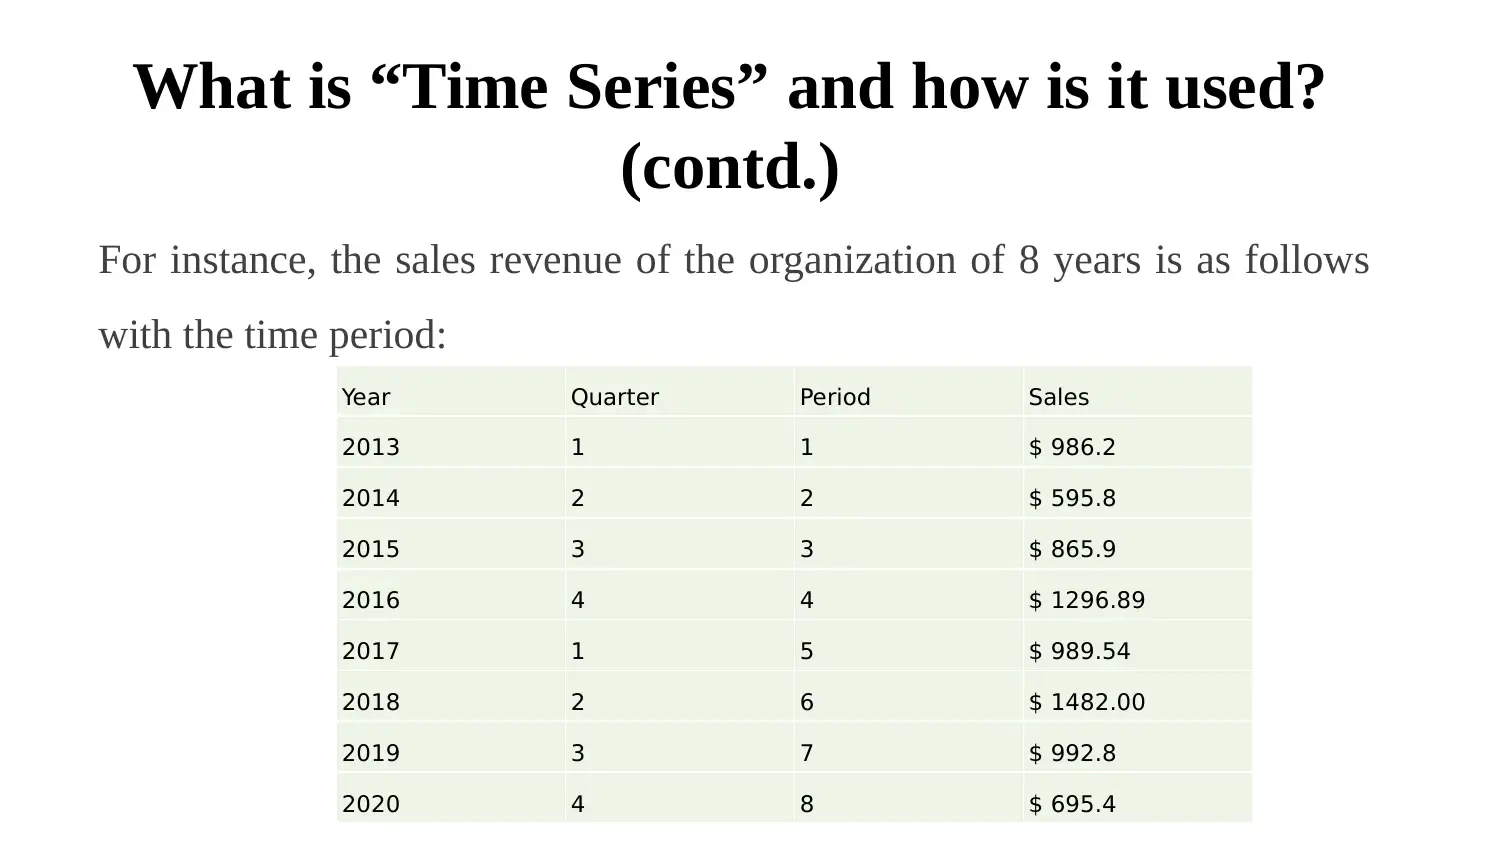
This presentation delves into the realm of data insights, crucial for informed decision-making in modern businesses. It begins by defining data insights as in-depth analyses used to evaluate organizational strengths and weaknesses, emphasizing the role of quantitative research, including methods like questionnaires and surveys, and explaining statistical tools such as mean, mode, and median. The presentation then explores qualitative research, highlighting its significance in understanding individual experiences and its impact on management decisions. It also discusses correlation and regression, explaining how they measure relationships between variables, and time series analysis, demonstrating how data is assessed over a period of time. Furthermore, it addresses the challenges of analyzing large datasets within correlation, regression, and time series frameworks, and outlines various data collection methods. The presentation concludes by summarizing the key concepts, emphasizing the interplay of qualitative and quantitative data in comprehensive data analysis.
Document Page
Data Insights
tabler-icon-diamond-filled.svg

Paraphrase This Document

Need a fresh take? Get an instant paraphrase of this document with our AI Paraphraser
Document Page
CONTENTS
INTRODUCTION
The role of quantitative research in modern marketing research and data
analysis
The role of qualitative research in modern marketing research and data analysis
What are Correlation and Regression- and are they used?
What is “Time Series” and how is it used?
Issues of Analysis Techniques of Correlation, Regression and Time Series
How are Data Collected and Used?
Conclusion-Summary
References List
Document Page
Introduction
The term data insight can be defined as the deep
study and analysis on a particular topic that is done
by an organisation. The process of data analysis
helps the organization to study about the pros and
cons in an organisation. Moreover, through data
analysis the firm can evaluate on a specific subject
or topic. This moreover helps the firm in taking
precautions that cause loss to the business.
Document Page
The role of quantitative research in modern
marketing research and data analysis
The quantitative data analysis can be understood as the numerical data analysis in
the business. The quantitative data would only deal with the numbers on any
matter in the firm. It also focuses on factual data of the subject matter. Moreover,
there are various methods that are used by the quantitative research. These
methods includes the questionnaire, offline or online survey, etc.
tabler-icon-diamond-filled.svg

Paraphrase This Document

Need a fresh take? Get an instant paraphrase of this document with our AI Paraphraser
Document Page
The role of quantitative research (cont.)
Mean- The mean is the average of all the
data that is collected by the researcher in
the research.
Mode- The mode is the maximum data
frequency that has arrived in the series.
Median- The term median can be
explained as the mid term of the set of
the data.
Document Page
The role of qualitative research in
modern marketing research and data
analysis
The qualitative research is the data can be gained through the methods of the research.
This can be understood as the data that does not include the numerical values in the data
series. Moreover, it also provides that how the individual experience the world. These
qualitative data is very important as this can also include the data that effects the
decision making power of the management of the company.
Document Page
The role of qualitative research (cont.)
There are various benefits of the qualitative research that is organised in a business
are as follows-
This helps in inventing new innovation as the new ideas can only be built by the
thoughts. Moreover, the ideas does not require any type of quantitative data to
think about it(Senthilnathan, 2019).
tabler-icon-diamond-filled.svg

Paraphrase This Document

Need a fresh take? Get an instant paraphrase of this document with our AI Paraphraser
Document Page
What are Correlation and Regression-
and are they used?
The term correlation explains a relation between the two variables in the data.
There are basically two dependent variables or two independent variables on
which the data can be correlate by the management. It can also be possible to co
relate one dependent and other independent variable in correlation. It basically
measures the two persistent factors that can be used in case of correlation.
Document Page
What are Correlation and Regression- and
are they used? (continued)
For example,
A B C
0 2 2
14 6 11
1 8 3
10 5 13
5 6 4
A B C
A 1 - -
B
0.19151
6 1 -
C
0.90926
8
0.10889
3 1
Document Page
What is “Time Series” and how is it used?
The time series can be explained as the assessment of the data series through a time
period. These data is collected by the researcher over a period of time. Moreover,
under the time series analysis, the data is analysed by keeping in mind the time
period. The time period would help the data to analyse its impact on the present
scenario in the market. Moreover, it does not take data randomly or inconsistently.
tabler-icon-diamond-filled.svg

Paraphrase This Document

Need a fresh take? Get an instant paraphrase of this document with our AI Paraphraser
Document Page
What is “Time Series” and how is it used?
(contd.)
For instance, the sales revenue of the organization of 8 years is as follows
with the time period:
Year Quarter Period Sales
2013 1 1 $ 986.2
2014 2 2 $ 595.8
2015 3 3 $ 865.9
2016 4 4 $ 1296.89
2017 1 5 $ 989.54
2018 2 6 $ 1482.00
2019 3 7 $ 992.8
2020 4 8 $ 695.4
Document Page
Issues of Analysis Techniques of
Correlation, Regression and Time Series
The above analysis of times series, correlation and regression can be understood
as the large data which is used in analysis. Moreover, the huge data can be used as
settling the choice of the essential data. Moreover, the Big Data mainly catches
the various information that is modern and executive which deals with the
difficulty in utilising the programs on strategies of data. These are the huge
information that is used to manage the firm.
chevron_up_icon
1 out of 16
circle_padding
hide_on_mobile
zoom_out_icon
[object Object]