Data Management for Decision Support.
VerifiedAdded on 2022/09/07
|21
|3110
|16
AI Summary
Contribute Materials
Your contribution can guide someone’s learning journey. Share your
documents today.

DATA MANAGEMENT FOR DECISION SUPPORT
Secure Best Marks with AI Grader
Need help grading? Try our AI Grader for instant feedback on your assignments.
Table of Contents
1. Introduction.......................................................................................................................1
2. Introduction of Dataset, Problems, and Methods..........................................................1
2.1 Dataset Description.......................................................................................................1
2.2 Description of Dataset Variables.................................................................................2
2.2.1 Dependent and Independent Variables................................................................2
2.3 Case Description............................................................................................................2
2.4 Software Requirement..................................................................................................3
3. Analytic Models.................................................................................................................3
3.1 Linear Regression..........................................................................................................3
3.1.1 Objectives Linear Regression...............................................................................3
3.1.2 Multiple Linear Regression Terminologies.........................................................3
3.1.3 Strength and Weaknesses of Linear Regression.................................................4
3.2 Artificial Neural Networks (ANN)...............................................................................4
3.2.1 Learning Process....................................................................................................4
3.2.2 Objectives of ANN.................................................................................................4
3.2.3 Concept of ANN.....................................................................................................5
3.2.4 Feed Forward Neural Network Description of Components.............................5
3.2.5 Description of Components: FFNN......................................................................5
3.2.6 Strengths and Weaknesses of ANN......................................................................6
4. Data Analysis and Results................................................................................................6
4.1 Data Randomization.....................................................................................................6
4.2 Splitting and Training...................................................................................................9
4.3 Multiple Linear Regression with Weka (MLR).......................................................10
4.4 Artificial Neural Network with Weka (ANN)...........................................................12
4.5 Observation of ANN Training Results......................................................................14
5. Evaluation........................................................................................................................16
5.1 Correlation Coefficient...............................................................................................16
5.2 Root Mean Squared Error (RMSE)..........................................................................16
5.3 Mean Absolute Error (MAE).....................................................................................16
5.4 Summary Result for both MLR and ANN................................................................16
6. Decision Support.............................................................................................................17
7. Conclusion.......................................................................................................................17
References...............................................................................................................................18
1. Introduction
Artificial neural network is commonly known as a computational model which works
and looks like the biological neural network's structure and functions (What is Artificial
Neural Network - Structure, Working, Applications, 2018). The neural networks could be
employed as a data analysis tools to forecast and predict depending on the historical data in a
data-driven Decision Support System. On the other hand, the neural networks could also be
viewed as the quantitative models for being utilized in the model-driven Decision Support
System.
The main objective of this project is to apply the data mining techniques to analyze
the real dataset and evaluate the results. This project uses BATS BRITISH AMERICAN
TOBACCO PLC ORD 25P dataset, and also takes help of linear regression and artificial
neural network method for evaluating the results with the assistance of Weka data mining
tool. Here, data analysis is used to explain and predict the selected real data and possible
phenomena behind it. Finally, it will analyze and summarize the results to provide effective
decision support and conclusion.
2. Introduction of Dataset, Problems, and Methods
2.1 Dataset Description
This project uses British American Tobacco PLC, a holding company dataset, where
the last five years data is selected (British American Tobacco p.l.c. (BATS.L), 2020). The
dataset is represented in the below figure.
1
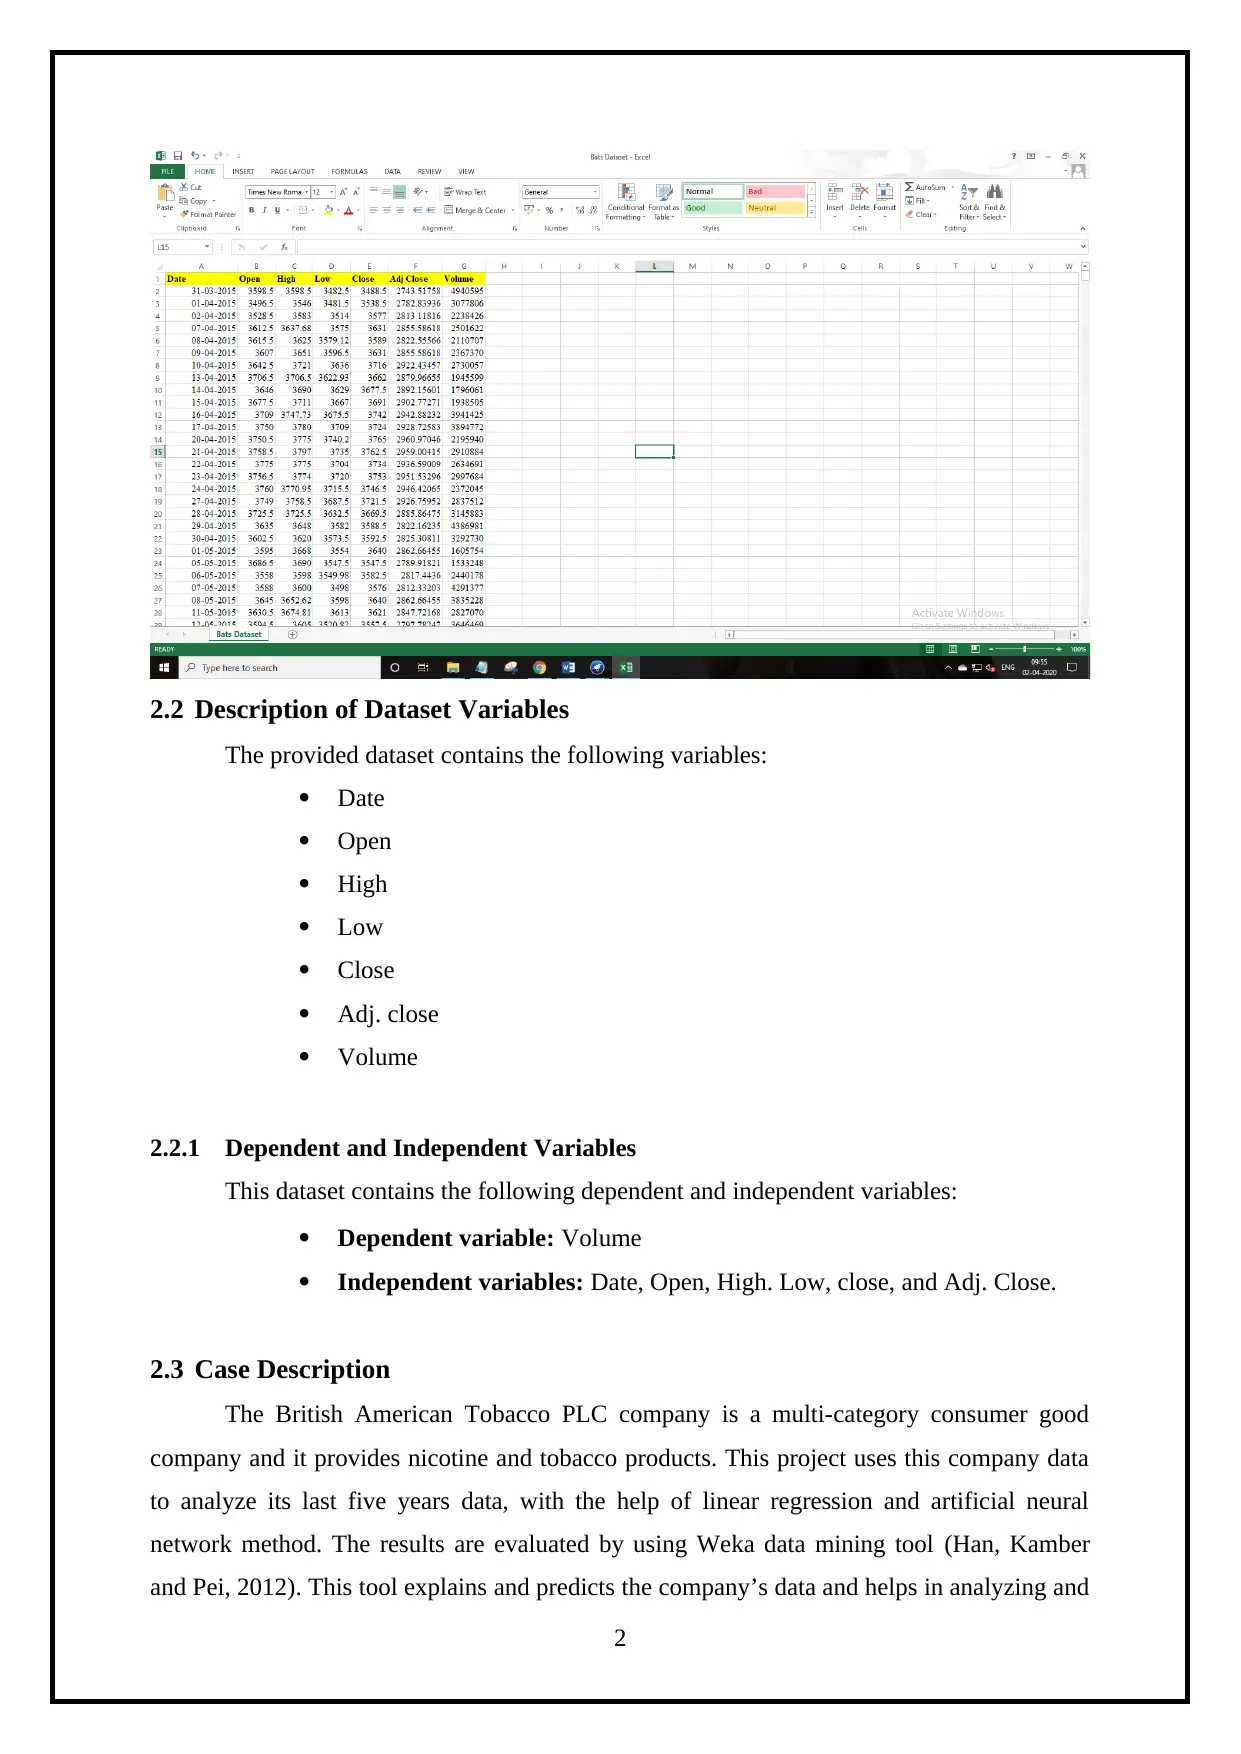
2.2 Description of Dataset Variables
The provided dataset contains the following variables:
Date
Open
High
Low
Close
Adj. close
Volume
2.2.1 Dependent and Independent Variables
This dataset contains the following dependent and independent variables:
Dependent variable: Volume
Independent variables: Date, Open, High. Low, close, and Adj. Close.
2.3 Case Description
The British American Tobacco PLC company is a multi-category consumer good
company and it provides nicotine and tobacco products. This project uses this company data
to analyze its last five years data, with the help of linear regression and artificial neural
network method. The results are evaluated by using Weka data mining tool (Han, Kamber
and Pei, 2012). This tool explains and predicts the company’s data and helps in analyzing and
2
Secure Best Marks with AI Grader
Need help grading? Try our AI Grader for instant feedback on your assignments.
summarizing the results to take effective decision support for improving the company’s
trading view.
2.4 Software Requirement
This project makes use of Weka tool, which is a data mining tool for analyzing the
selected data. Weka tools refers to a collection of machine learning algorithms used to
resolve the real-world data mining issues (Witten, Frank, Hall and Pal, 2017). This tool is
programmed in Java and executes on any platform. The algorithms could either be directly
applied to the dataset or it can be called using your Java code. It facilitates various tools for
data pre-processing, to implement various Machine Learning algorithms, and gives access of
visualization tools for developing machine learning techniques, which are applied on the real-
world data mining issues (Stahlbock, Abou-Nasr and Weiss, 2018).
3. Analytic Models
3.1 Linear Regression
3.1.1 Objectives Linear Regression
Linear regression models are used for prediction purpose, where the regression
models are used for the inference and prediction purpose. The predictive goal ensures to
evaluate the model’s performance on a validation set and for using the predictive metrics
(Xanthopoulos, Pardalos and Trafalis, 2013).
3.1.2 Multiple Linear Regression Terminologies
Multiple linear regression (MLR) is even called as a multiple regression, which is a
statistical technique utilizing various explanatory variables for predicting the response
variable’s outcome. MLR’s goal includes modeling linear relationship between the
explanatory (independent) variables and response (dependent) variable (Modern Machine
Learning Algorithms: Strengths and Weaknesses, 2019).
A simple linear regression denotes a function which permits an analyst or statistician
for making the predictions about one variable depending on the information known about the
other variables (Hastie, Friedman and Tisbshirani, 2017). Linear regression could just be
utilized when one contains two continuous variables—an independent variable and a
dependent variable. The independent variable refers to a parameter which is utilized for
calculating the outcome or the dependent variable.
3
3.1.3 Strength and Weaknesses of Linear Regression
Strengths:
It could be regularized for avoiding over fitting.
The linear models could be easily updated with new data with the help of
stochastic gradient descent.
Weaknesses:
Linear regression has poor performance, when there are non-linear relationships.
Linear regression lacks natural flexibility for capturing highly complicated patterns.
It is time consuming and tricky to add the right interaction terms or polynomials.
3.2 Artificial Neural Networks (ANN)
3.2.1 Learning Process
Learning rule or learning process of an Artificial neural network refers to a method,
mathematical logic or algorithm that improvises the performance and training time of
network. In general, this rule is frequently implemented on a network, by updating
the network levels of weights and bias when a network is simulated in a particular data
environment.
Learning rule might accept the present network conditions i.e., weights and biases, and
compares the expected results with the actual network results for providing new and
improved values for weights and bias (Introduction to Learning Rules in Neural Network,
2018). The learning rule addresses the factors which helps to decide how fast or accurately
the artificial network could be developed. For developing a network, it requires the following
three main machine learning models (Perner, 2015):
Unsupervised learning
Supervised learning
Reinforcement learning
3.2.2 Objectives of ANN
Artificial Neural Networks is abbreviated as ANN, and it is a computational model.
The following are the objectives of ANN:
1) This computational model is developed using the biological neural network’s
structures and functions, for better functioning. Though, the ANN’s structure
4

depends on the information flow, but the neural network’s changes depend on
the input and output.
2) It is possible to assume ANN to be a nonlinear statistical data, which refers to
a complex relationship defined between the input and output. Thus, various
different patterns can be found.
3.2.3 Concept of ANN
Neural networks can be referred as the parallel computing devices that tries to
develop a brain like functioning computer model. The major objectives of ANN includes
developing a system for performing different computational tasks, which are faster when
compared to the traditional systems. Such tasks comprises of data clustering, approximation,
pattern recognition, pattern classification, and optimization.
3.2.4 Feed Forward Neural Network Description of Components
In this network, the information flow is considered to be unidirectional. A unit is just
utilized for sending the information to other unit which don’t actually receive any kind of
information. On the other hand, it doesn’t contain any feedback loops. But, it is utilized for
pattern recognition, and has fixed inputs and outputs.
3.2.5 Description of Components: FFNN
Feedforward neural network (FFNN) refers to a machine learning classification
algorithm, which comprises of organized layers that looks just like the human neuron
processing units. In FFNN, each unit of a layer is linked with the rest of its units. These
layer’s connections with the units are not equal, due to varying weight or strength of each
connection. The network connection’s weight measures the potential amount of network
5
Paraphrase This Document
Need a fresh take? Get an instant paraphrase of this document with our AI Paraphraser
knowledge. Moreover, the NN units are even referred as the nodes. In a network, information
processing contains data entry from the input units and passes via network, and flows from
one layer to the other layer till it reaches the output units.
3.2.6 Strengths and Weaknesses of ANN
The strengths of ANN are listed below (M. Mijwil, 2018):
It has the capacity of storing information of complete network.
It is capable of working with incomplete knowledge/information.
It has fault tolerance.
It contains a distributed memory.
It ensures gradual corruption.
It has the capacity of making machine learning.
Also, it has the capability of parallel processing.
The weaknesses of ANN are listed below (Artificial Neural Networks Advantages and
Disadvantages, 2020):
It has hardware dependency.
It also experiences unexplained network behaviour.
It can determine a proper network structure.
It faces issues to show the network problem.
The network duration is not known.
4. Data Analysis and Results
4.1 Data Randomization
For data analysis, firstly carry out data randomization. To perform data randomization
utilize the following steps:
First, open the data on Weka as demonstrated in the below screenshot (Kaluza, 2013).
6
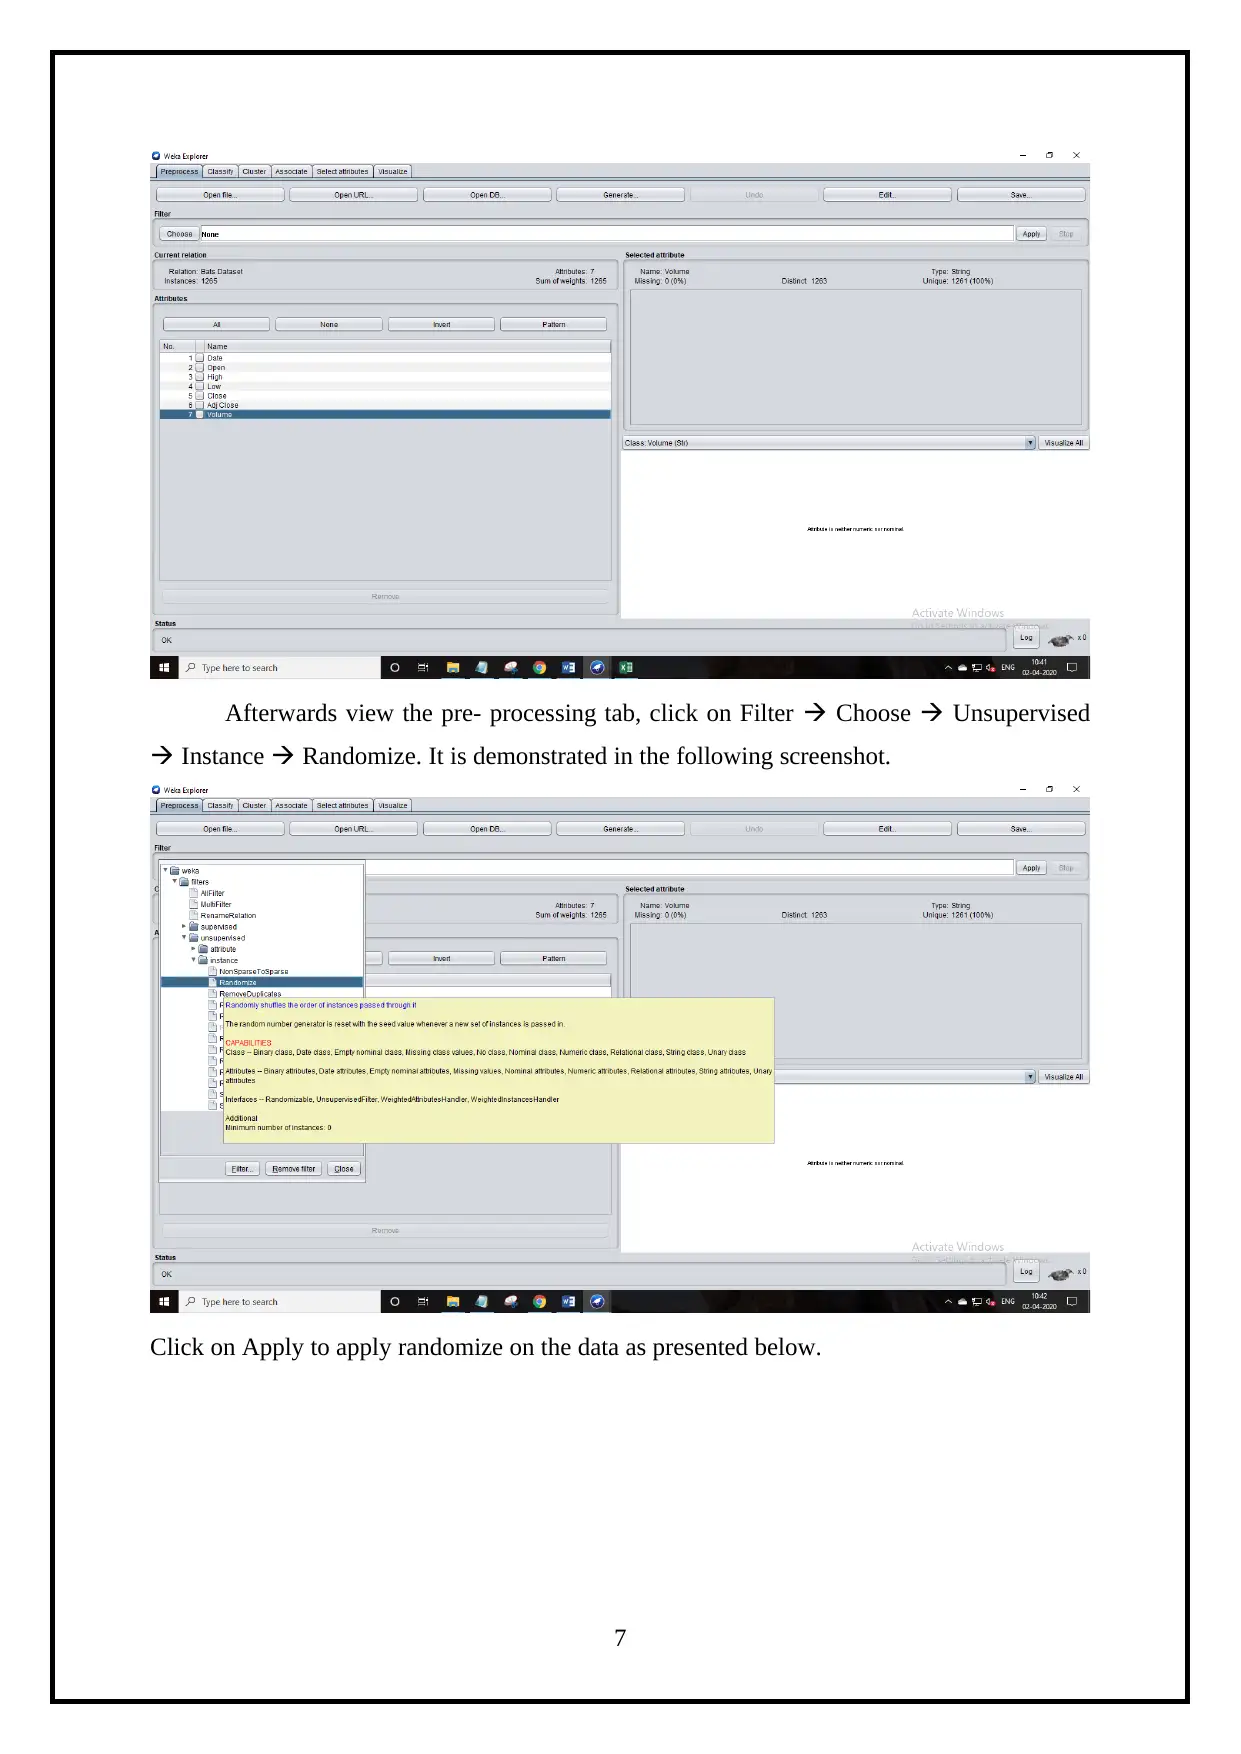
Afterwards view the pre- processing tab, click on Filter Choose Unsupervised
Instance Randomize. It is demonstrated in the following screenshot.
Click on Apply to apply randomize on the data as presented below.
7
Instance Randomize. It is demonstrated in the following screenshot.
Click on Apply to apply randomize on the data as presented below.
7

Next, convert all the strings to nominal for all the string attributes by clicking on
Filter Choose Unsupervised Attributes String to Nominal. This process is
demonstrated in the below screenshot.
8
Filter Choose Unsupervised Attributes String to Nominal. This process is
demonstrated in the below screenshot.
8
Secure Best Marks with AI Grader
Need help grading? Try our AI Grader for instant feedback on your assignments.

4.2 Splitting and Training
For Training set,
Click on Filter Choose Unsupervised Instance Remove percentage. Here,
enter remove percentage as 60.0. This step is demonstrated in the following screenshot.
For Testing set,
9
For Training set,
Click on Filter Choose Unsupervised Instance Remove percentage. Here,
enter remove percentage as 60.0. This step is demonstrated in the following screenshot.
For Testing set,
9

Click on Filter Choose unsupervised instance remove percentage. Invert
selection as true and then save the file as Testing Data set.
Open the training data set, perform linear regression and artificial neural network.
4.3 Multiple Linear Regression with Weka (MLR)
To perform multiple linear regression on Weka click on Classify Functions
Linear regression as shown below (Mavroforakis, 2011).
10
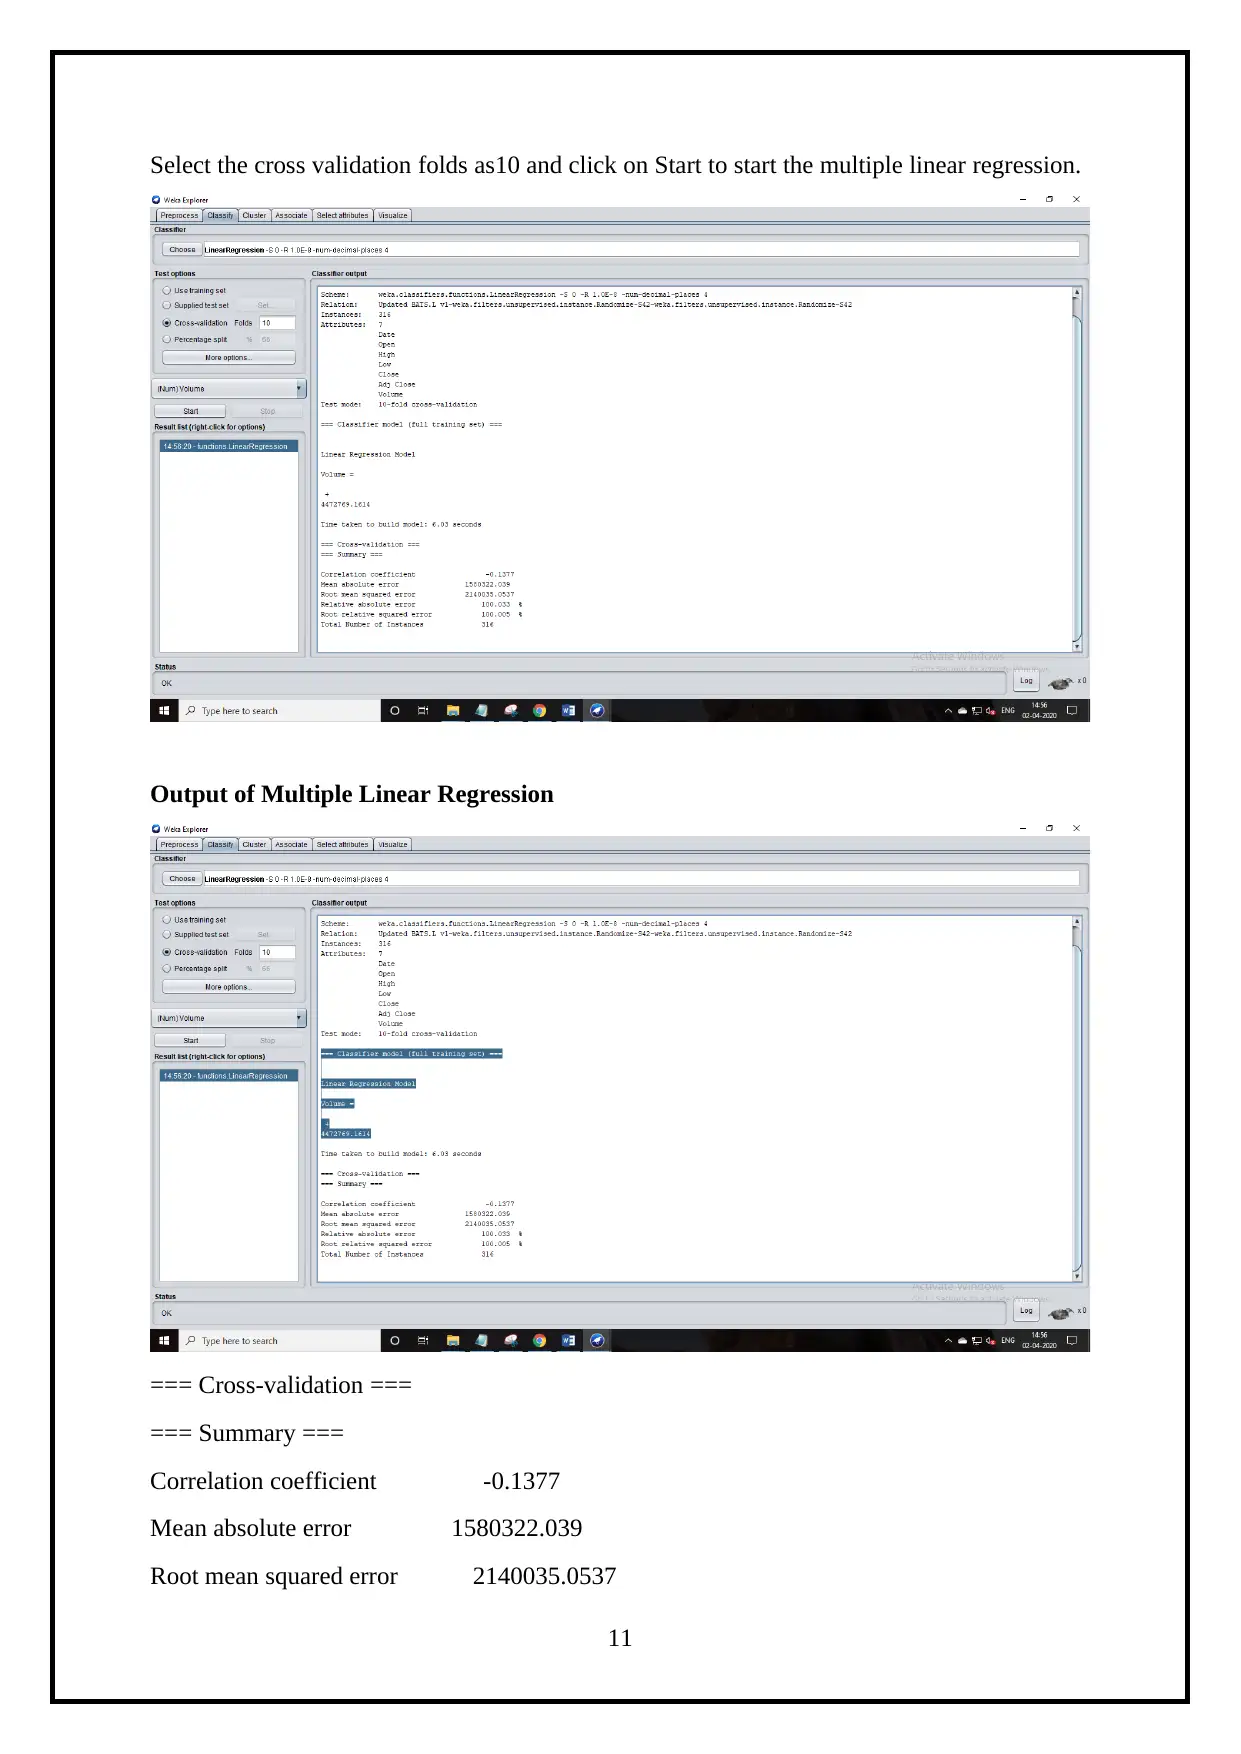
Select the cross validation folds as10 and click on Start to start the multiple linear regression.
Output of Multiple Linear Regression
=== Cross-validation ===
=== Summary ===
Correlation coefficient -0.1377
Mean absolute error 1580322.039
Root mean squared error 2140035.0537
11
Output of Multiple Linear Regression
=== Cross-validation ===
=== Summary ===
Correlation coefficient -0.1377
Mean absolute error 1580322.039
Root mean squared error 2140035.0537
11
Paraphrase This Document
Need a fresh take? Get an instant paraphrase of this document with our AI Paraphraser
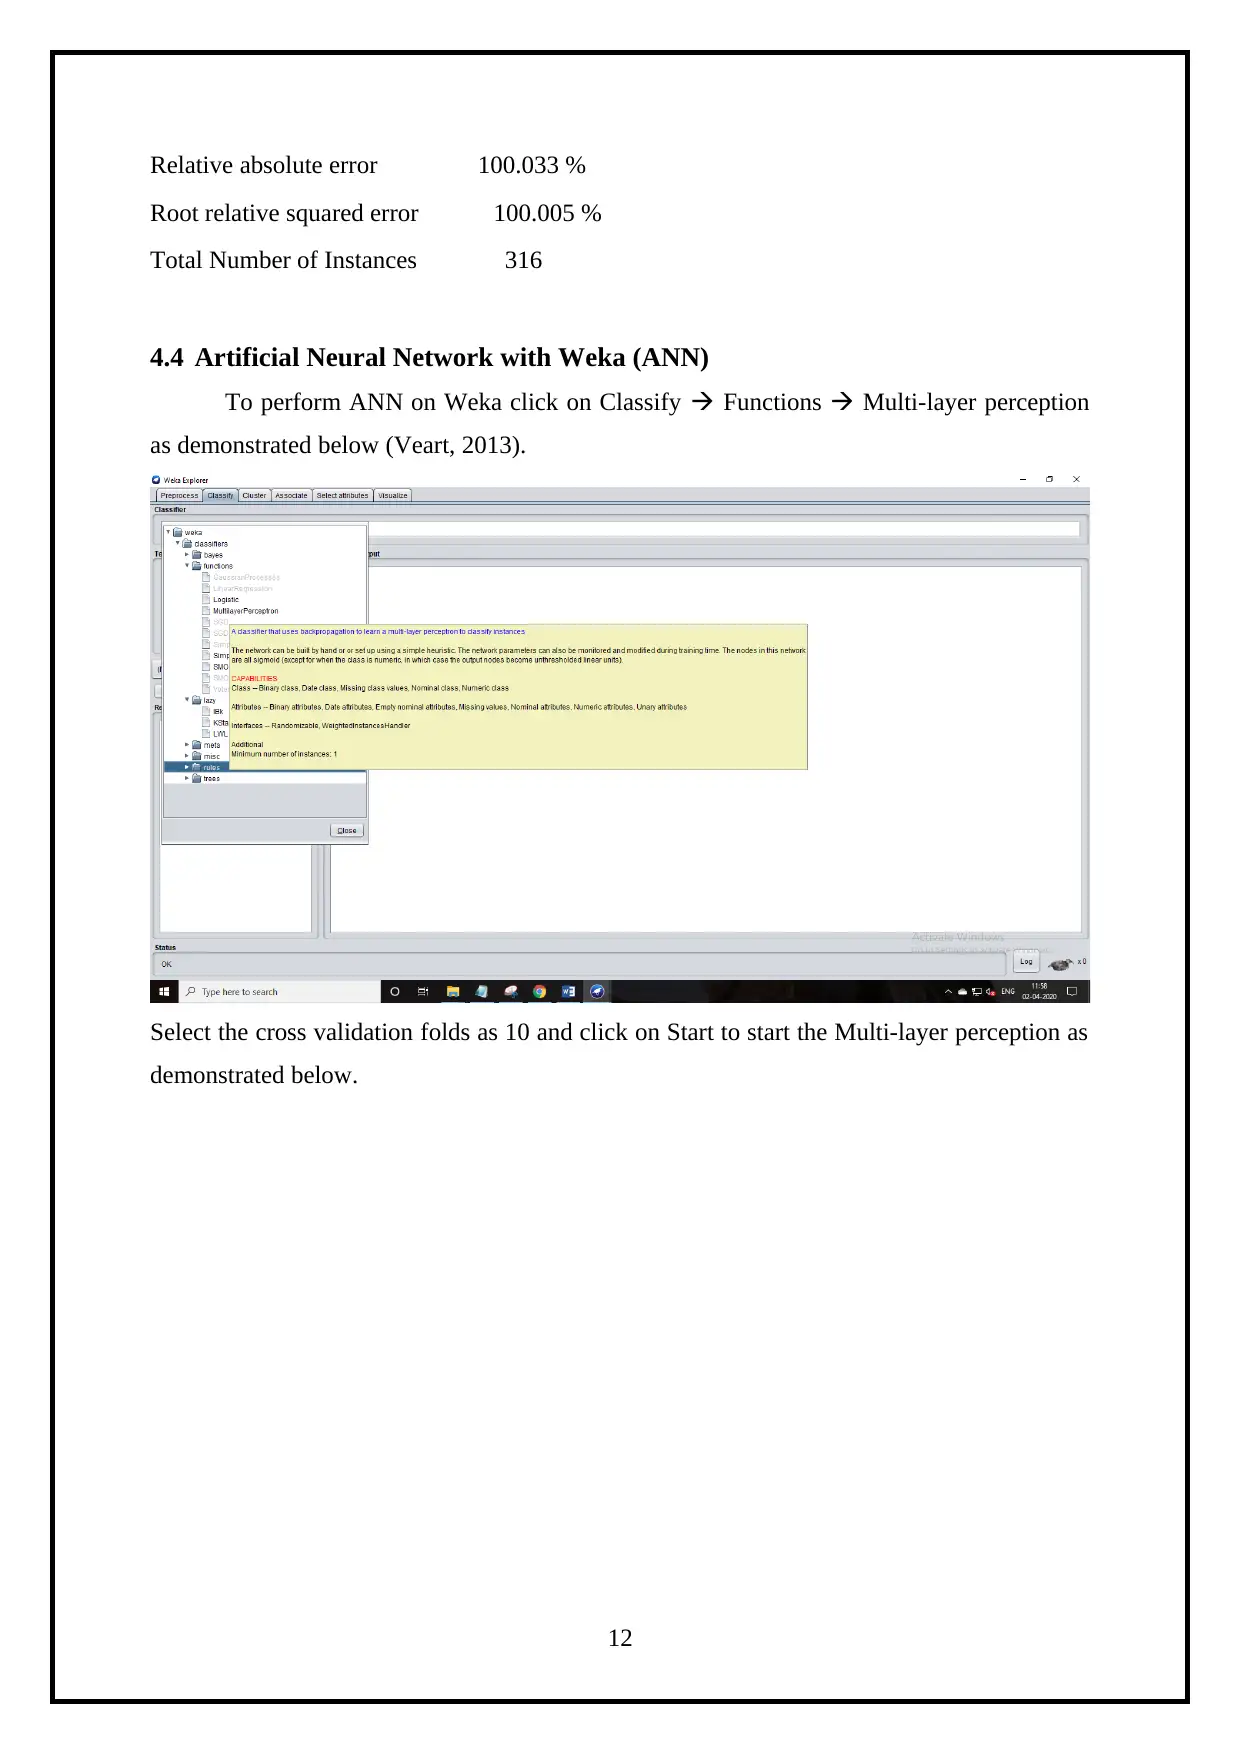
Relative absolute error 100.033 %
Root relative squared error 100.005 %
Total Number of Instances 316
4.4 Artificial Neural Network with Weka (ANN)
To perform ANN on Weka click on Classify Functions Multi-layer perception
as demonstrated below (Veart, 2013).
Select the cross validation folds as 10 and click on Start to start the Multi-layer perception as
demonstrated below.
12
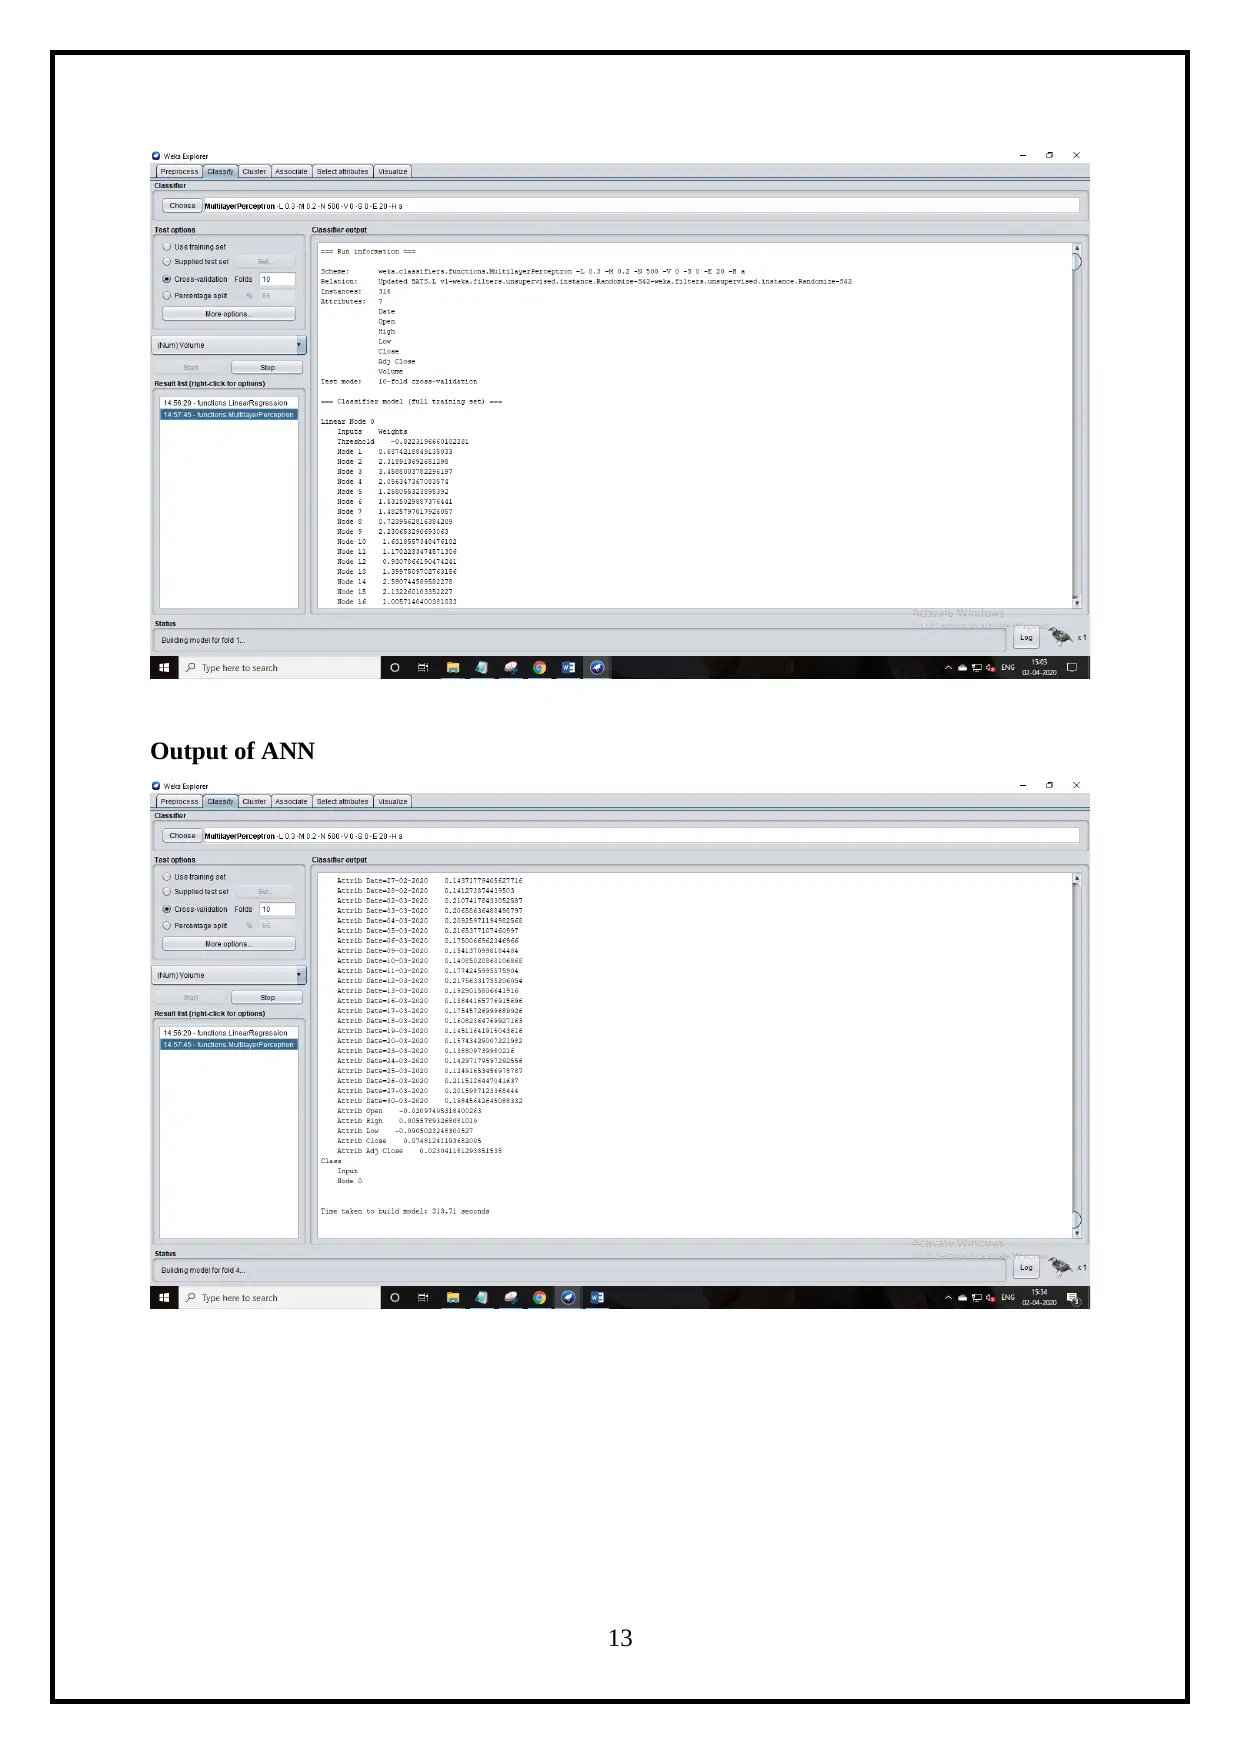
Output of ANN
13
13
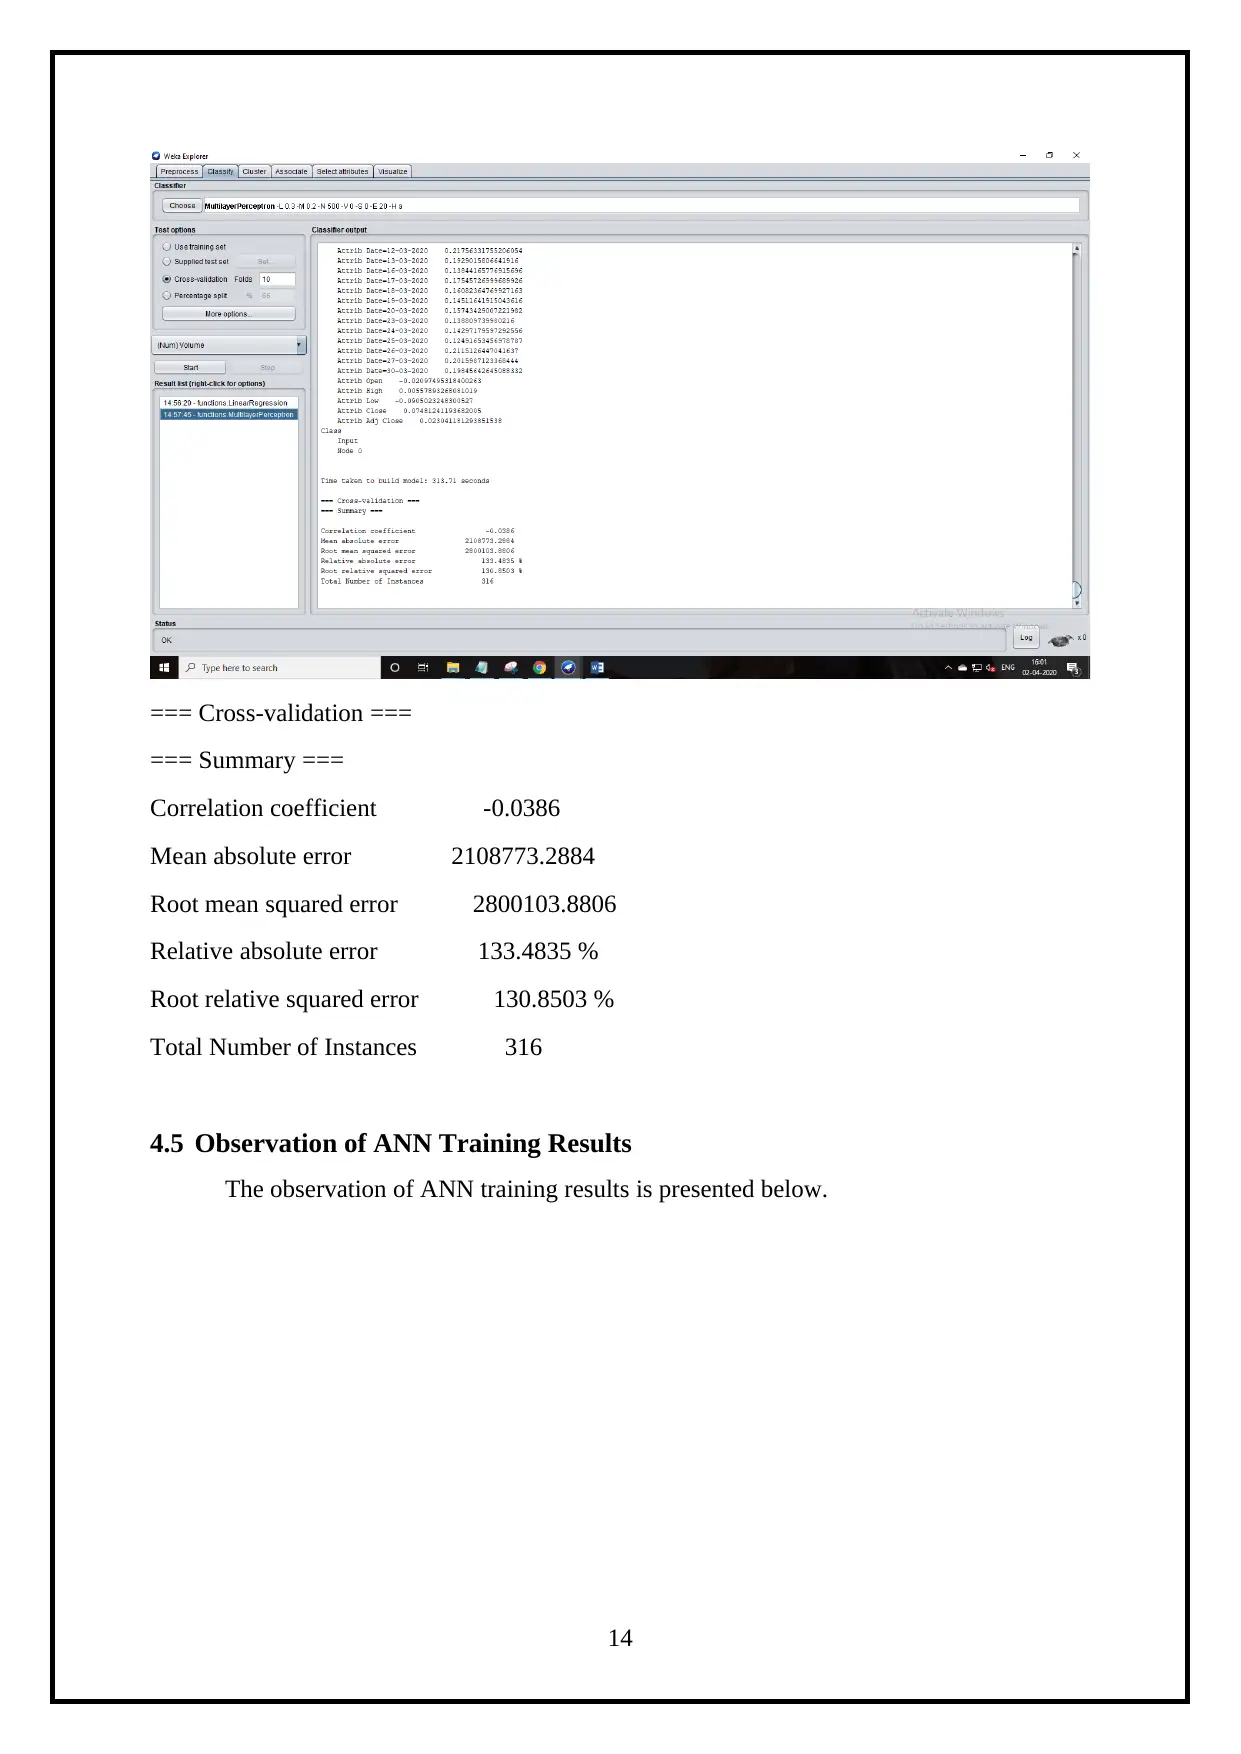
=== Cross-validation ===
=== Summary ===
Correlation coefficient -0.0386
Mean absolute error 2108773.2884
Root mean squared error 2800103.8806
Relative absolute error 133.4835 %
Root relative squared error 130.8503 %
Total Number of Instances 316
4.5 Observation of ANN Training Results
The observation of ANN training results is presented below.
14
Secure Best Marks with AI Grader
Need help grading? Try our AI Grader for instant feedback on your assignments.
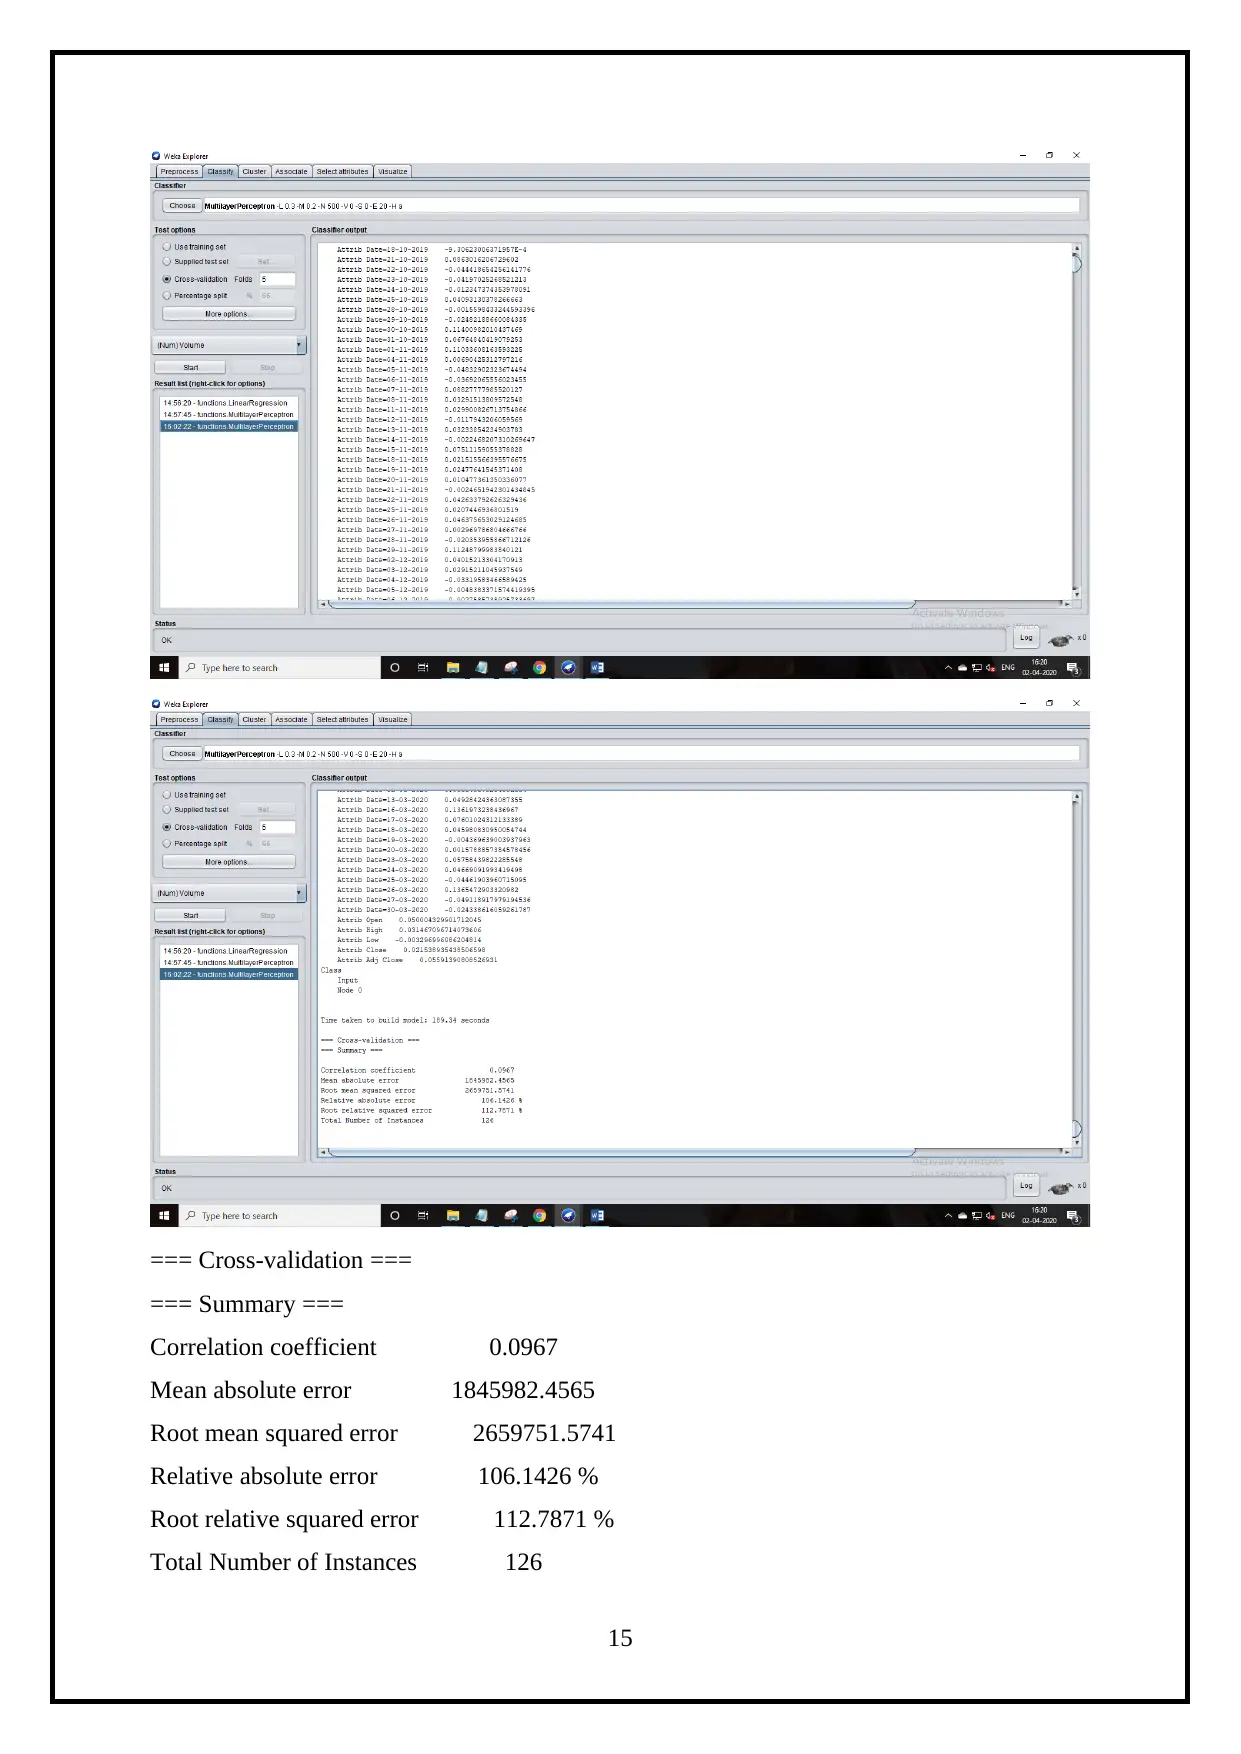
=== Cross-validation ===
=== Summary ===
Correlation coefficient 0.0967
Mean absolute error 1845982.4565
Root mean squared error 2659751.5741
Relative absolute error 106.1426 %
Root relative squared error 112.7871 %
Total Number of Instances 126
15
=== Summary ===
Correlation coefficient 0.0967
Mean absolute error 1845982.4565
Root mean squared error 2659751.5741
Relative absolute error 106.1426 %
Root relative squared error 112.7871 %
Total Number of Instances 126
15
Based on the above results, the obtained coefficients of the variables represent the
output of ANN training results. The interpretation of the pattern regarding the obtained model
is providing a good importance, because this model is telling us to see the positive
coefficient, and it will increase the final coverage of the volume. It has effectively predicted
the data to provide a good importance of data.
5. Evaluation
5.1 Correlation Coefficient
Correlation coefficient is one of the important criteria which is utilized in model’s
performance evaluation (Chanklan et al., 2018).
For Linear regression, Correlation coefficient is -0.1377.
For Artificial Neural Network, Correlation coefficient is -0.0386.
5.2 Root Mean Squared Error (RMSE)
The other important criteria which is utilized in model’s performance evaluation is
RMSE. The results of the comparison helps to determine the best performance and predicts
the required factor (Chanklan et al., 2018).
For Linear regression, Root mean squared error is 2140035.0537.
For Artificial Neural Network, Root mean squared error is 2800103.8806.
5.3 Mean Absolute Error (MAE)
The mean absolute error refers to a measure of difference that exists between two
continuous variables. MAE is an average of the absolute errors. It is also one of the
commonly utilized metrics for measuring the accuracy of continuous variables (JJ, 2016).
For Linear regression, mean absolute error is 1580322.039.
For Artificial Neural Network, Mean absolute error is 2108773.2884.
5.4 Summary Result for both MLR and ANN
Based on Multi linear regression:
Correlation coefficient - -0.1377
Mean absolute error - 1580322.039
Root mean squared error - 2140035.0537
16
Relative absolute error - 100.033 %
Root relative squared error - 100.005 %
Based on ANN:
Correlation coefficient - -0.0386
Mean absolute error - 2108773.2884
Root mean squared error - 2800103.8806
Relative absolute error - 133.4835 %
Root relative squared error - 130.8503 %
As per the result, the obtained coefficients of the variables represents the output of
regression and multi–layer perception that is ANN. The interpretation of the pattern related to
the obtained model provides a better significance, because these two models tell us to see the
negative coefficient, it will reduce the final coverage of the volume. The ANN provides
effective prediction for BATS dataset, because it has relative absolute error as 133.4835%
which is higher than the multi-linear regression. ANN also has higher root relative squared
error when compared to MLR. Therefore, these two models provide better importance of
data. It is evaluated that, BATS company must improve their trading.
6. Decision Support
Therefore, from the results, the correlation coefficient is determined to have better
prediction, because its value is in negative. Thus, it is suggested that the British American
Tobacco PLC Company’s trading view must be improved.
7. Conclusion
This report concludes the analysis by stating that BATS must work on improving its
trading view. The correlation coefficient, RMSE, MAE, are determined using the WEKA
tool, where ANN and MLR are performed. The respective results are represented to have a
clear picture of the results.
17
Paraphrase This Document
Need a fresh take? Get an instant paraphrase of this document with our AI Paraphraser
References
Chanklan, R., Kaoungku, N., Suksut, K., Kerdprasop, K. and Kerdprasop, N., 2018. Runoff
Prediction with a Combined Artificial Neural Network and Support Vector
Regression. International Journal of Machine Learning and Computing, 8(1), pp.39-43.
DataFlair. 2018. Introduction To Learning Rules In Neural Network. [online] Available at:
<https://data-flair.training/blogs/learning-rules-in-neural-network> [Accessed 2 April 2020].
DataFlair. 2018. What Is Artificial Neural Network - Structure, Working, Applications.
[online] Available at: <https://data-flair.training/blogs/artificial-neural-network/> [Accessed
2 April 2020].
EliteDataScience. 2019. Modern Machine Learning Algorithms: Strengths And Weaknesses.
[online] Available at: <https://elitedatascience.com/machine-learning-algorithms> [Accessed
2 April 2020].
Finance.yahoo.com. 2020. British American Tobacco P.L.C. (BATS.L). [online] Available at:
<https://finance.yahoo.com/quote/BATS.L/profile?p=BATS.L> [Accessed 2 April 2020].
Han, J., Kamber, M. and Pei, J., 2012. Data Mining. Amsterdam: Elsevier, Morgan
Kaufmann.
Hastie, T., Friedman, J. and Tisbshirani, R., 2017. The Elements Of Statistical Learning. New
York: Springer.
JJ, 2016. MAE And RMSE — Which Metric Is Better?. [online] Medium. Available at:
<https://medium.com/human-in-a-machine-world/mae-and-rmse-which-metric-is-better-
e60ac3bde13d> [Accessed 2 April 2020].
Kaluza, B., 2013. Instant Weka How-To. Birmingham: Packt Pub.
M. Mijwil, M., 2018. Artificial Neural Networks Advantages And Disadvantages. [online]
Linkedin.com. Available at: <https://www.linkedin.com/pulse/artificial-neural-networks-
advantages-disadvantages-maad-m-mijwel> [Accessed 2 April 2020].
Mavroforakis, C., 2011. Data Mining With WEKA. [online] Cs-people.bu.edu. Available at:
<http://cs-people.bu.edu/dgs/courses/cs105/files/project/using_weka.pdf> [Accessed 2 July
2011].
18

Perner, P., 2015. Machine Learning And Data Mining In Pattern Recognition. Cham:
Springer International Publishing.
Stahlbock, R., Abou-Nasr, M. and Weiss, G., 2018. Data Mining. Bloomfield: C.S.R.E.A.
Veart, D., 2013. First, Catch Your Weka. New York: Auckland University Press.
Witten, I., Frank, E., Hall, M. and Pal, C., 2017. Data Mining. Amsterdam: Morgan
Kaufmann.
Xanthopoulos, P., Pardalos, P. and Trafalis, T., 2013. Robust Data Mining. New York:
Springer.
19
1 out of 21


Your All-in-One AI-Powered Toolkit for Academic Success.
+13062052269
info@desklib.com
Available 24*7 on WhatsApp / Email
![[object Object]](/_next/static/media/star-bottom.7253800d.svg)
Unlock your academic potential
© 2024 | Zucol Services PVT LTD | All rights reserved.