Data Mining Project: Tools and Techniques for CKD Analysis
VerifiedAdded on 2021/06/14
|19
|3731
|50
Project
AI Summary
This project report explores the application of data mining techniques for the analysis of Chronic Kidney Disease (CKD). The study utilizes a dataset with 25 attributes, including both numeric and categorical variables, collected from the UCI machine learning repository. The methodology includes data preprocessing to handle missing values, followed by the identification of important attributes such as blood glucose random (bgr), red cells (rc), and white blood cell count (wc). Correlation and regression analyses are performed to understand the relationships between variables. The project employs association algorithms (EM algorithm) and classification/clustering algorithms (ANN and PCA) to analyze the data. The results section presents the accuracy of each algorithm, with the Artificial Neural Network (ANN) demonstrating a higher accuracy compared to the Expectation Maximization (EM) algorithm. A proposed framework for data mining is presented, outlining the steps from data collection and preprocessing to analysis and prediction. The project aims to provide insights for the diagnosis and treatment of CKD, offering a predictive analysis model to assist healthcare professionals and patients. The report emphasizes the significance of data mining in extracting valuable information from large datasets to improve healthcare outcomes.

Data Mining
(Tools and Mining Techniques)
(Tools and Mining Techniques)
Paraphrase This Document
Need a fresh take? Get an instant paraphrase of this document with our AI Paraphraser
Index
1.Introduction…………………………………………………………………………..…..1
2.Data set Description….……………………………………………………………..…..1
3.Preprocessing…….…………………………………………………………………..….2
4.Important Attribute...….………………………………………………………………….4
5.Importance of Attributes…...………………………………………………………..…..5
6.Correlation and Regression Analysis..………………………………………………...6
7.Association Algorithm….………………………………………………………………...7
8.Classification and Clustering Algorithm………………………………………………..8
9.Result Analysis...…………………………………………………………………………9
10.Proposed Framework.…………………………………………………………………11
11.Conclusion………………………………………………………………………………14
12.References…………………………………………………………………………...…15
Introduction
Data Mining is the process or techniques to identify informative data from the data
warehouse. Big Data is the coming from different source and collected in different systems.
The main role is to predict the outcomes from the dataset, it also the motive for everyone
for their business and market standard.
There is huge amount of data available in the Data Science Industry. But this data is of no
use until unless we can not find out the informative information from the data. It is
necessary to analyze the bulk amount of data and extract useful infromation from it.
Data Mining is defined the term as extracting information from bulk amount of data. It is the
process of mining the knowledge from the huge data source.
Chronic Kidney Disease dataset is collected through UCI machine learning repository. The
main aim to identify the informative variables or fields from the dataset (S.J. and J.H., 2015).
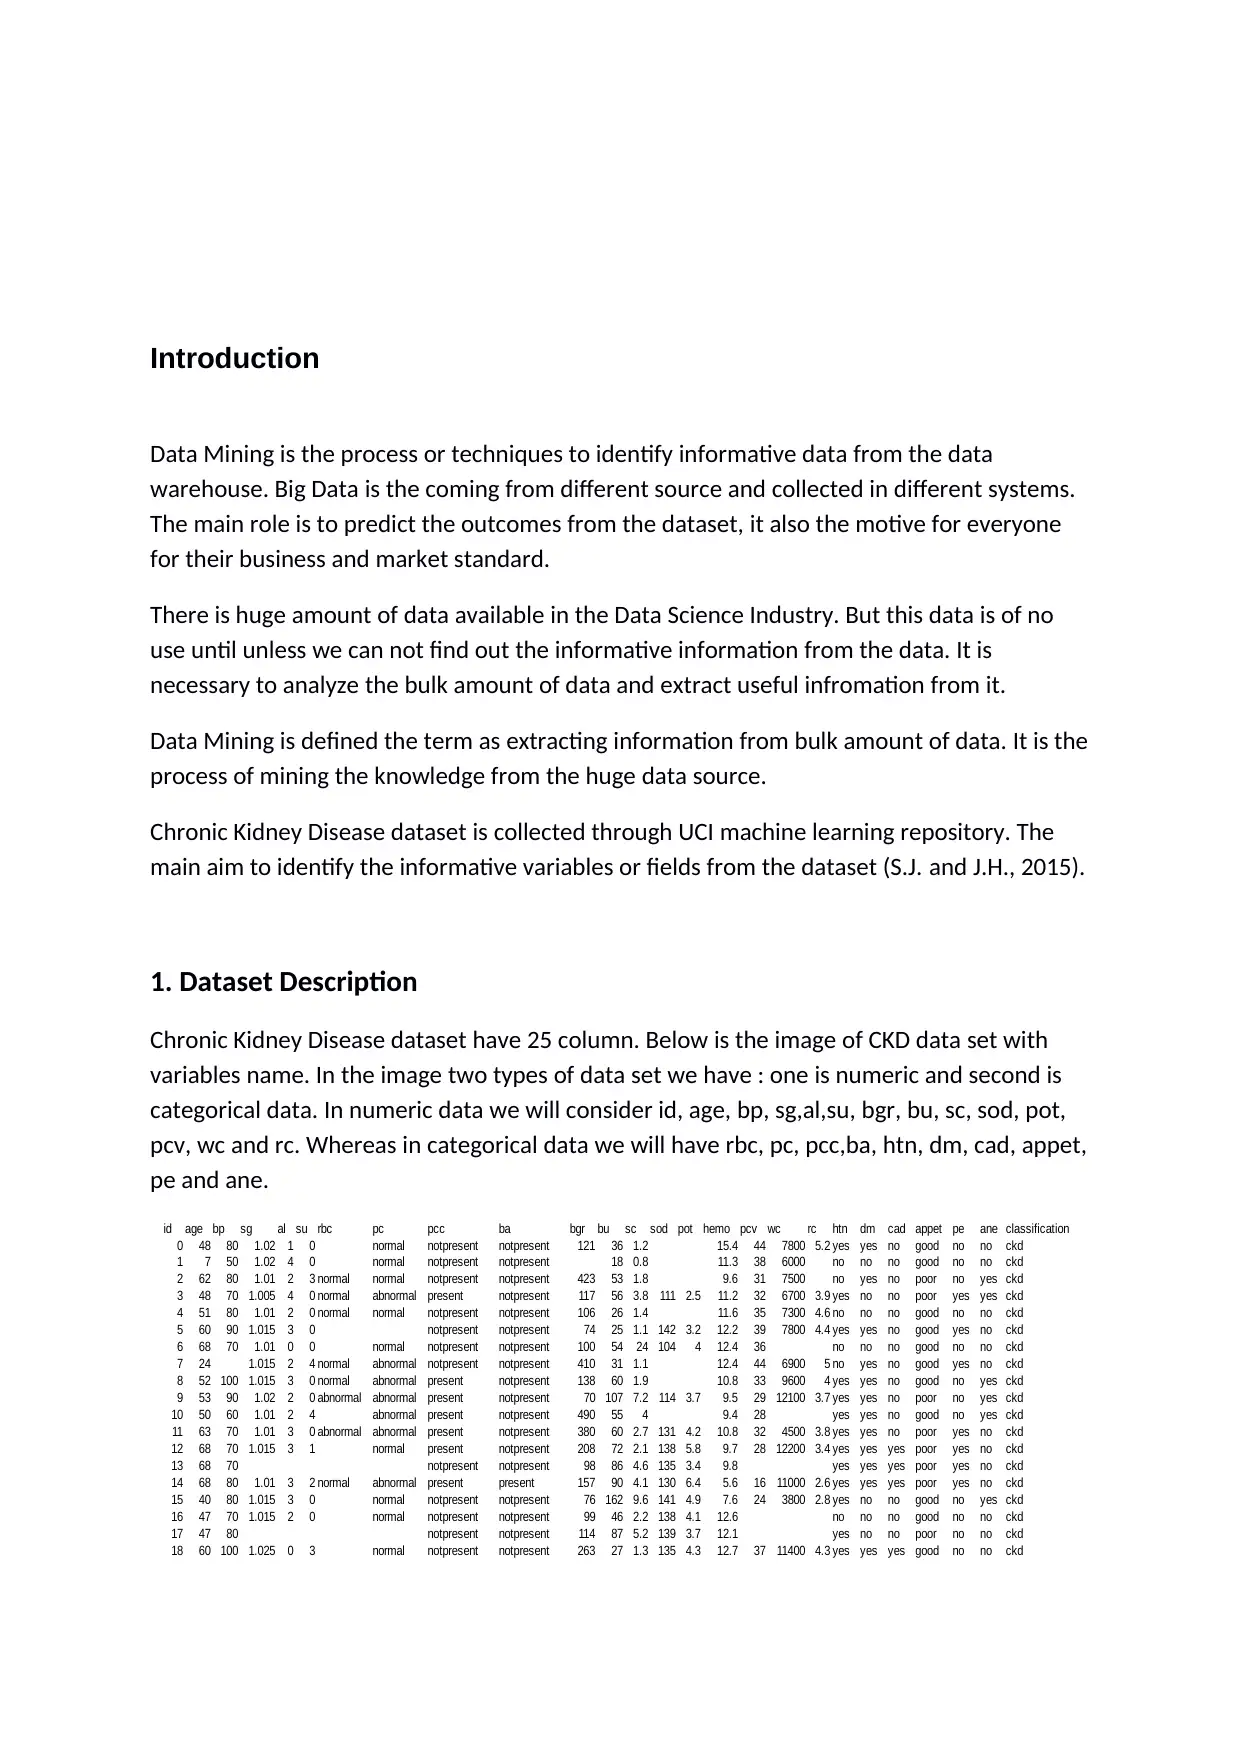
1. Dataset Description
Chronic Kidney Disease dataset have 25 column. Below is the image of CKD data set with
variables name. In the image two types of data set we have : one is numeric and second is
categorical data. In numeric data we will consider id, age, bp, sg,al,su, bgr, bu, sc, sod, pot,
pcv, wc and rc. Whereas in categorical data we will have rbc, pc, pcc,ba, htn, dm, cad, appet,
pe and ane.
id age bp sg al su rbc pc pcc ba bgr bu sc sod pot hemo pcv wc rc htn dm cad appet pe ane classification
0 48 80 1.02 1 0 normal notpresent notpresent 121 36 1.2 15.4 44 7800 5.2 yes yes no good no no ckd
1 7 50 1.02 4 0 normal notpresent notpresent 18 0.8 11.3 38 6000 no no no good no no ckd
2 62 80 1.01 2 3 normal normal notpresent notpresent 423 53 1.8 9.6 31 7500 no yes no poor no yes ckd
3 48 70 1.005 4 0 normal abnormal present notpresent 117 56 3.8 111 2.5 11.2 32 6700 3.9 yes no no poor yes yes ckd
4 51 80 1.01 2 0 normal normal notpresent notpresent 106 26 1.4 11.6 35 7300 4.6 no no no good no no ckd
5 60 90 1.015 3 0 notpresent notpresent 74 25 1.1 142 3.2 12.2 39 7800 4.4 yes yes no good yes no ckd
6 68 70 1.01 0 0 normal notpresent notpresent 100 54 24 104 4 12.4 36 no no no good no no ckd
7 24 1.015 2 4 normal abnormal notpresent notpresent 410 31 1.1 12.4 44 6900 5 no yes no good yes no ckd
8 52 100 1.015 3 0 normal abnormal present notpresent 138 60 1.9 10.8 33 9600 4 yes yes no good no yes ckd
9 53 90 1.02 2 0 abnormal abnormal present notpresent 70 107 7.2 114 3.7 9.5 29 12100 3.7 yes yes no poor no yes ckd
10 50 60 1.01 2 4 abnormal present notpresent 490 55 4 9.4 28 yes yes no good no yes ckd
11 63 70 1.01 3 0 abnormal abnormal present notpresent 380 60 2.7 131 4.2 10.8 32 4500 3.8 yes yes no poor yes no ckd
12 68 70 1.015 3 1 normal present notpresent 208 72 2.1 138 5.8 9.7 28 12200 3.4 yes yes yes poor yes no ckd
13 68 70 notpresent notpresent 98 86 4.6 135 3.4 9.8 yes yes yes poor yes no ckd
14 68 80 1.01 3 2 normal abnormal present present 157 90 4.1 130 6.4 5.6 16 11000 2.6 yes yes yes poor yes no ckd
15 40 80 1.015 3 0 normal notpresent notpresent 76 162 9.6 141 4.9 7.6 24 3800 2.8 yes no no good no yes ckd
16 47 70 1.015 2 0 normal notpresent notpresent 99 46 2.2 138 4.1 12.6 no no no good no no ckd
17 47 80 notpresent notpresent 114 87 5.2 139 3.7 12.1 yes no no poor no no ckd
18 60 100 1.025 0 3 normal notpresent notpresent 263 27 1.3 135 4.3 12.7 37 11400 4.3 yes yes yes good no no ckd
Data Mining is the process or techniques to identify informative data from the data
warehouse. Big Data is the coming from different source and collected in different systems.
The main role is to predict the outcomes from the dataset, it also the motive for everyone
for their business and market standard.
There is huge amount of data available in the Data Science Industry. But this data is of no
use until unless we can not find out the informative information from the data. It is
necessary to analyze the bulk amount of data and extract useful infromation from it.
Data Mining is defined the term as extracting information from bulk amount of data. It is the
process of mining the knowledge from the huge data source.
Chronic Kidney Disease dataset is collected through UCI machine learning repository. The
main aim to identify the informative variables or fields from the dataset (S.J. and J.H., 2015).
1. Dataset Description
Chronic Kidney Disease dataset have 25 column. Below is the image of CKD data set with
variables name. In the image two types of data set we have : one is numeric and second is
categorical data. In numeric data we will consider id, age, bp, sg,al,su, bgr, bu, sc, sod, pot,
pcv, wc and rc. Whereas in categorical data we will have rbc, pc, pcc,ba, htn, dm, cad, appet,
pe and ane.
id age bp sg al su rbc pc pcc ba bgr bu sc sod pot hemo pcv wc rc htn dm cad appet pe ane classification
0 48 80 1.02 1 0 normal notpresent notpresent 121 36 1.2 15.4 44 7800 5.2 yes yes no good no no ckd
1 7 50 1.02 4 0 normal notpresent notpresent 18 0.8 11.3 38 6000 no no no good no no ckd
2 62 80 1.01 2 3 normal normal notpresent notpresent 423 53 1.8 9.6 31 7500 no yes no poor no yes ckd
3 48 70 1.005 4 0 normal abnormal present notpresent 117 56 3.8 111 2.5 11.2 32 6700 3.9 yes no no poor yes yes ckd
4 51 80 1.01 2 0 normal normal notpresent notpresent 106 26 1.4 11.6 35 7300 4.6 no no no good no no ckd
5 60 90 1.015 3 0 notpresent notpresent 74 25 1.1 142 3.2 12.2 39 7800 4.4 yes yes no good yes no ckd
6 68 70 1.01 0 0 normal notpresent notpresent 100 54 24 104 4 12.4 36 no no no good no no ckd
7 24 1.015 2 4 normal abnormal notpresent notpresent 410 31 1.1 12.4 44 6900 5 no yes no good yes no ckd
8 52 100 1.015 3 0 normal abnormal present notpresent 138 60 1.9 10.8 33 9600 4 yes yes no good no yes ckd
9 53 90 1.02 2 0 abnormal abnormal present notpresent 70 107 7.2 114 3.7 9.5 29 12100 3.7 yes yes no poor no yes ckd
10 50 60 1.01 2 4 abnormal present notpresent 490 55 4 9.4 28 yes yes no good no yes ckd
11 63 70 1.01 3 0 abnormal abnormal present notpresent 380 60 2.7 131 4.2 10.8 32 4500 3.8 yes yes no poor yes no ckd
12 68 70 1.015 3 1 normal present notpresent 208 72 2.1 138 5.8 9.7 28 12200 3.4 yes yes yes poor yes no ckd
13 68 70 notpresent notpresent 98 86 4.6 135 3.4 9.8 yes yes yes poor yes no ckd
14 68 80 1.01 3 2 normal abnormal present present 157 90 4.1 130 6.4 5.6 16 11000 2.6 yes yes yes poor yes no ckd
15 40 80 1.015 3 0 normal notpresent notpresent 76 162 9.6 141 4.9 7.6 24 3800 2.8 yes no no good no yes ckd
16 47 70 1.015 2 0 normal notpresent notpresent 99 46 2.2 138 4.1 12.6 no no no good no no ckd
17 47 80 notpresent notpresent 114 87 5.2 139 3.7 12.1 yes no no poor no no ckd
18 60 100 1.025 0 3 normal notpresent notpresent 263 27 1.3 135 4.3 12.7 37 11400 4.3 yes yes yes good no no ckd
⊘ This is a preview!⊘
Do you want full access?
Subscribe today to unlock all pages.
Trusted by 1+ million students worldwide
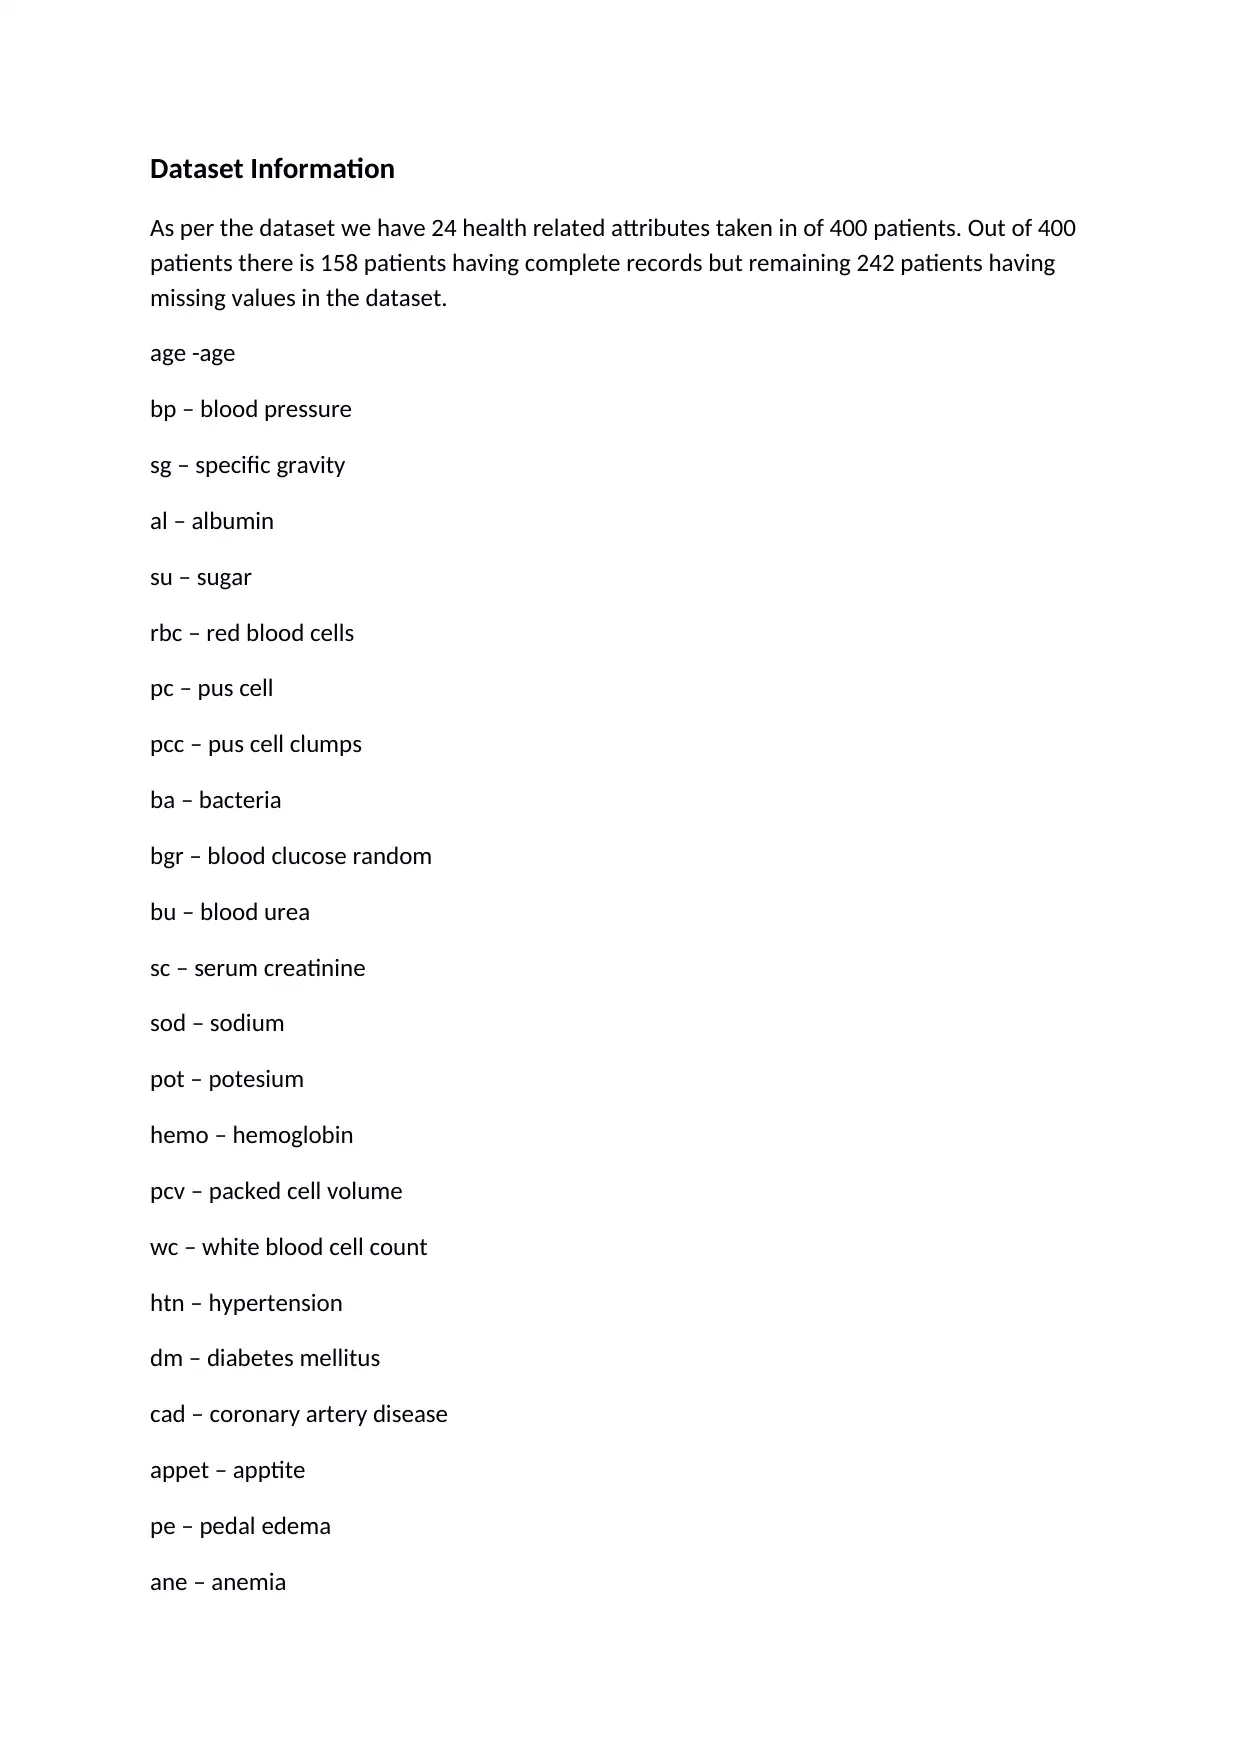
Dataset Information
As per the dataset we have 24 health related attributes taken in of 400 patients. Out of 400
patients there is 158 patients having complete records but remaining 242 patients having
missing values in the dataset.
age -age
bp – blood pressure
sg – specific gravity
al – albumin
su – sugar
rbc – red blood cells
pc – pus cell
pcc – pus cell clumps
ba – bacteria
bgr – blood clucose random
bu – blood urea
sc – serum creatinine
sod – sodium
pot – potesium
hemo – hemoglobin
pcv – packed cell volume
wc – white blood cell count
htn – hypertension
dm – diabetes mellitus
cad – coronary artery disease
appet – apptite
pe – pedal edema
ane – anemia
Paraphrase This Document
Need a fresh take? Get an instant paraphrase of this document with our AI Paraphraser
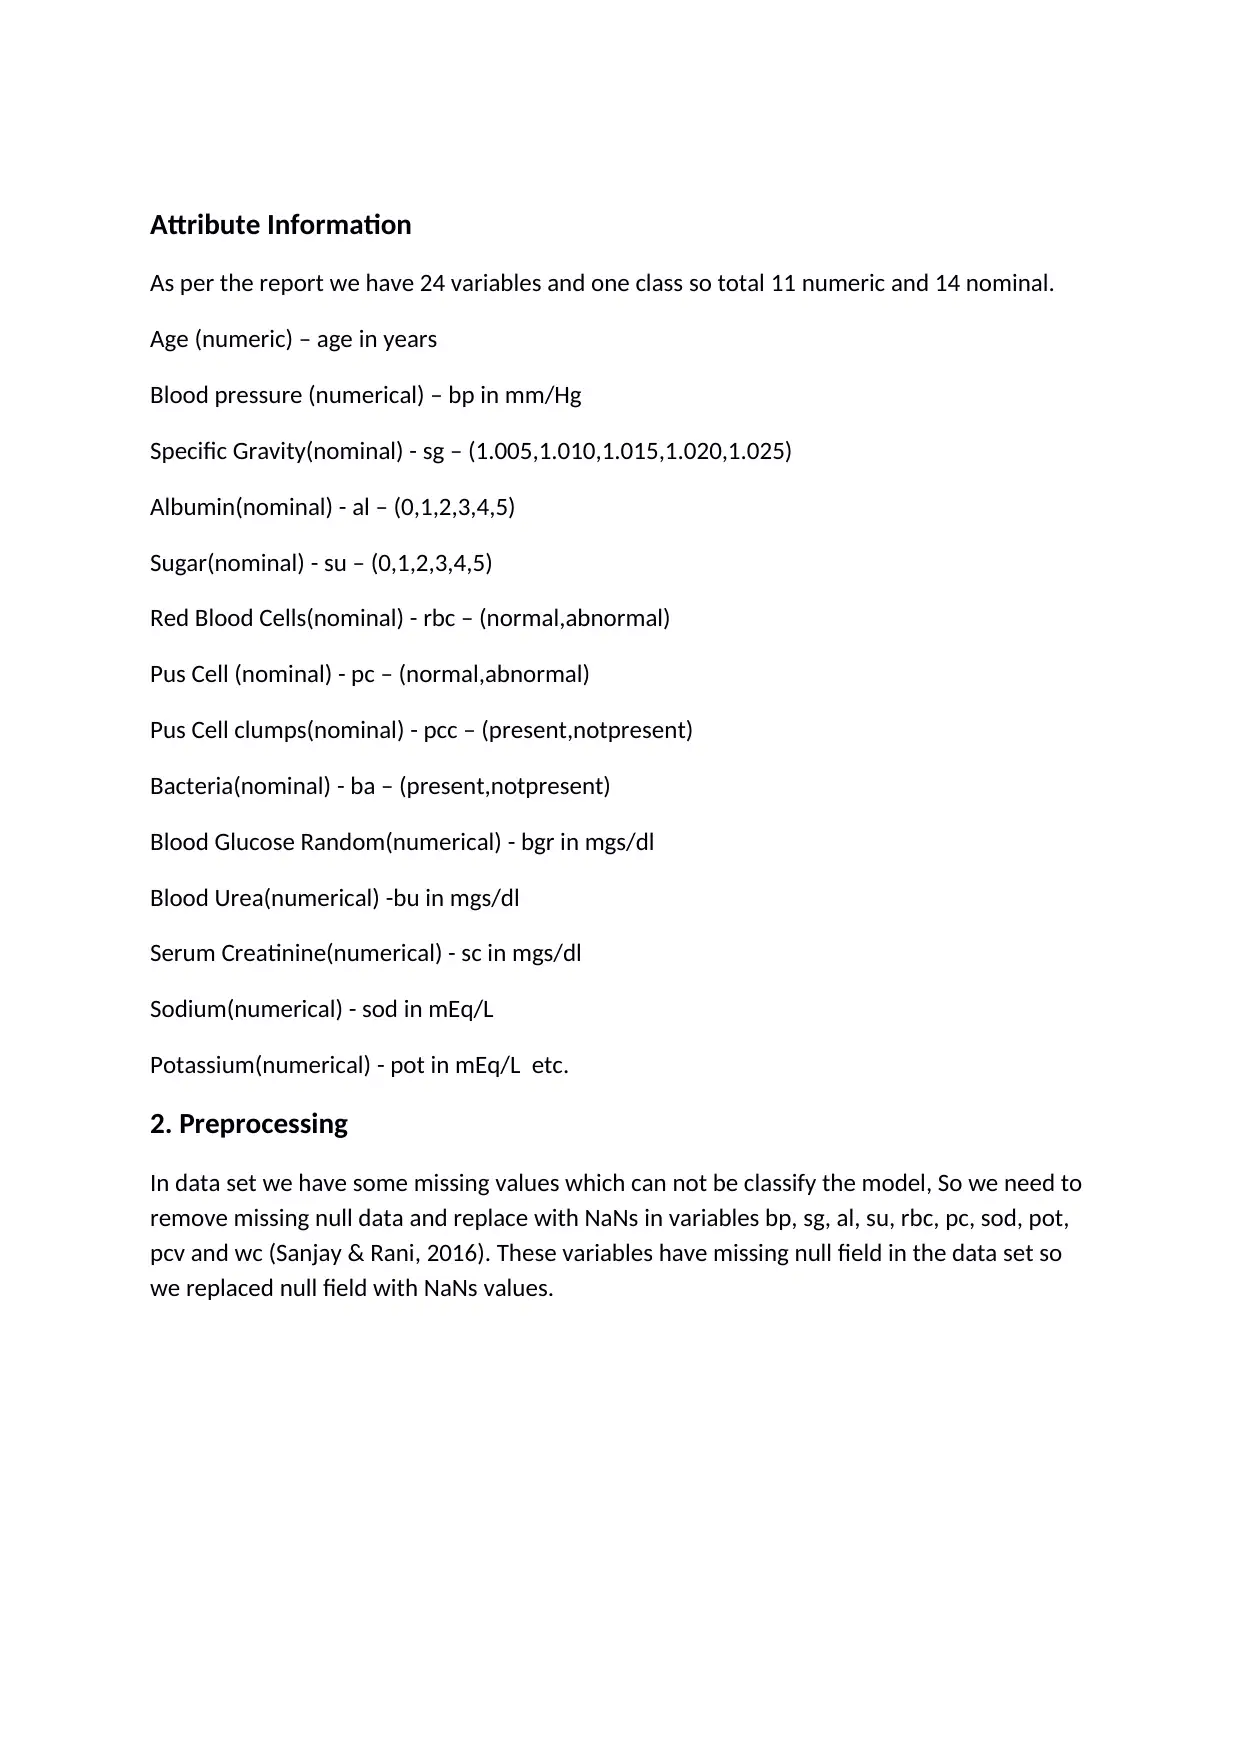
Attribute Information
As per the report we have 24 variables and one class so total 11 numeric and 14 nominal.
Age (numeric) – age in years
Blood pressure (numerical) – bp in mm/Hg
Specific Gravity(nominal) - sg – (1.005,1.010,1.015,1.020,1.025)
Albumin(nominal) - al – (0,1,2,3,4,5)
Sugar(nominal) - su – (0,1,2,3,4,5)
Red Blood Cells(nominal) - rbc – (normal,abnormal)
Pus Cell (nominal) - pc – (normal,abnormal)
Pus Cell clumps(nominal) - pcc – (present,notpresent)
Bacteria(nominal) - ba – (present,notpresent)
Blood Glucose Random(numerical) - bgr in mgs/dl
Blood Urea(numerical) -bu in mgs/dl
Serum Creatinine(numerical) - sc in mgs/dl
Sodium(numerical) - sod in mEq/L
Potassium(numerical) - pot in mEq/L etc.
2. Preprocessing
In data set we have some missing values which can not be classify the model, So we need to
remove missing null data and replace with NaNs in variables bp, sg, al, su, rbc, pc, sod, pot,
pcv and wc (Sanjay & Rani, 2016). These variables have missing null field in the data set so
we replaced null field with NaNs values.
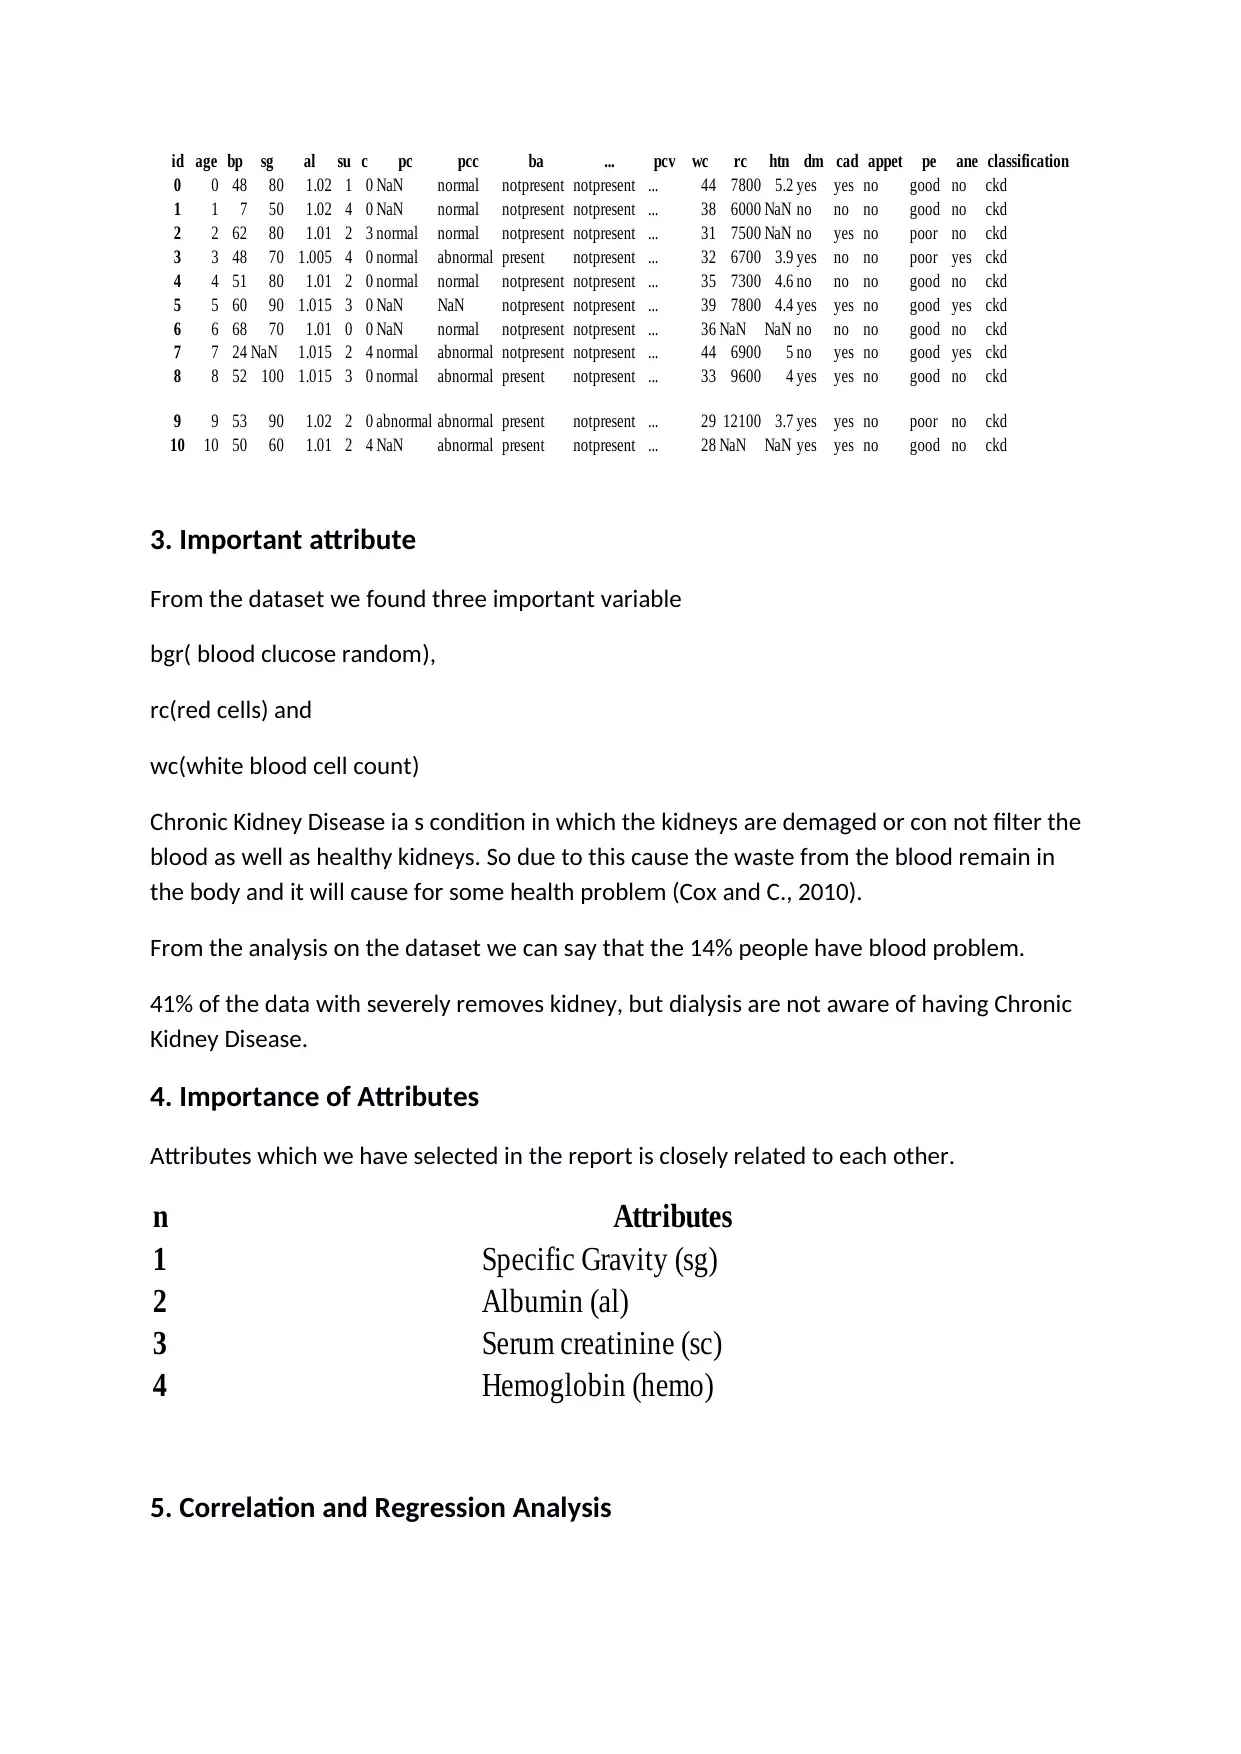
3. Important attribute
From the dataset we found three important variable
bgr( blood clucose random),
rc(red cells) and
wc(white blood cell count)
Chronic Kidney Disease ia s condition in which the kidneys are demaged or con not filter the
blood as well as healthy kidneys. So due to this cause the waste from the blood remain in
the body and it will cause for some health problem (Cox and C., 2010).
From the analysis on the dataset we can say that the 14% people have blood problem.
41% of the data with severely removes kidney, but dialysis are not aware of having Chronic
Kidney Disease.
4. Importance of Attributes
Attributes which we have selected in the report is closely related to each other.
n Attributes
1 Specific Gravity (sg)
2 Albumin (al)
3 Serum creatinine (sc)
4 Hemoglobin (hemo)
5. Correlation and Regression Analysis
id age bp sg al su pc pcc ba ... pcv wc rc htn dm cad appet pe ane classification
0 0 48 80 1.02 1 0 NaN normal notpresent notpresent ... 44 7800 5.2 yes yes no good no ckd
1 1 7 50 1.02 4 0 NaN normal notpresent notpresent ... 38 6000 NaN no no no good no ckd
2 2 62 80 1.01 2 3 normal normal notpresent notpresent ... 31 7500 NaN no yes no poor no ckd
3 3 48 70 1.005 4 0 normal abnormal present notpresent ... 32 6700 3.9 yes no no poor yes ckd
4 4 51 80 1.01 2 0 normal normal notpresent notpresent ... 35 7300 4.6 no no no good no ckd
5 5 60 90 1.015 3 0 NaN NaN notpresent notpresent ... 39 7800 4.4 yes yes no good yes ckd
6 6 68 70 1.01 0 0 NaN normal notpresent notpresent ... 36 NaN NaN no no no good no ckd
7 7 24 NaN 1.015 2 4 normal abnormal notpresent notpresent ... 44 6900 5 no yes no good yes ckd
8 8 52 100 1.015 3 0 normal abnormal present notpresent ... 33 9600 4 yes yes no good no ckd
9 9 53 90 1.02 2 0 abnormal abnormal present notpresent ... 29 12100 3.7 yes yes no poor no ckd
10 10 50 60 1.01 2 4 NaN abnormal present notpresent ... 28 NaN NaN yes yes no good no ckd
rb
c
⊘ This is a preview!⊘
Do you want full access?
Subscribe today to unlock all pages.
Trusted by 1+ million students worldwide
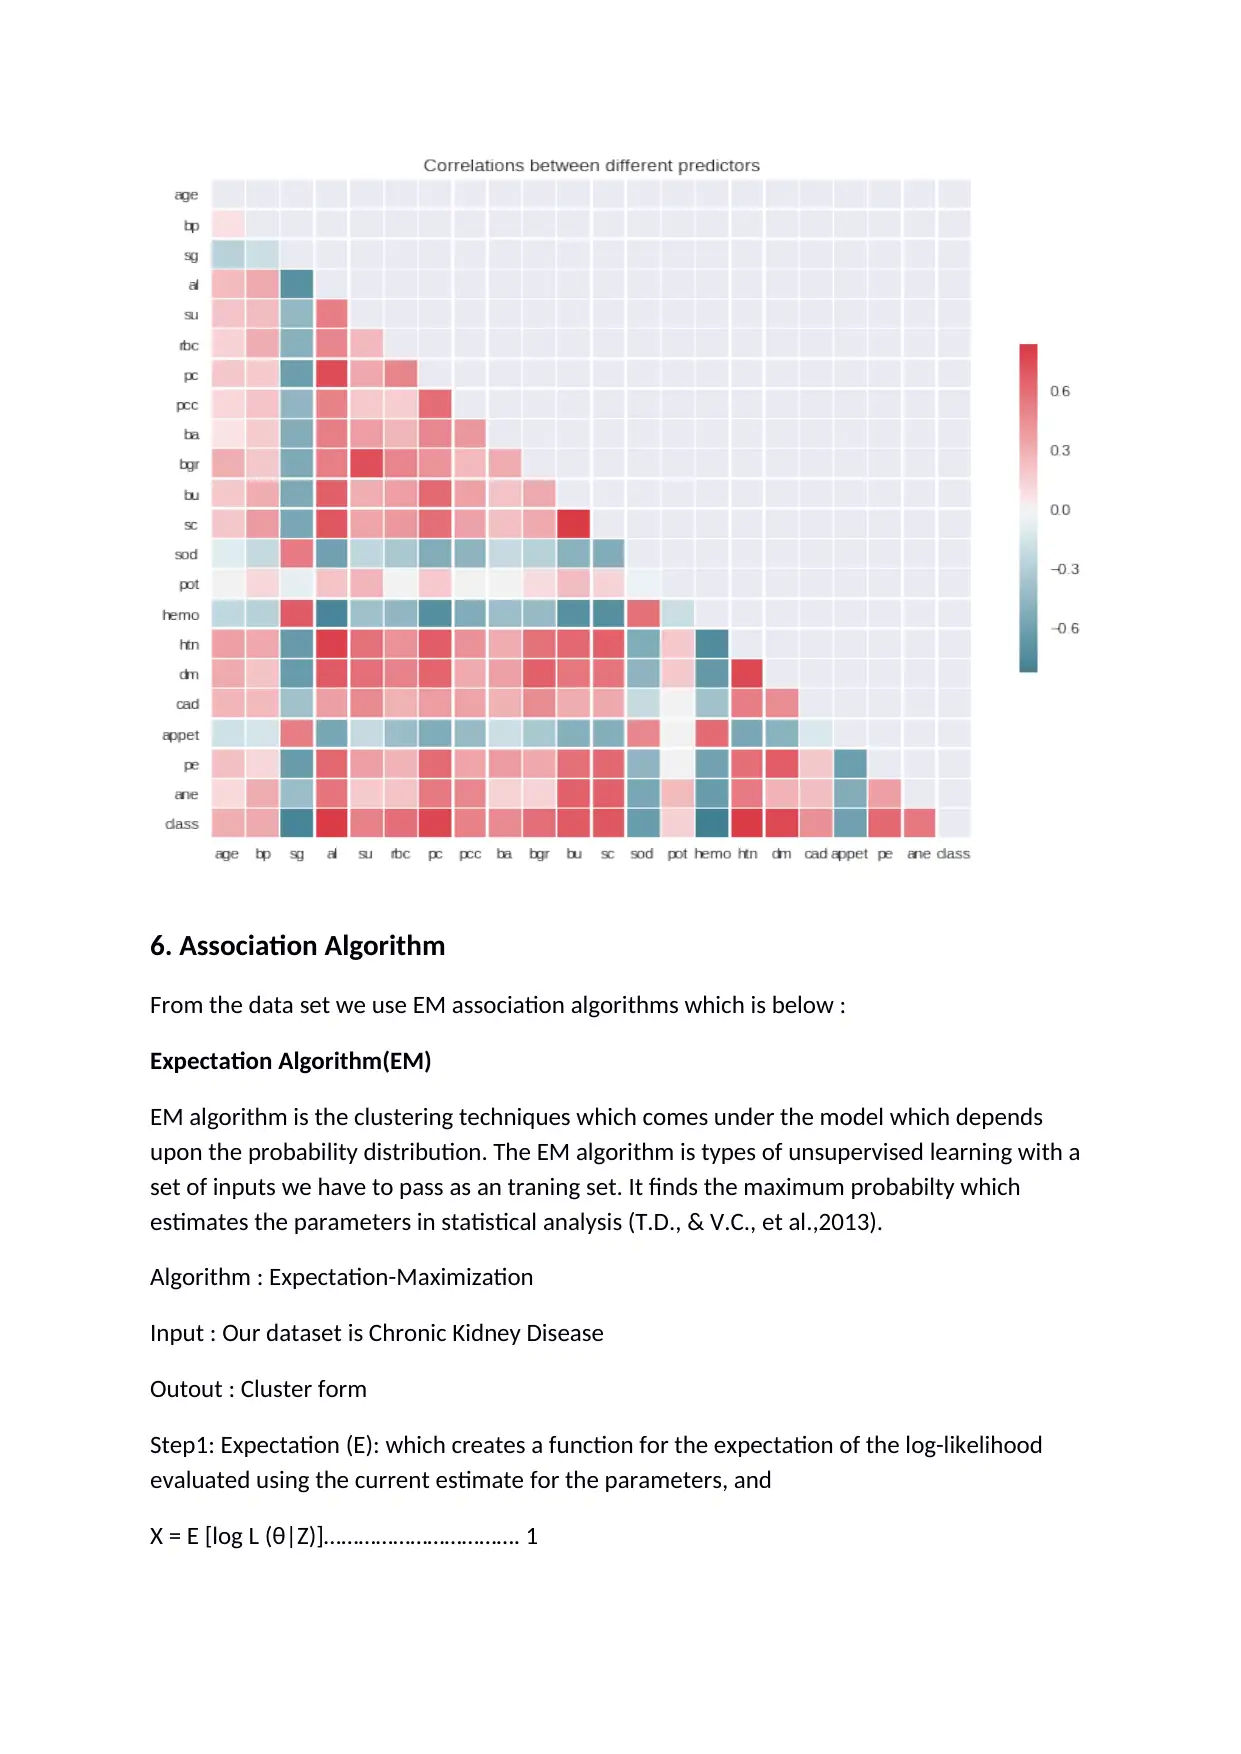
Corrletion is the statistical techniques that can show weather and how stongly paires of
varibles are related. In the study the variable rbc (red blood cells) and pc (pus cell) is
correlated to each others.
Below graph shows the relationship between all the variables present in the dataset. It
shows the correlation between different predictors values as per their relationship.
From the graph it is clear that the variable which are weekly correlated to each other their
chance is less for disease but stongly correlated variable impact on high disease.
Less correlated > Less chance for disease
Highly correlated < High chance for disease
Paraphrase This Document
Need a fresh take? Get an instant paraphrase of this document with our AI Paraphraser
6. Association Algorithm
From the data set we use EM association algorithms which is below :
Expectation Algorithm(EM)
EM algorithm is the clustering techniques which comes under the model which depends
upon the probability distribution. The EM algorithm is types of unsupervised learning with a
set of inputs we have to pass as an traning set. It finds the maximum probabilty which
estimates the parameters in statistical analysis (T.D., & V.C., et al.,2013).
Algorithm : Expectation-Maximization
Input : Our dataset is Chronic Kidney Disease
Outout : Cluster form
Step1: Expectation (E): which creates a function for the expectation of the log-likelihood
evaluated using the current estimate for the parameters, and
X = E [log L (θ|Z)]……………………………. 1
Where, Θ = initial guess for parameter, and Z = missing value .
Step2: Maximization (M): This computes parameters maximizing the anticipated log-
likelihood observed at the E step.
θᶦargmax X………………………………… 2
Use the computed value to obtain better estimates for Θ.
Step3: Iterate E step and M step until converge
7. Classification and Clustering Algorithm
Data set having multiple categorical variables so we use ANN classification algorithms.
The algorithm of the data in CKD used by Principal Component Analysis (PCA).
Principal Component Analysis is a dimentionality reduction techniques in which a
convariance analysis between factors takes place (Medvedev, 2014). The original mining
data is mapped into coordinate system based on the variance within the data.
PCA applies a mathematical procedure for tranforming a number of correlated variables into
a smaller number of uncorrelated variables called principal components.
Algorithm : This algorithm is step out in 5 points :
⊘ This is a preview!⊘
Do you want full access?
Subscribe today to unlock all pages.
Trusted by 1+ million students worldwide
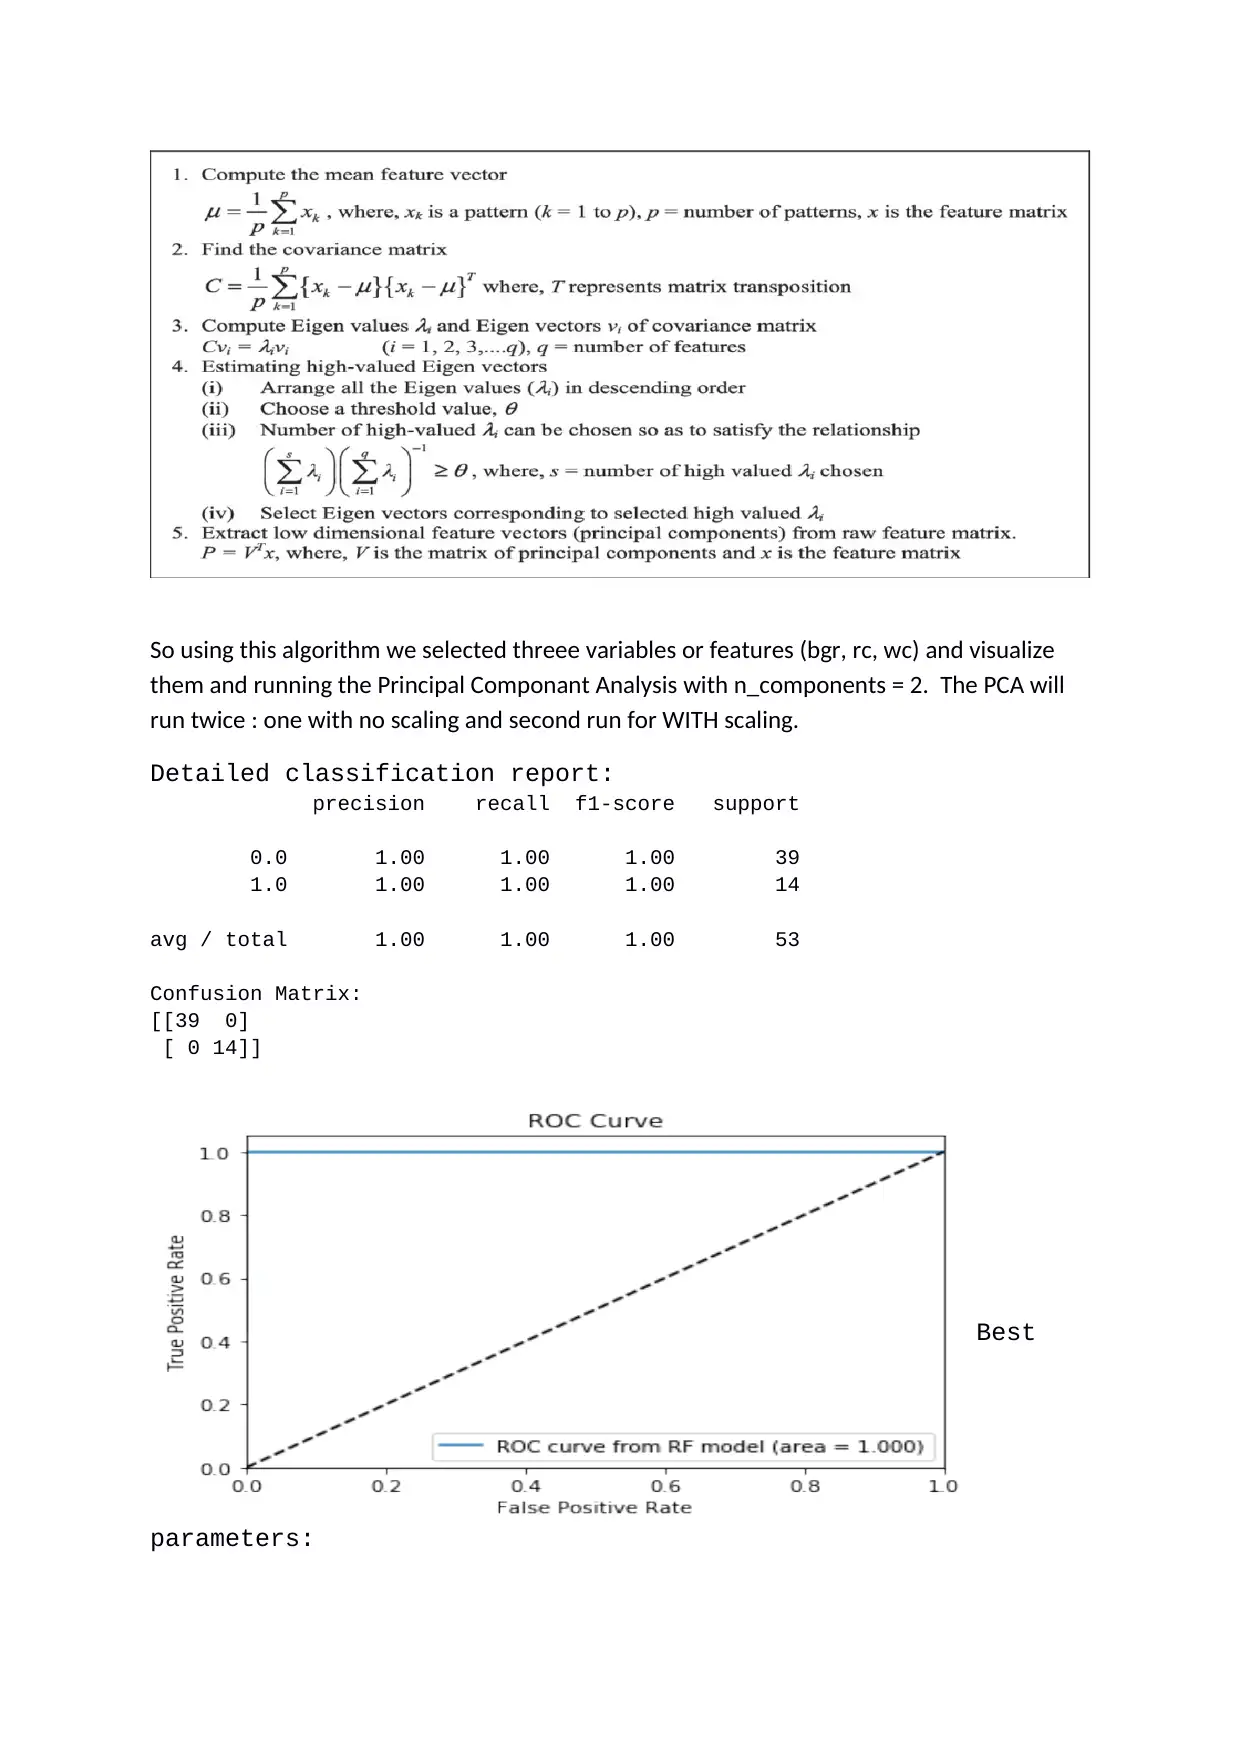
So using this algorithm we selected threee variables or features (bgr, rc, wc) and visualize
them and running the Principal Componant Analysis with n_components = 2. The PCA will
run twice : one with no scaling and second run for WITH scaling.
Detailed classification report:
precision recall f1-score support
0.0 1.00 1.00 1.00 39
1.0 1.00 1.00 1.00 14
avg / total 1.00 1.00 1.00 53
Confusion Matrix:
[[39 0]
[ 0 14]]
Best
parameters:
Paraphrase This Document
Need a fresh take? Get an instant paraphrase of this document with our AI Paraphraser
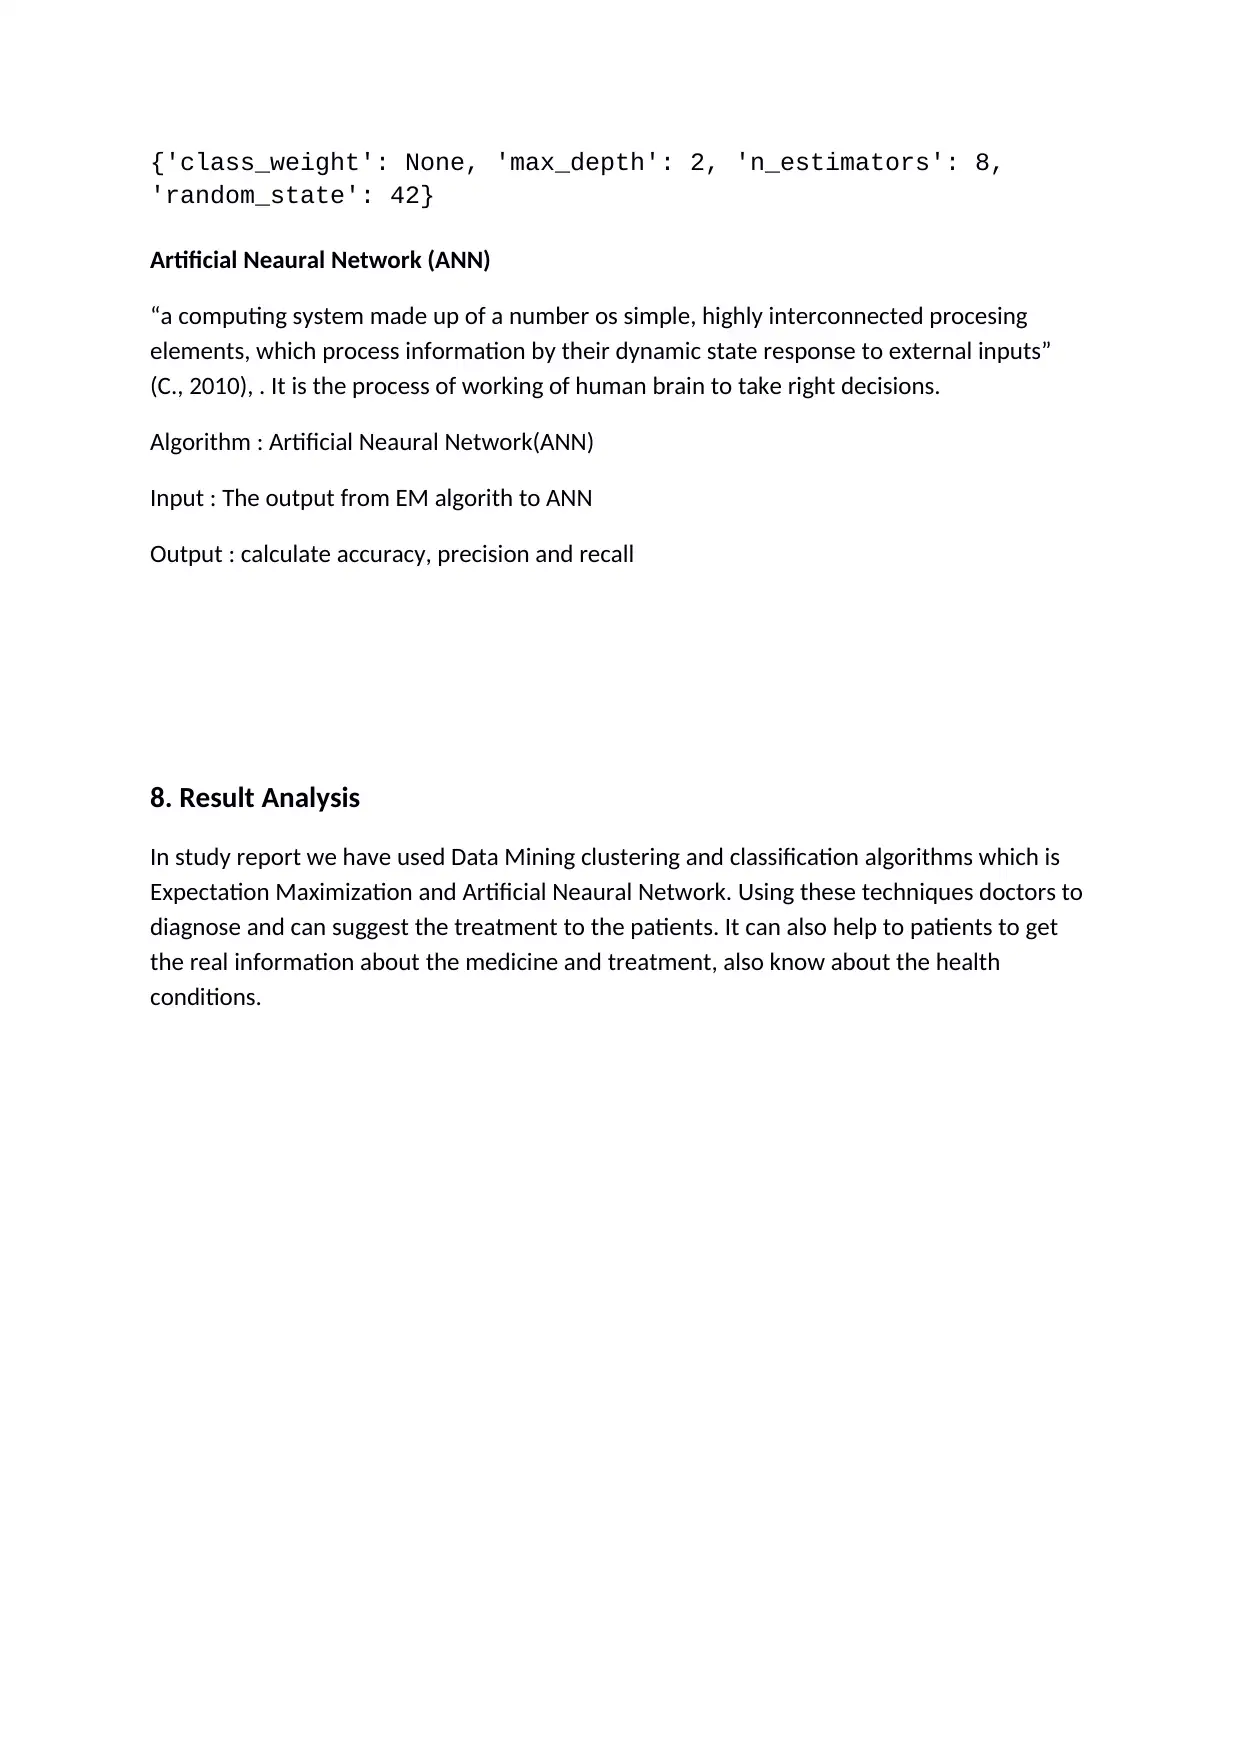
{'class_weight': None, 'max_depth': 2, 'n_estimators': 8,
'random_state': 42}
Artificial Neaural Network (ANN)
“a computing system made up of a number os simple, highly interconnected procesing
elements, which process information by their dynamic state response to external inputs”
(C., 2010), . It is the process of working of human brain to take right decisions.
Algorithm : Artificial Neaural Network(ANN)
Input : The output from EM algorith to ANN
Output : calculate accuracy, precision and recall
8. Result Analysis
In study report we have used Data Mining clustering and classification algorithms which is
Expectation Maximization and Artificial Neaural Network. Using these techniques doctors to
diagnose and can suggest the treatment to the patients. It can also help to patients to get
the real information about the medicine and treatment, also know about the health
conditions.
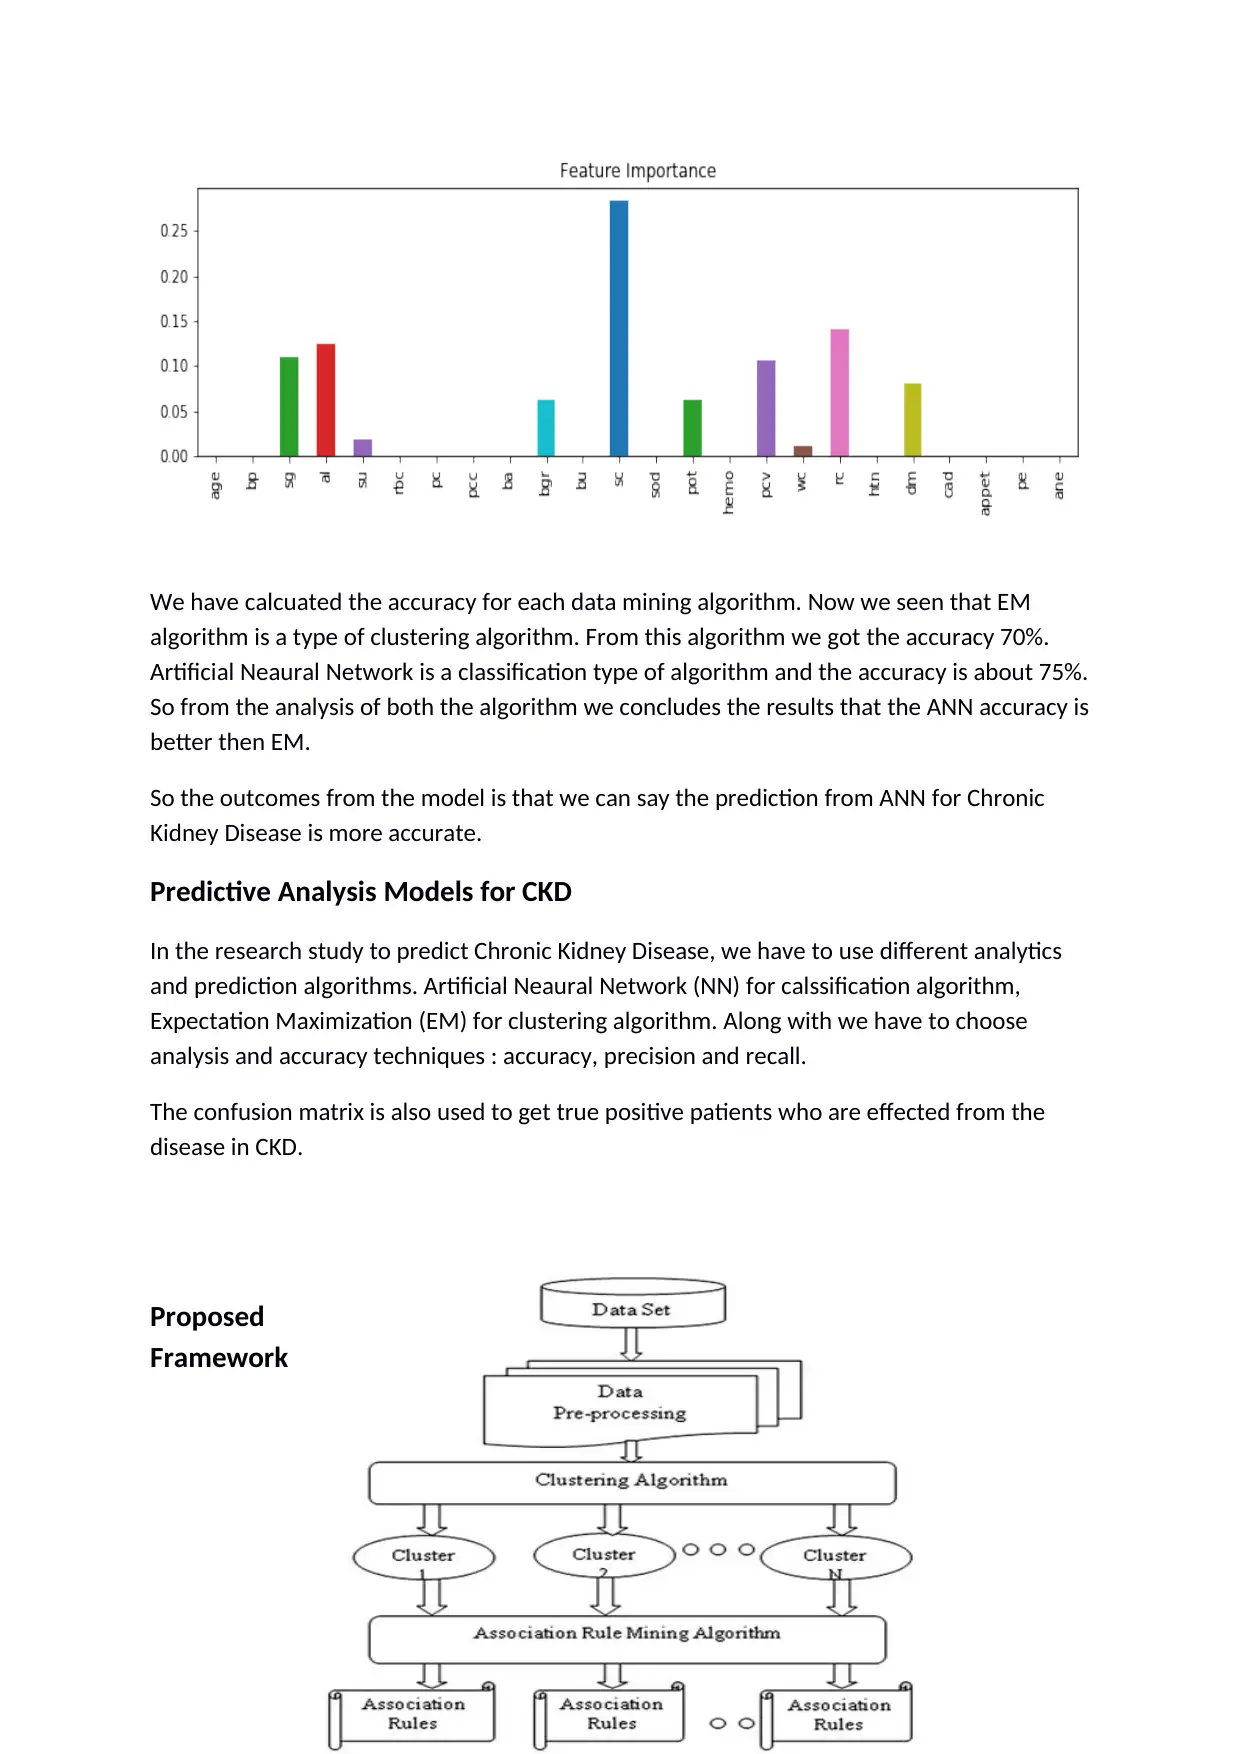
We have calcuated the accuracy for each data mining algorithm. Now we seen that EM
algorithm is a type of clustering algorithm. From this algorithm we got the accuracy 70%.
Artificial Neaural Network is a classification type of algorithm and the accuracy is about 75%.
So from the analysis of both the algorithm we concludes the results that the ANN accuracy is
better then EM.
So the outcomes from the model is that we can say the prediction from ANN for Chronic
Kidney Disease is more accurate.
Predictive Analysis Models for CKD
In the research study to predict Chronic Kidney Disease, we have to use different analytics
and prediction algorithms. Artificial Neaural Network (NN) for calssification algorithm,
Expectation Maximization (EM) for clustering algorithm. Along with we have to choose
analysis and accuracy techniques : accuracy, precision and recall.
The confusion matrix is also used to get true positive patients who are effected from the
disease in CKD.
Proposed
Framework
⊘ This is a preview!⊘
Do you want full access?
Subscribe today to unlock all pages.
Trusted by 1+ million students worldwide
1 out of 19
Your All-in-One AI-Powered Toolkit for Academic Success.
+13062052269
info@desklib.com
Available 24*7 on WhatsApp / Email
![[object Object]](/_next/static/media/star-bottom.7253800d.svg)
Unlock your academic potential
Copyright © 2020–2026 A2Z Services. All Rights Reserved. Developed and managed by ZUCOL.