MG413 - Data Insights: Correlation, Regression, Time Series Analysis

Verified

Added on  2023/06/15

|9
|621
|359
Presentation
AI Summary
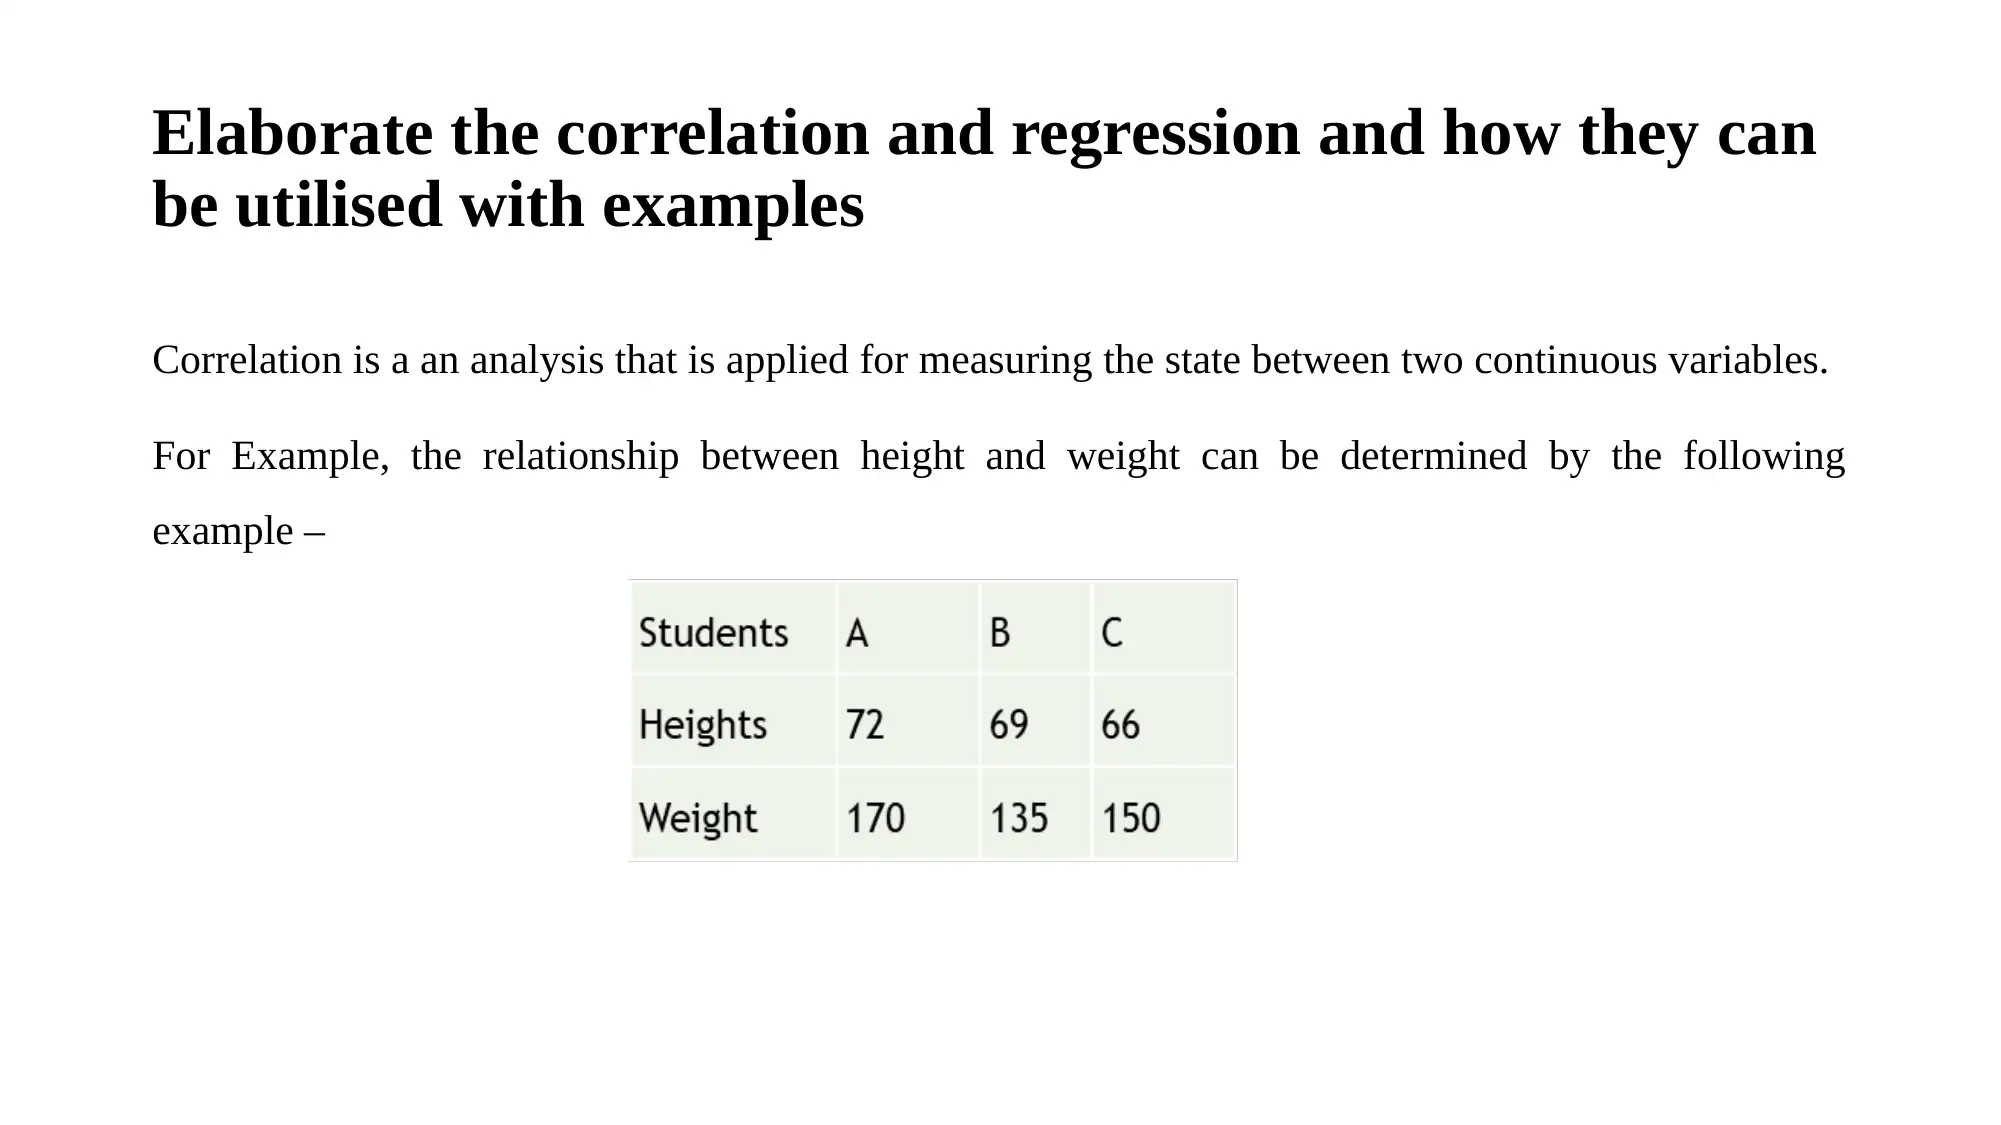
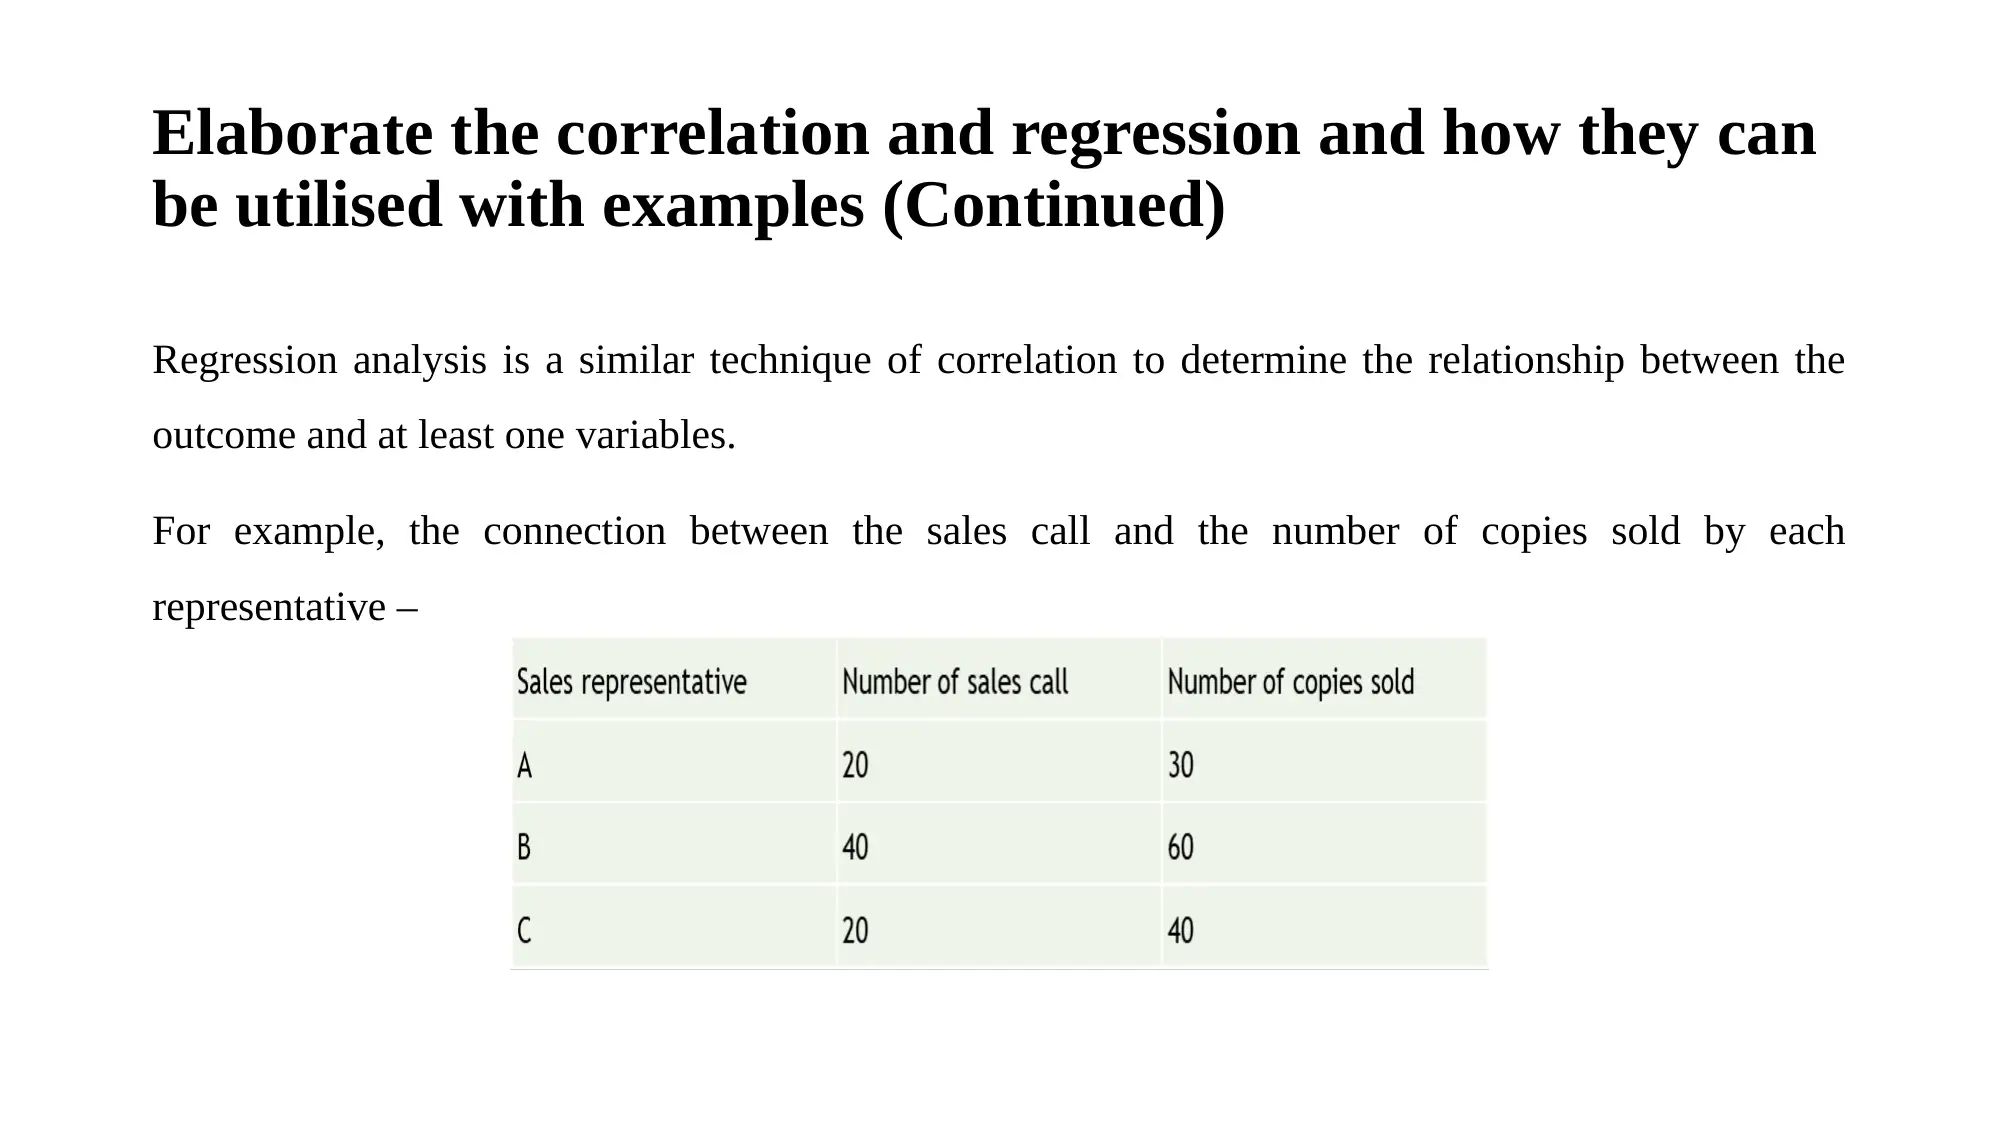
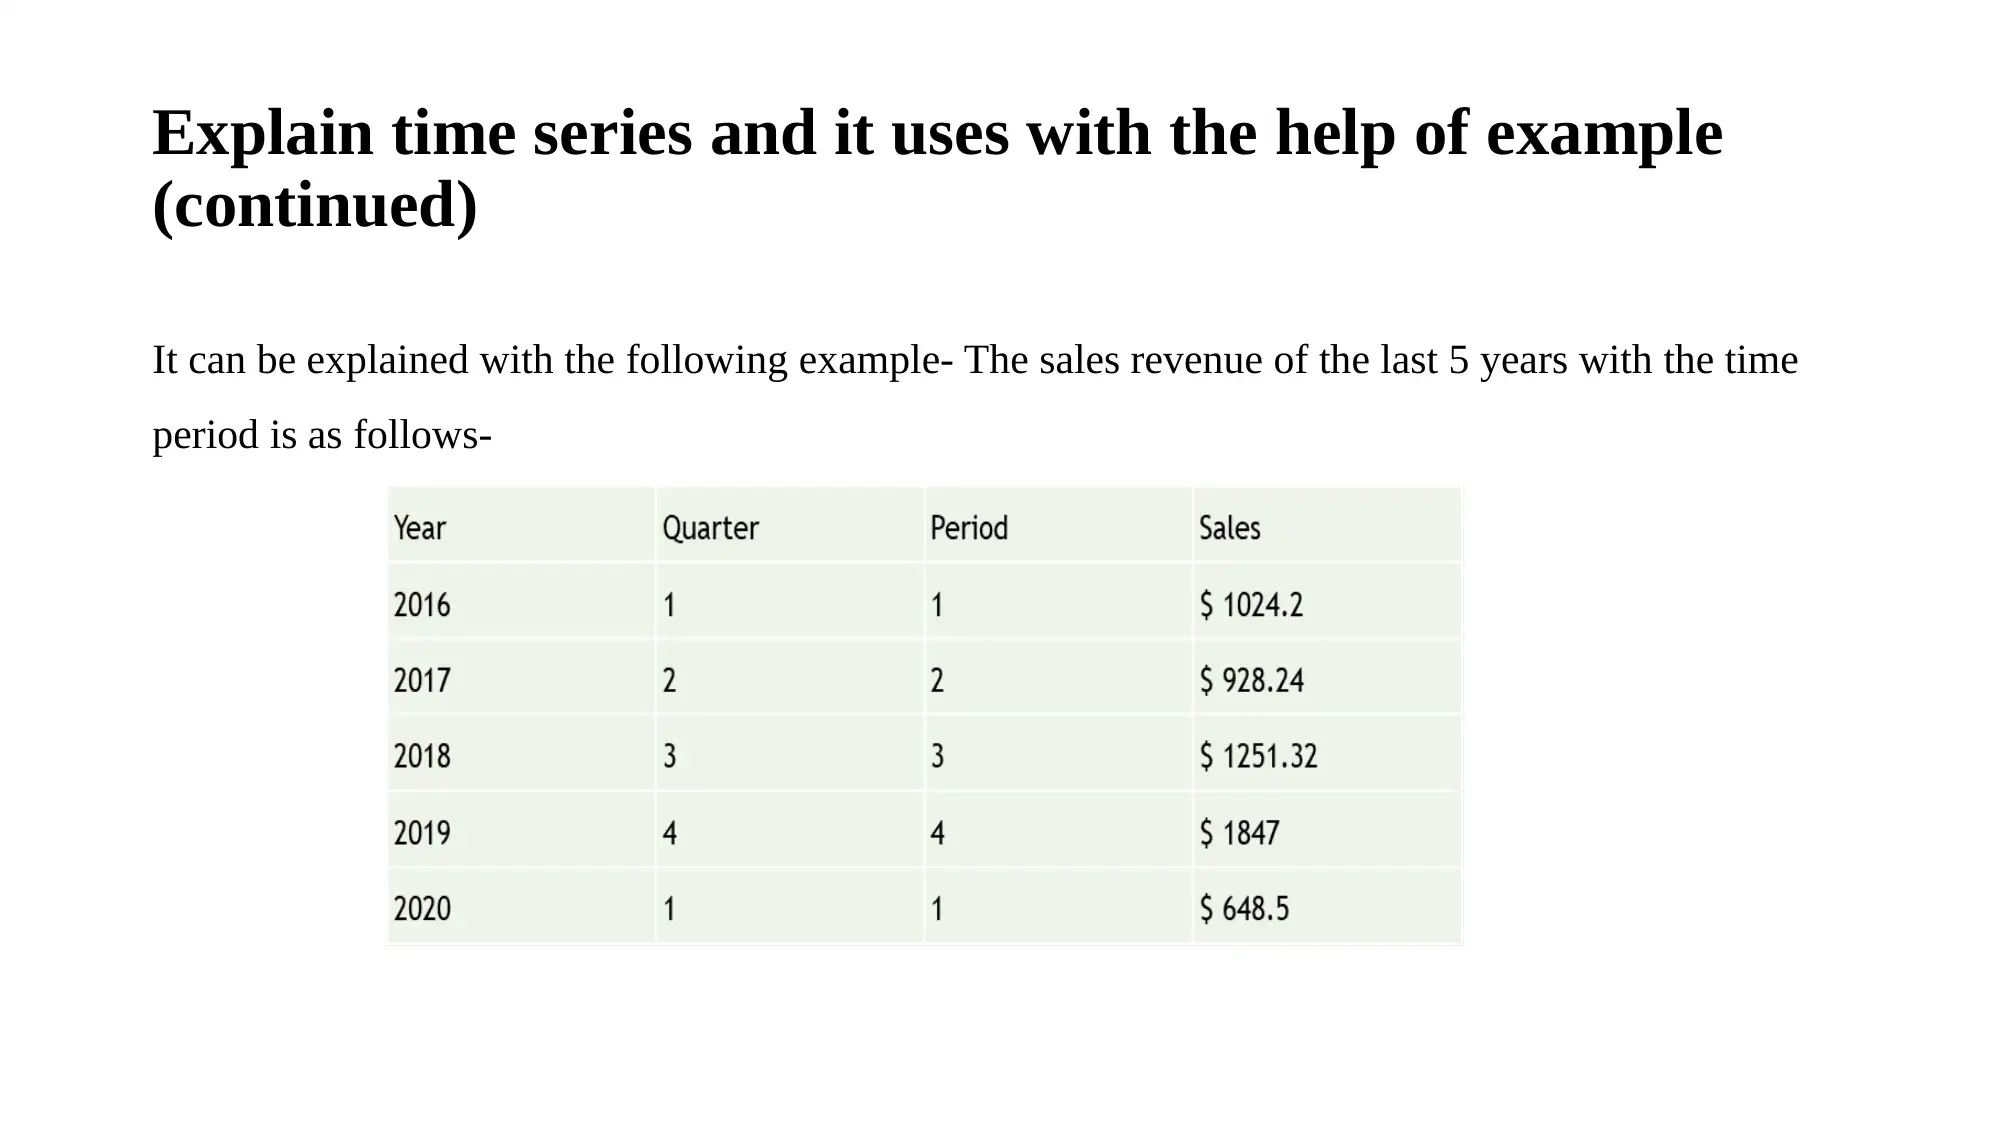
This presentation provides an overview of data insights, focusing on correlation and regression analysis, and time series analysis. Correlation analysis is presented as a method for measuring the relationship between two continuous variables, with an example of height and weight. Regression analysis, a similar technique, is explained as a way to determine the relationship between an outcome and one or more variables, exemplified by the connection between sales calls and copies sold. The presentation also covers time series analysis, defining it as a sequence of data points used to identify trends over time, and its application in decision-making related to future activities, illustrated with an example of sales revenue over five years. The report concludes that data presentation is crucial for evaluating data and information, and for making informed decisions based on the analysis of independent and dependent variables and time-related factors. Desklib offers solved assignments and past papers for students.
Document Page
Data Insights
tabler-icon-diamond-filled.svg

Paraphrase This Document

Need a fresh take? Get an instant paraphrase of this document with our AI Paraphraser
Document Page
CONTENTS
Introduction
Elaborate the correlation and regression and how they can be utilized
with examples.
Explain time series and it uses with the help of example.
Conclusion
References
Document Page
Introduction
Data presentation is a way that how the various
data sets are represented into the numerous
graphical formats and on the basis of that the
decisions are made (Becker, 2020). In this report,
the correlation and regression analysis is
elaborated and its uses are explained with the
help of example. Further, the times is described
with its utilisation.
Document Page
Elaborate the correlation and regression and how they can
be utilised with examples
Correlation is a an analysis that is applied for measuring the state between two continuous variables.
For Example, the relationship between height and weight can be determined by the following
example –
tabler-icon-diamond-filled.svg

Paraphrase This Document

Need a fresh take? Get an instant paraphrase of this document with our AI Paraphraser
Document Page
Elaborate the correlation and regression and how they can
be utilised with examples (Continued)
Regression analysis is a similar technique of correlation to determine the relationship between the
outcome and at least one variables.
For example, the connection between the sales call and the number of copies sold by each
representative –
Document Page
Explain time series and it uses with the help of example
A time series is a sequence of the data points which is used in the orderly format fro a specific
period of time over the years. This is based on the perception of the well – defined data sets that can
get repeated estimation over the time. It can be used to formulate the decision policies which are
related to future activities. It is also utilized in comparing the changes in the values of different time
period (Talei, Essaaidi and Benhaddou, 2018).
Document Page
Explain time series and it uses with the help of example
(continued)
It can be explained with the following example- The sales revenue of the last 5 years with the time
period is as follows-
tabler-icon-diamond-filled.svg

Paraphrase This Document

Need a fresh take? Get an instant paraphrase of this document with our AI Paraphraser
Document Page
Conclusion
It can be concluded from the above report that data presentation is very crucial element of data
insights. As it helps in evaluating the data and information relation to the subject or uses. The
correlation and regression analysis is taken for the specific type of variable, i.e., independent and
dependent variable. On the basis of this, the value and the decision is made about the data sets.
Further, the time series is used to analyse the relation between the factors within the time period.
Document Page
References
Becker, B., 2020. 7. Holocene Tree Ring Series from Southern Central Europe for Archaeologic Dating,
Radiocarbon Calibration, and Stable Isotope Analysis. In Radiocarbon Dating. (pp. 554-565). University of
California Press.
Hu, Z. and et. al., 2020. Tracking via context-aware regression correlation filter with a spatial–temporal
regularization. Journal of Electronic Imaging. 29(2). p.023029
Talei, H., Essaaidi, M. and Benhaddou, D., 2018, December. An end to end real time architecture for analyzing and
clustering time series data: case of an energy management system. In 2018 6th International Renewable and
Sustainable Energy Conference (IRSEC). (pp. 1-7). IEEE.
Xu, F. and Huang, L., 2018. The analysis of the civil aviation passenger traffic based on the improved multiple linear
regression model. International Journal of Engineering, Science and Mathematics. 7(9). pp.28-35.
chevron_up_icon
1 out of 9
circle_padding
hide_on_mobile
zoom_out_icon
[object Object]