Business Data Visualization Report: Unemployment and Trend Analysis
VerifiedAdded on 2019/12/28
|17
|1771
|807
Report
AI Summary
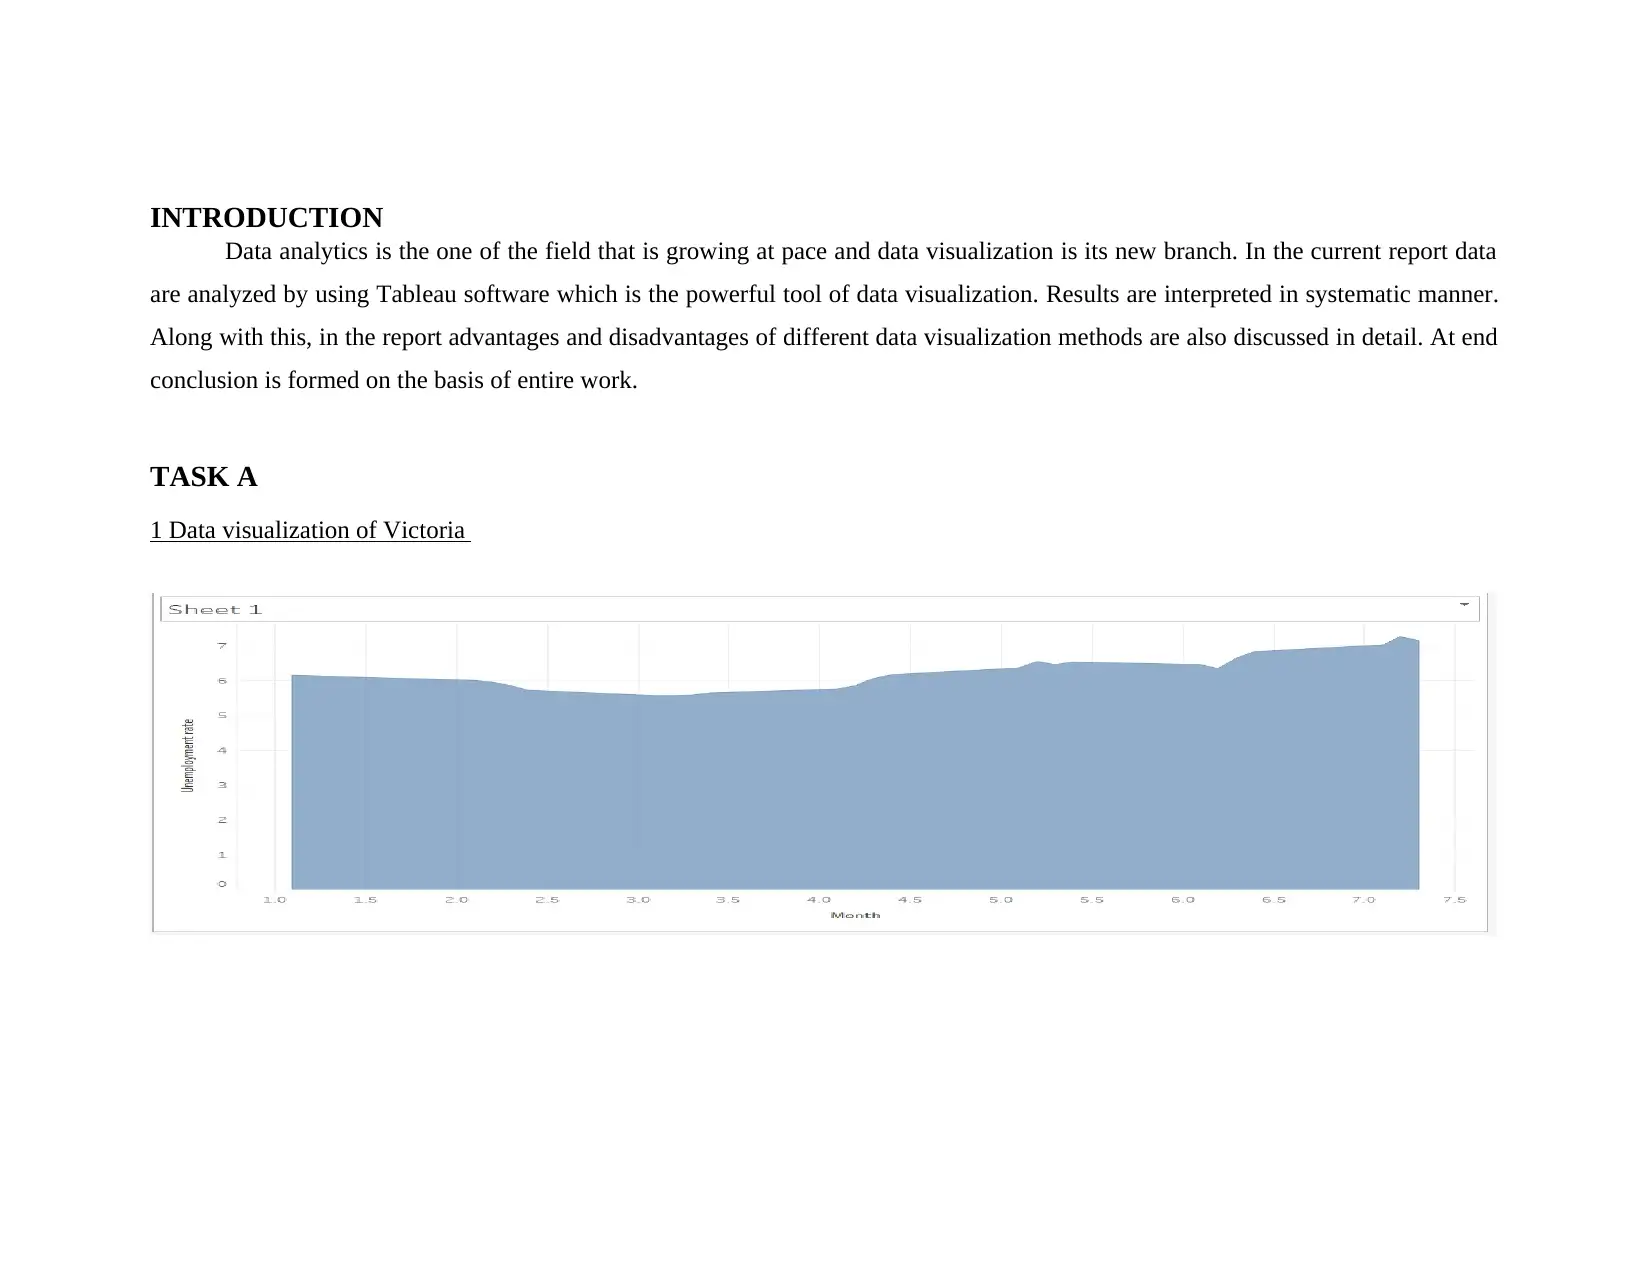
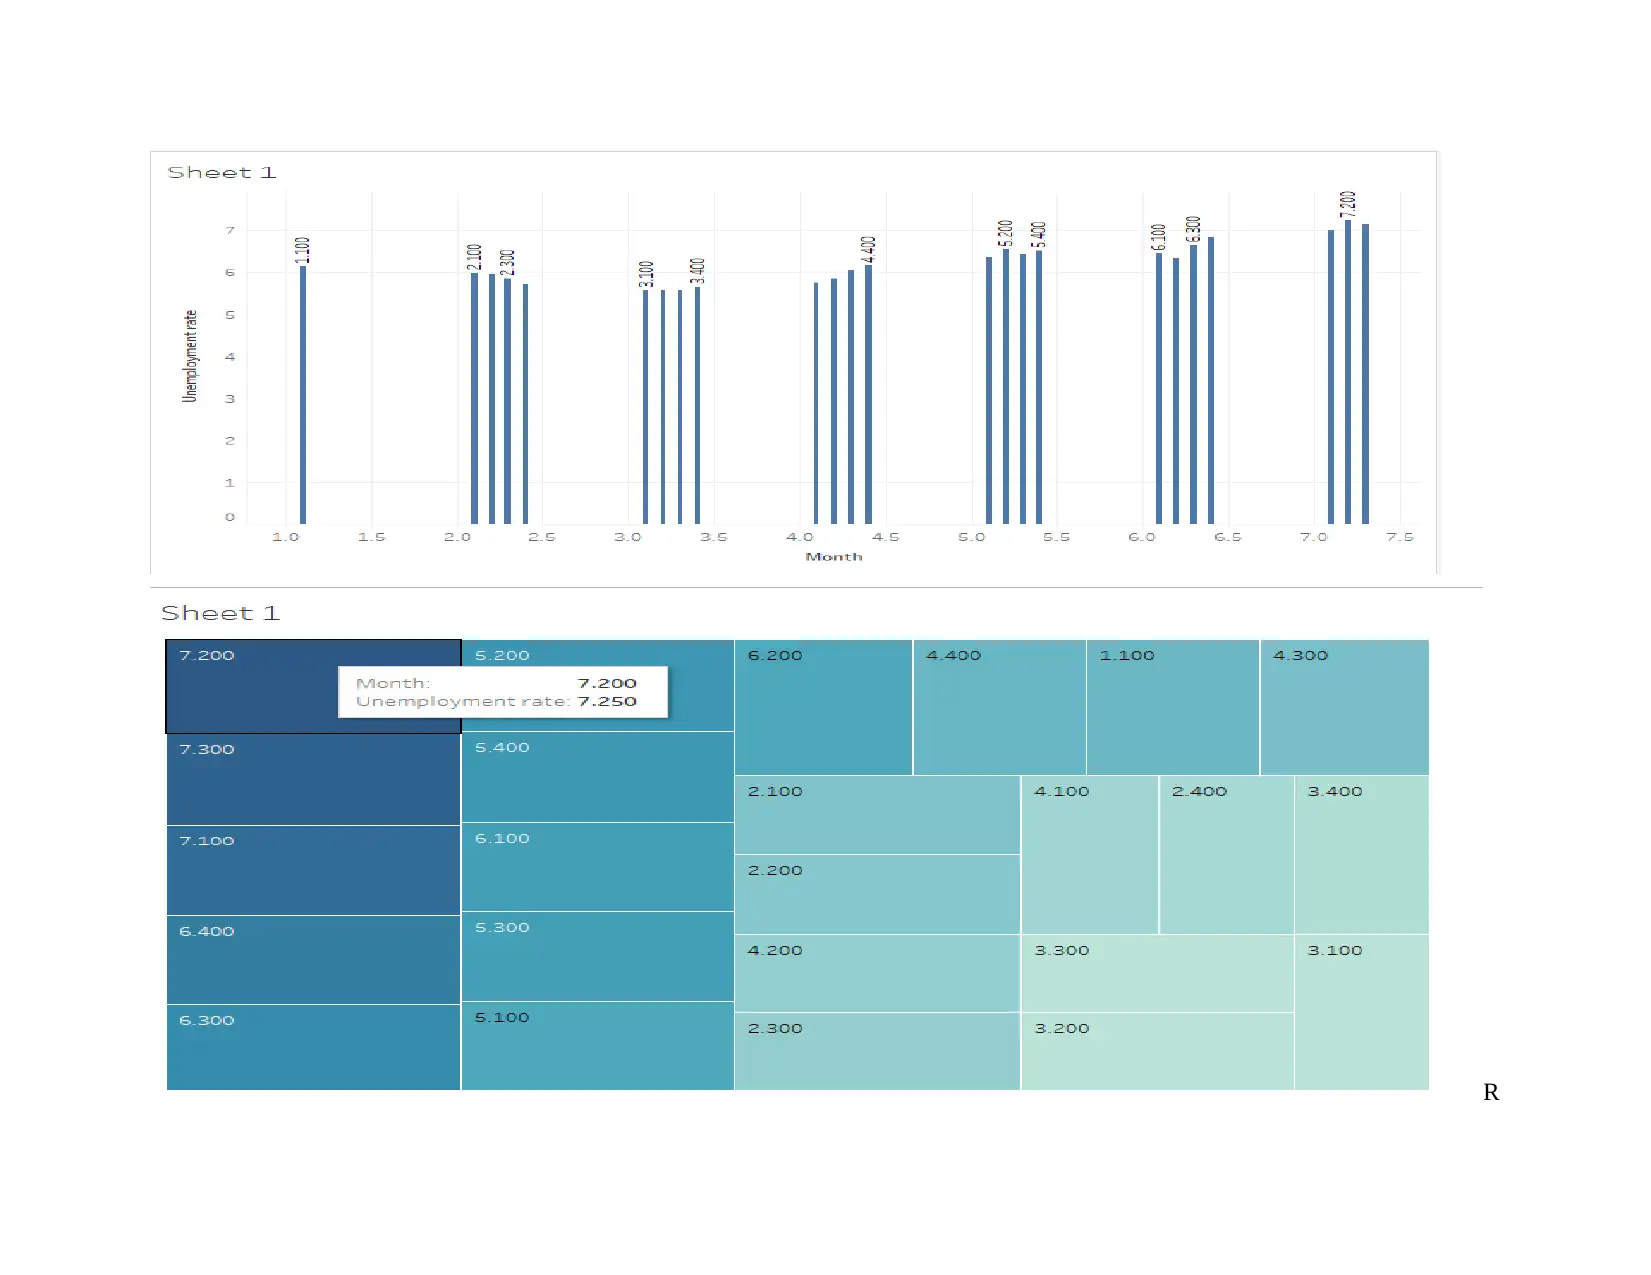
This report presents a comprehensive analysis of business data using data visualization techniques, primarily leveraging Tableau software. The analysis focuses on unemployment trends in Victoria, Australia, examining geographic data and age groups to identify hidden patterns and insights. The report includes detailed visualizations, interpretations of the data, and comparisons of different data visualization methods, such as Treemap and Sunburst, highlighting their advantages and disadvantages. The findings reveal significant fluctuations in unemployment rates across different geographic areas and age groups, emphasizing the need for targeted interventions. The report concludes with a summary of the importance of data visualization for business decision-making and the effective use of various chart types for data analysis.
1 out of 17

Your All-in-One AI-Powered Toolkit for Academic Success.
+13062052269
info@desklib.com
Available 24*7 on WhatsApp / Email
![[object Object]](/_next/static/media/star-bottom.7253800d.svg)
Copyright © 2020–2026 A2Z Services. All Rights Reserved. Developed and managed by ZUCOL.