Comprehensive Analysis of Business Income, Tax, and Performance
VerifiedAdded on 2023/06/12
|11
|353
|422
Homework Assignment
AI Summary
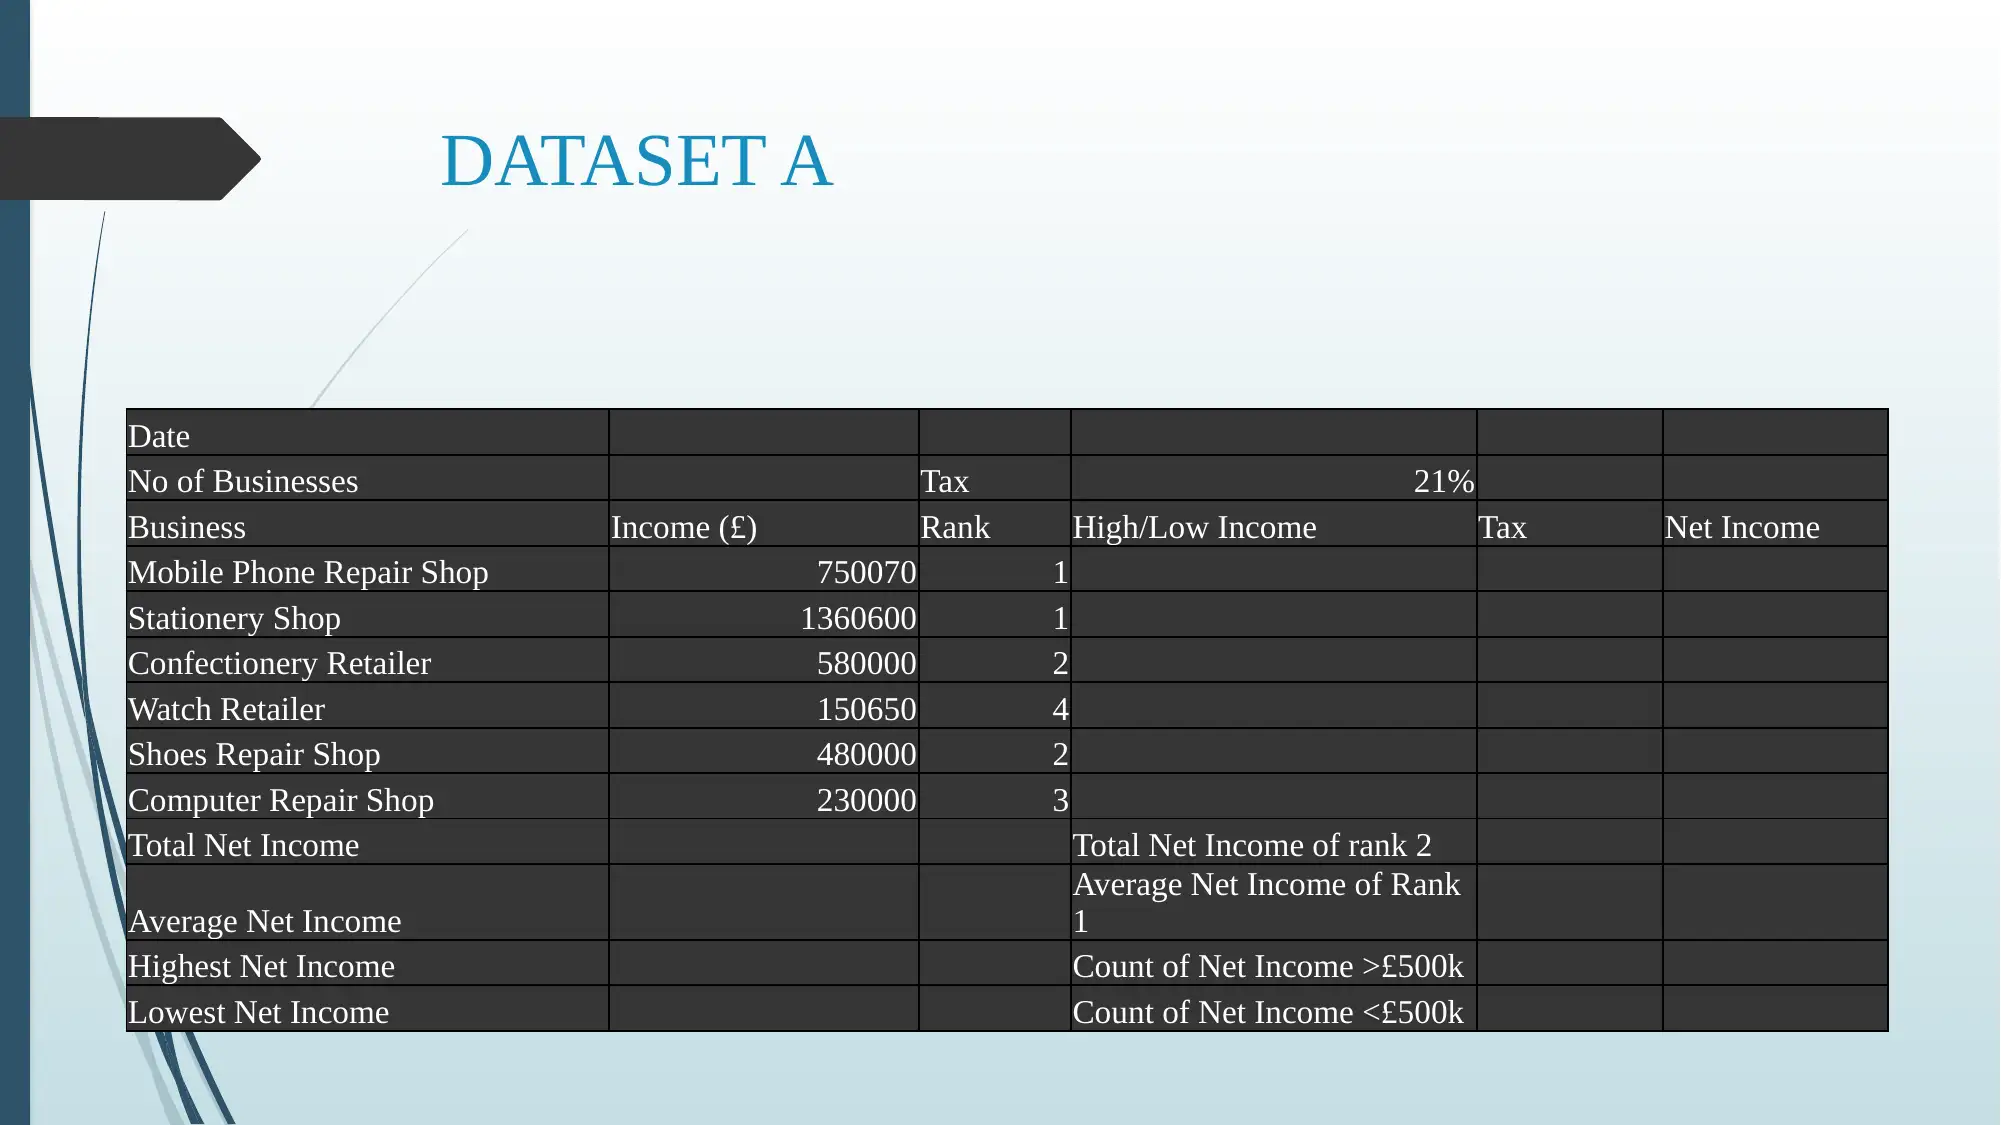
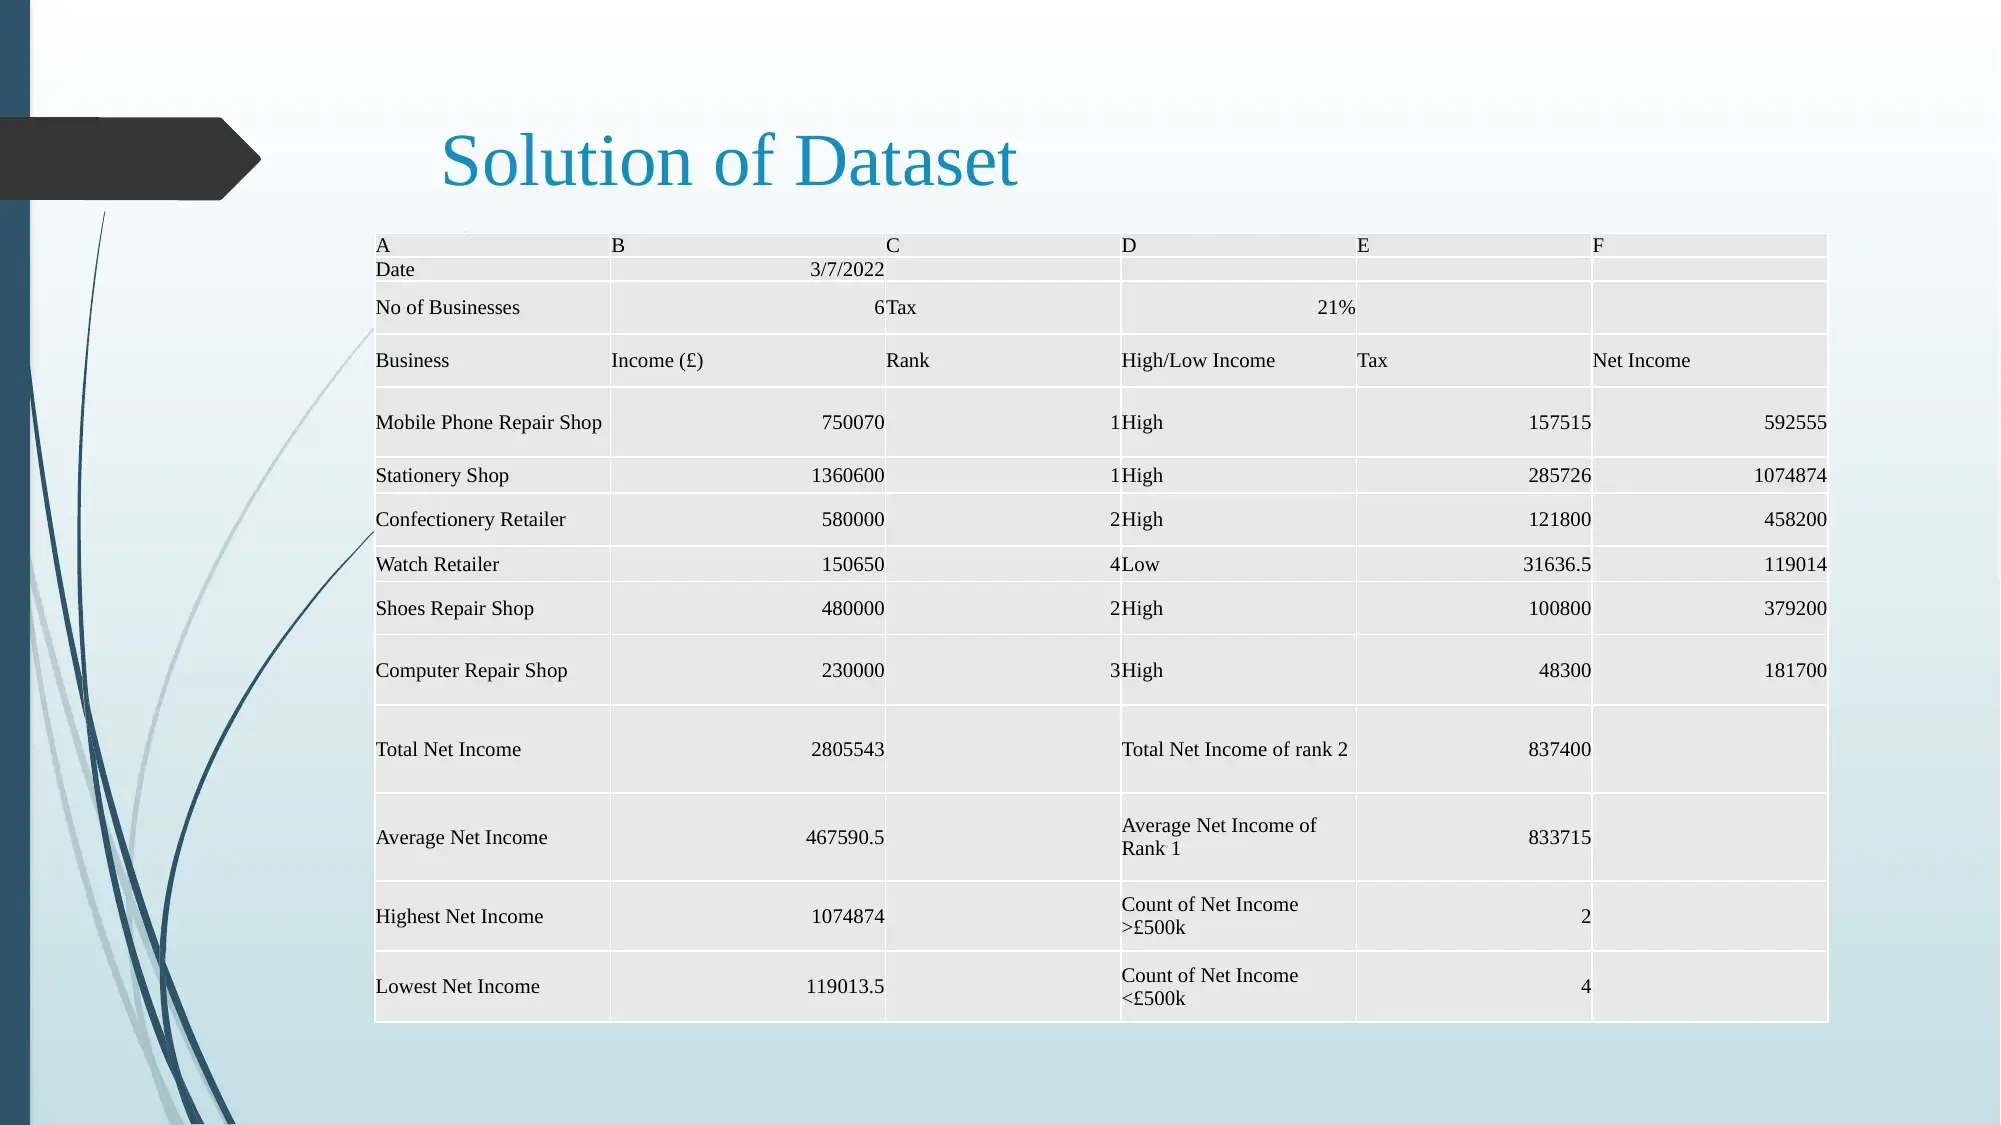
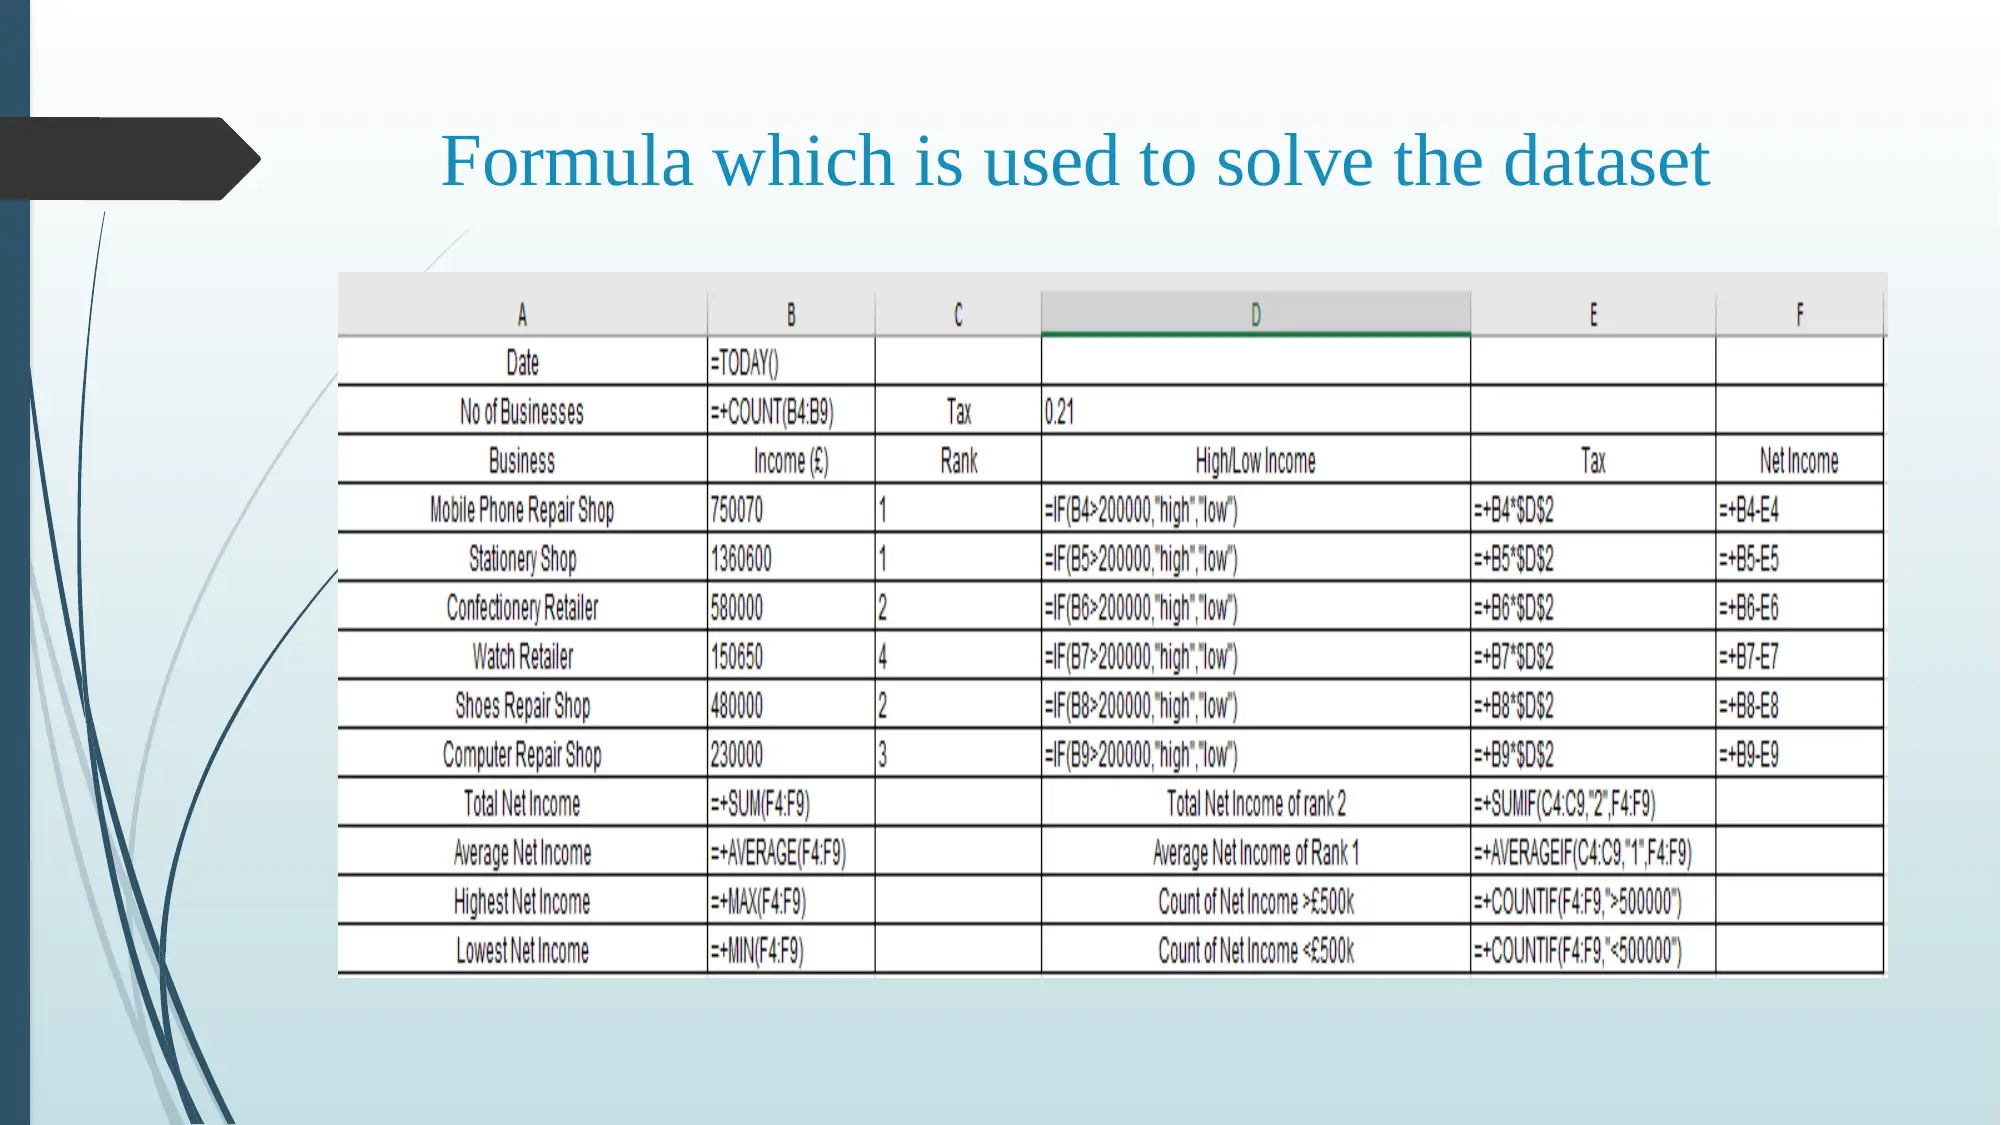
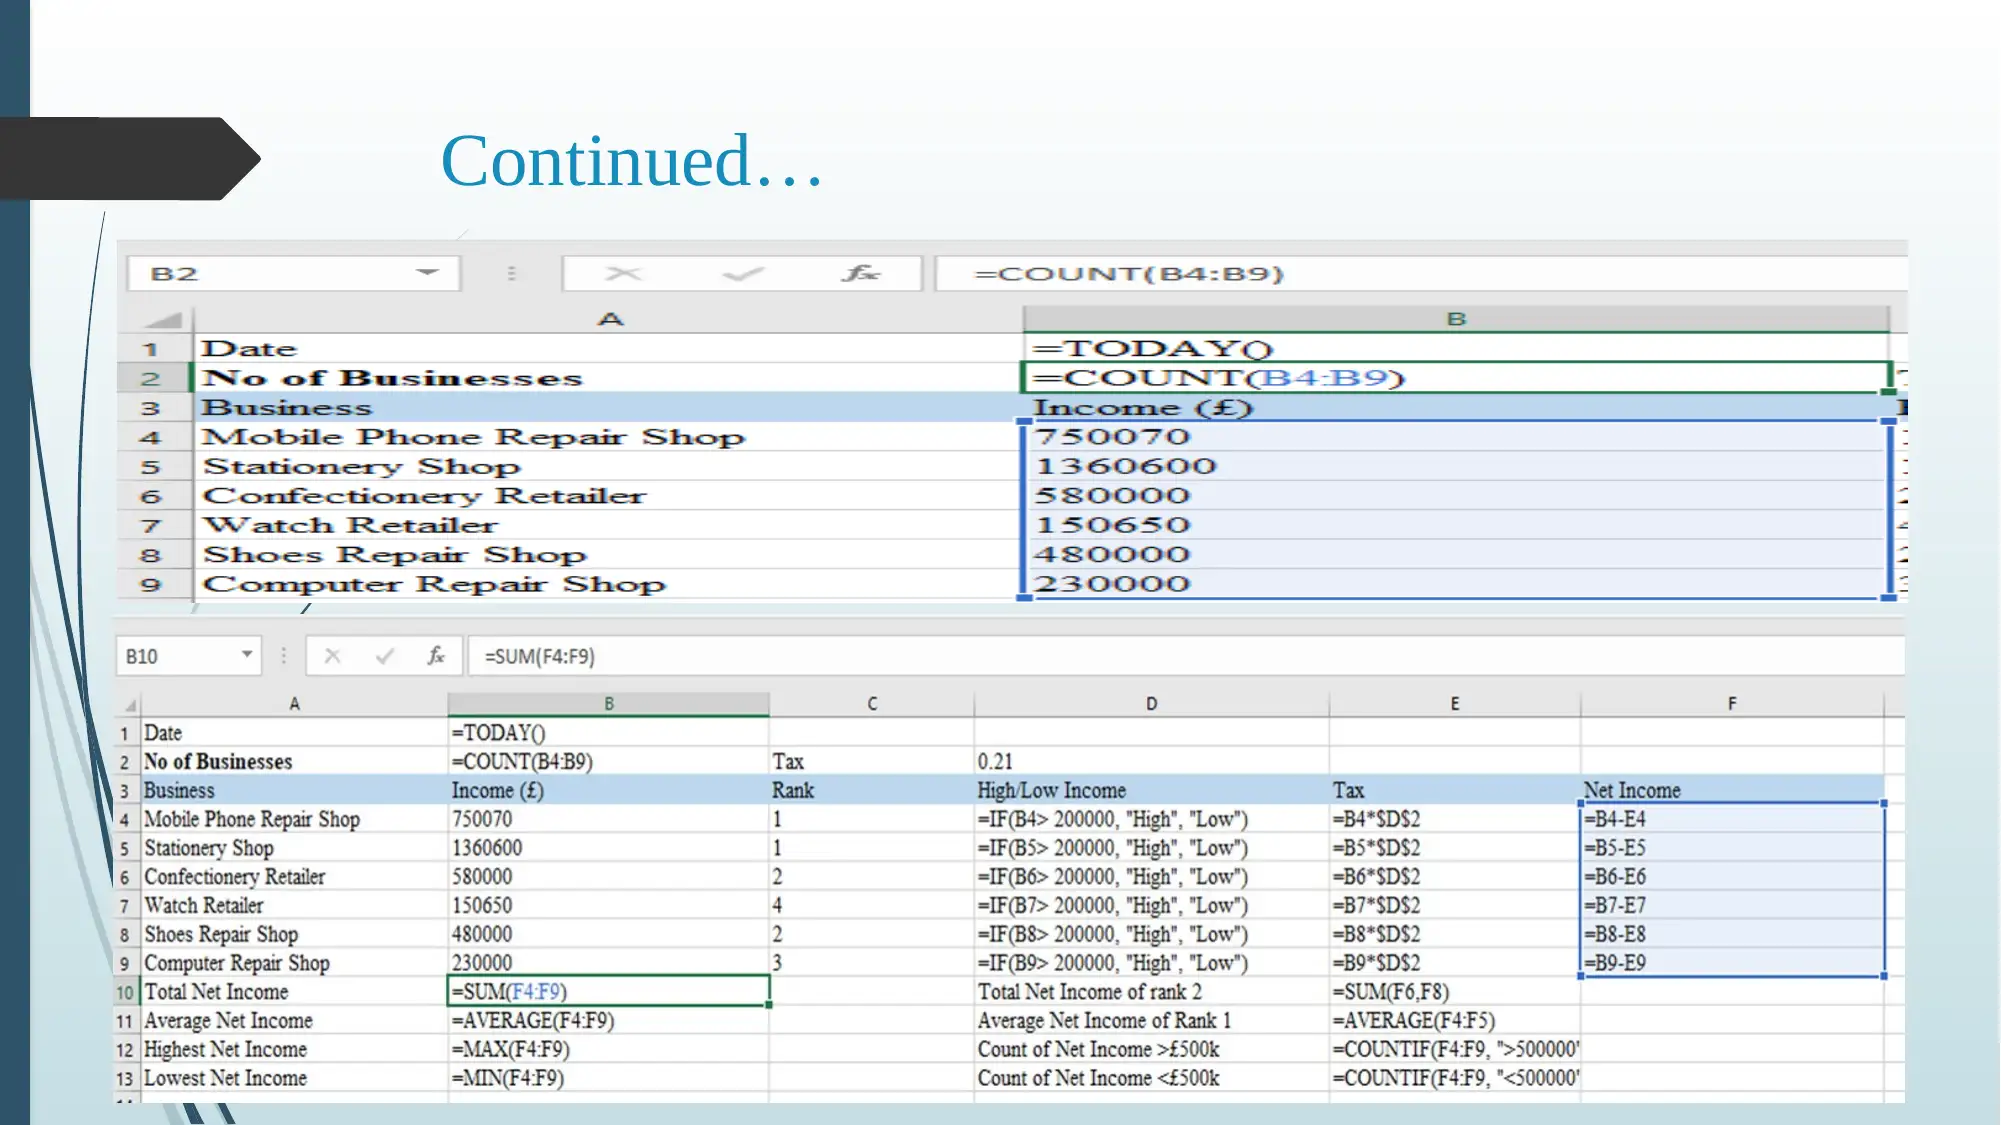
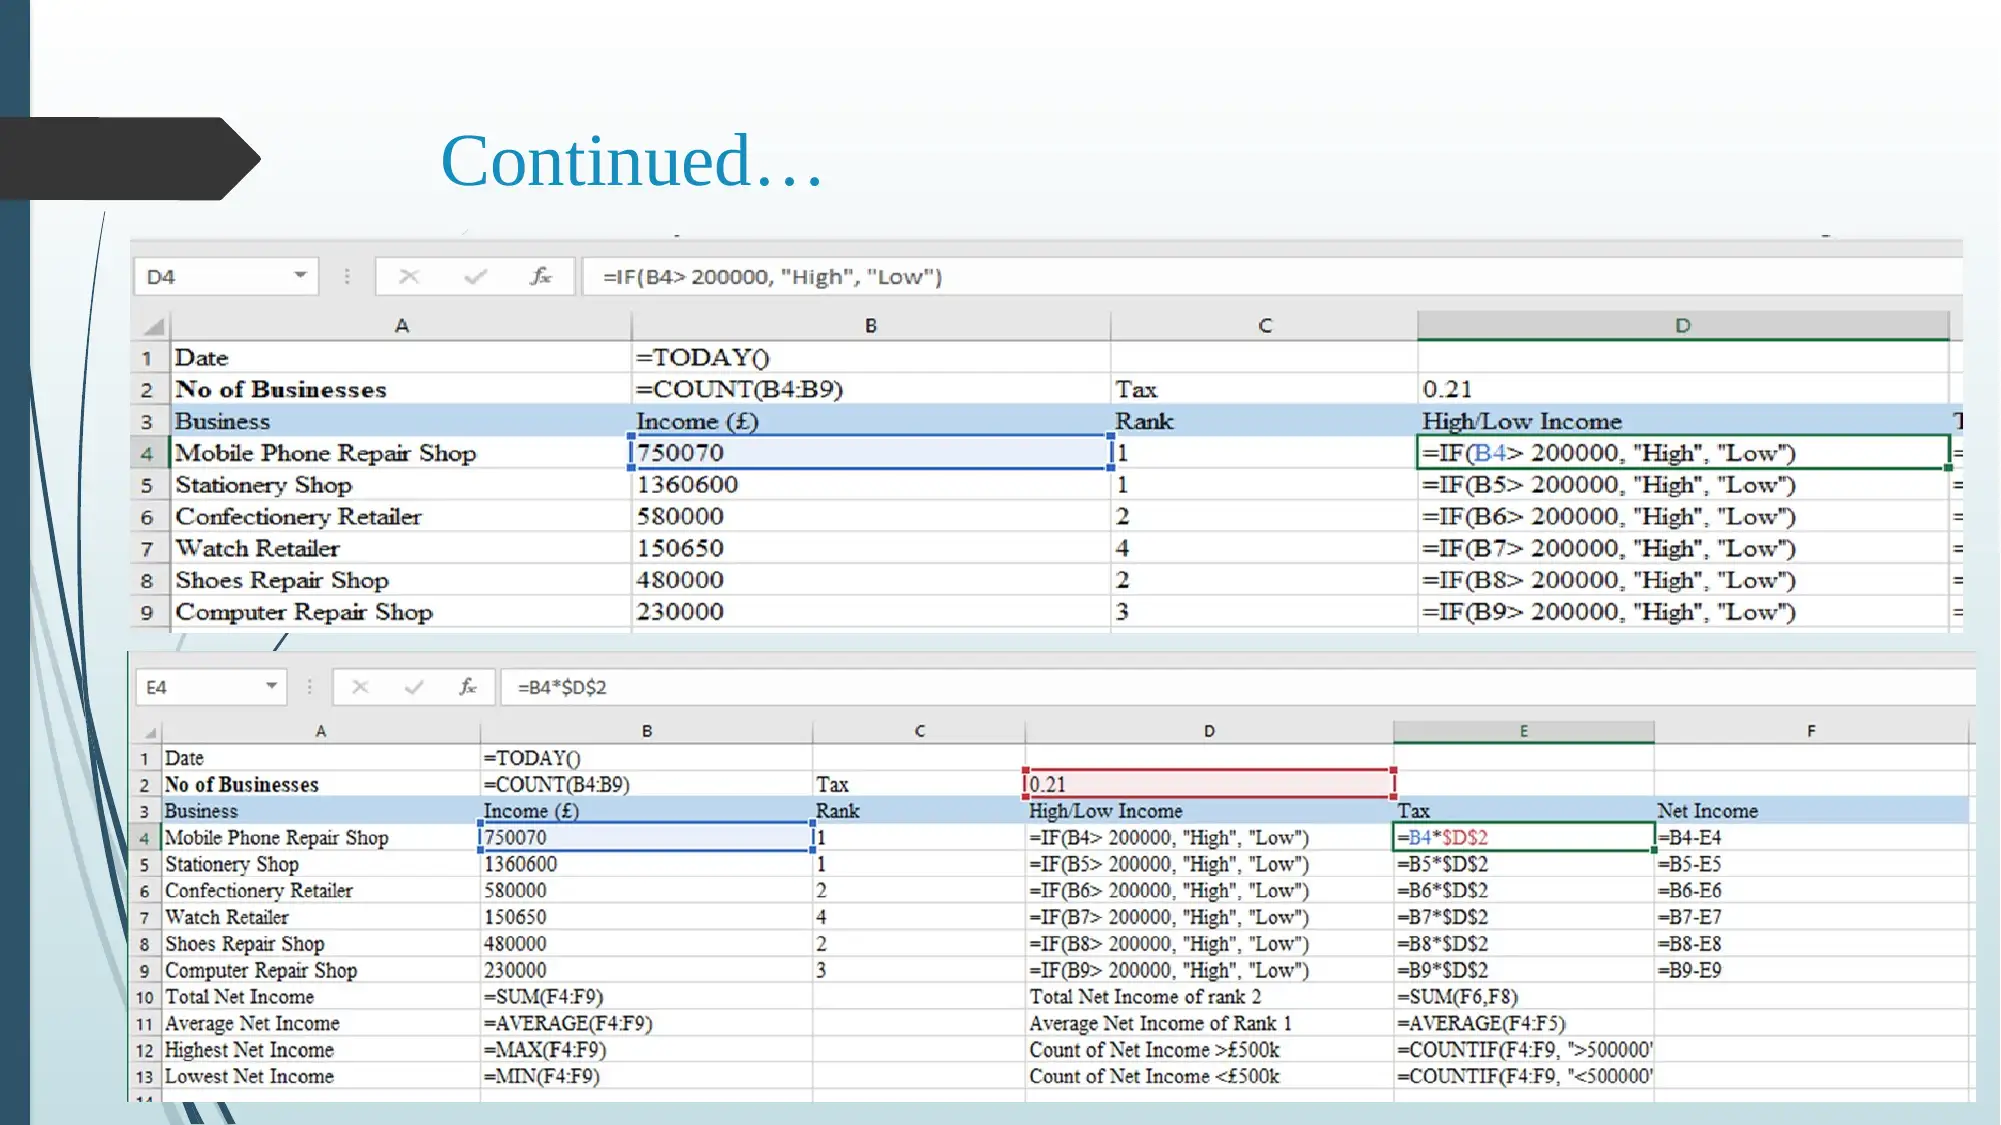
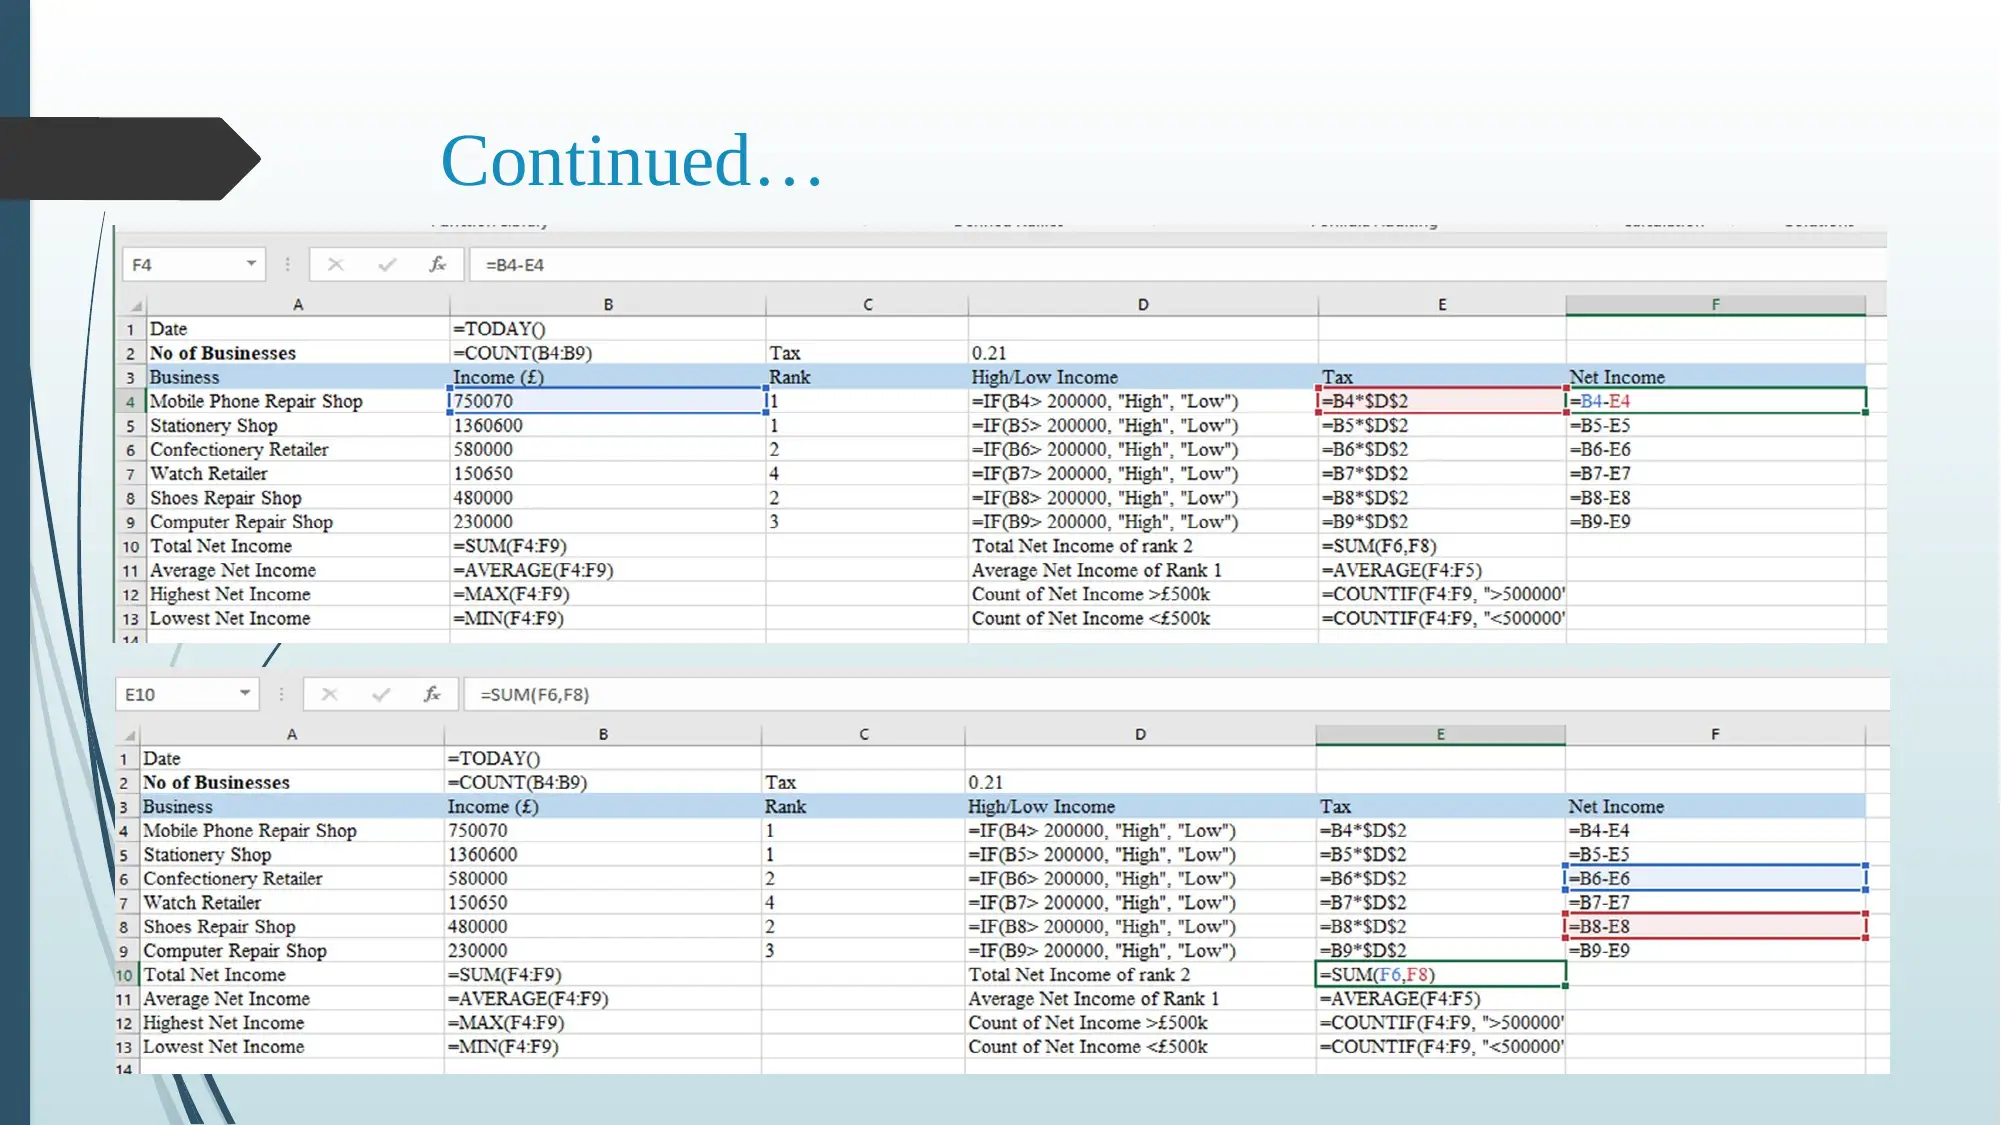
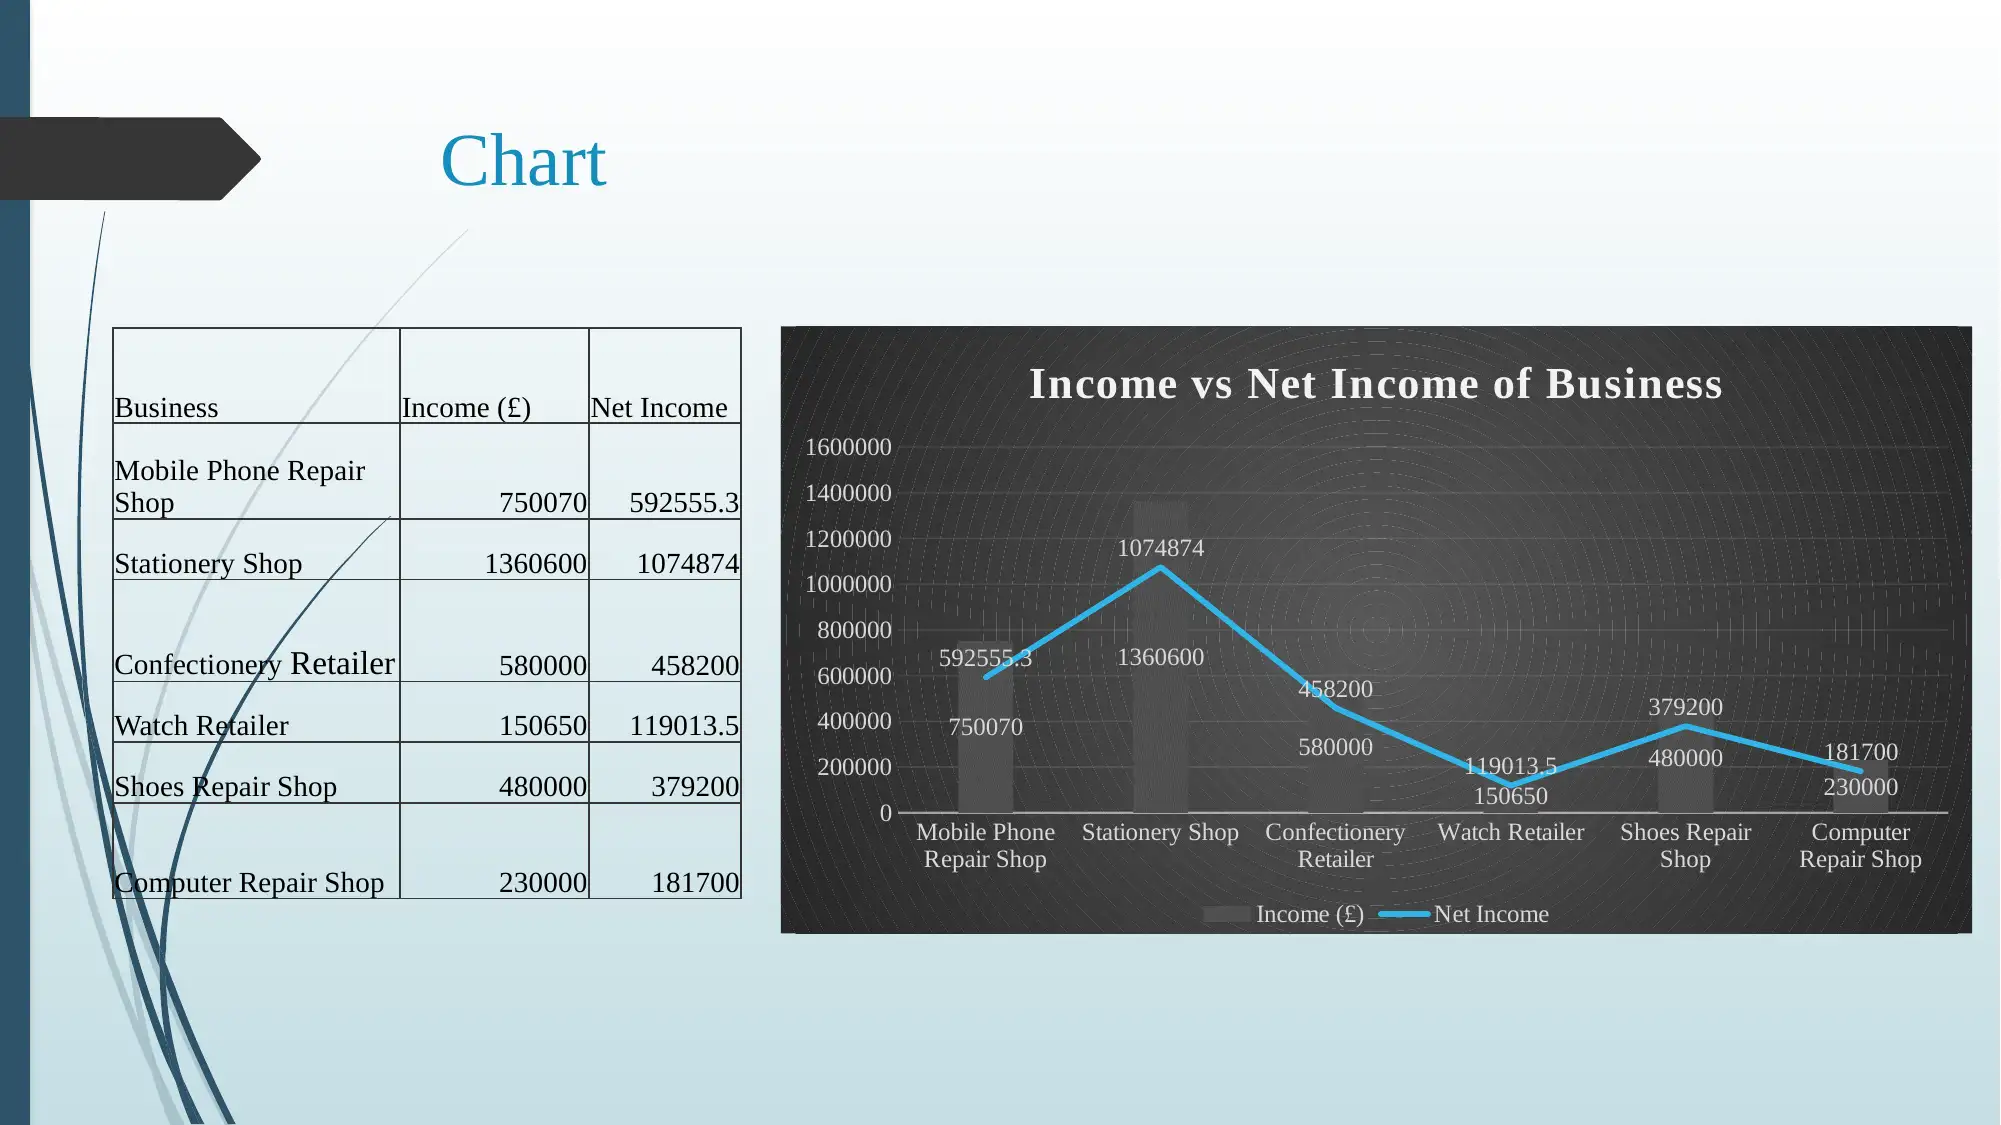
This assignment presents a detailed analysis of a business income dataset, focusing on key financial metrics and tax implications. The dataset includes information from various businesses, such as mobile phone repair shops, stationery shops, confectionery retailers, watch retailers, shoe repair shops, and computer repair shops. The analysis involves calculating the tax net income based on a given tax rate, determining income ranks (High/Low), and computing total and average net incomes. It also identifies the highest and lowest net incomes within the dataset. Furthermore, the assignment includes a visual representation of the data through charts, comparing income versus net income for each business. The formulas used for the calculations are referenced, and the findings are presented in a clear and organized manner, providing valuable insights into business performance and tax implications. Desklib provides access to similar solved assignments and past papers to aid students in their studies.


1 out of 11
Related Documents


Your All-in-One AI-Powered Toolkit for Academic Success.
+13062052269
info@desklib.com
Available 24*7 on WhatsApp / Email
![[object Object]](/_next/static/media/star-bottom.7253800d.svg)
Copyright © 2020–2026 A2Z Services. All Rights Reserved. Developed and managed by ZUCOL.