Centrifugal Pump Experiment Report
VerifiedAdded on 2019/09/30
|7
|1362
|163
Report
AI Summary
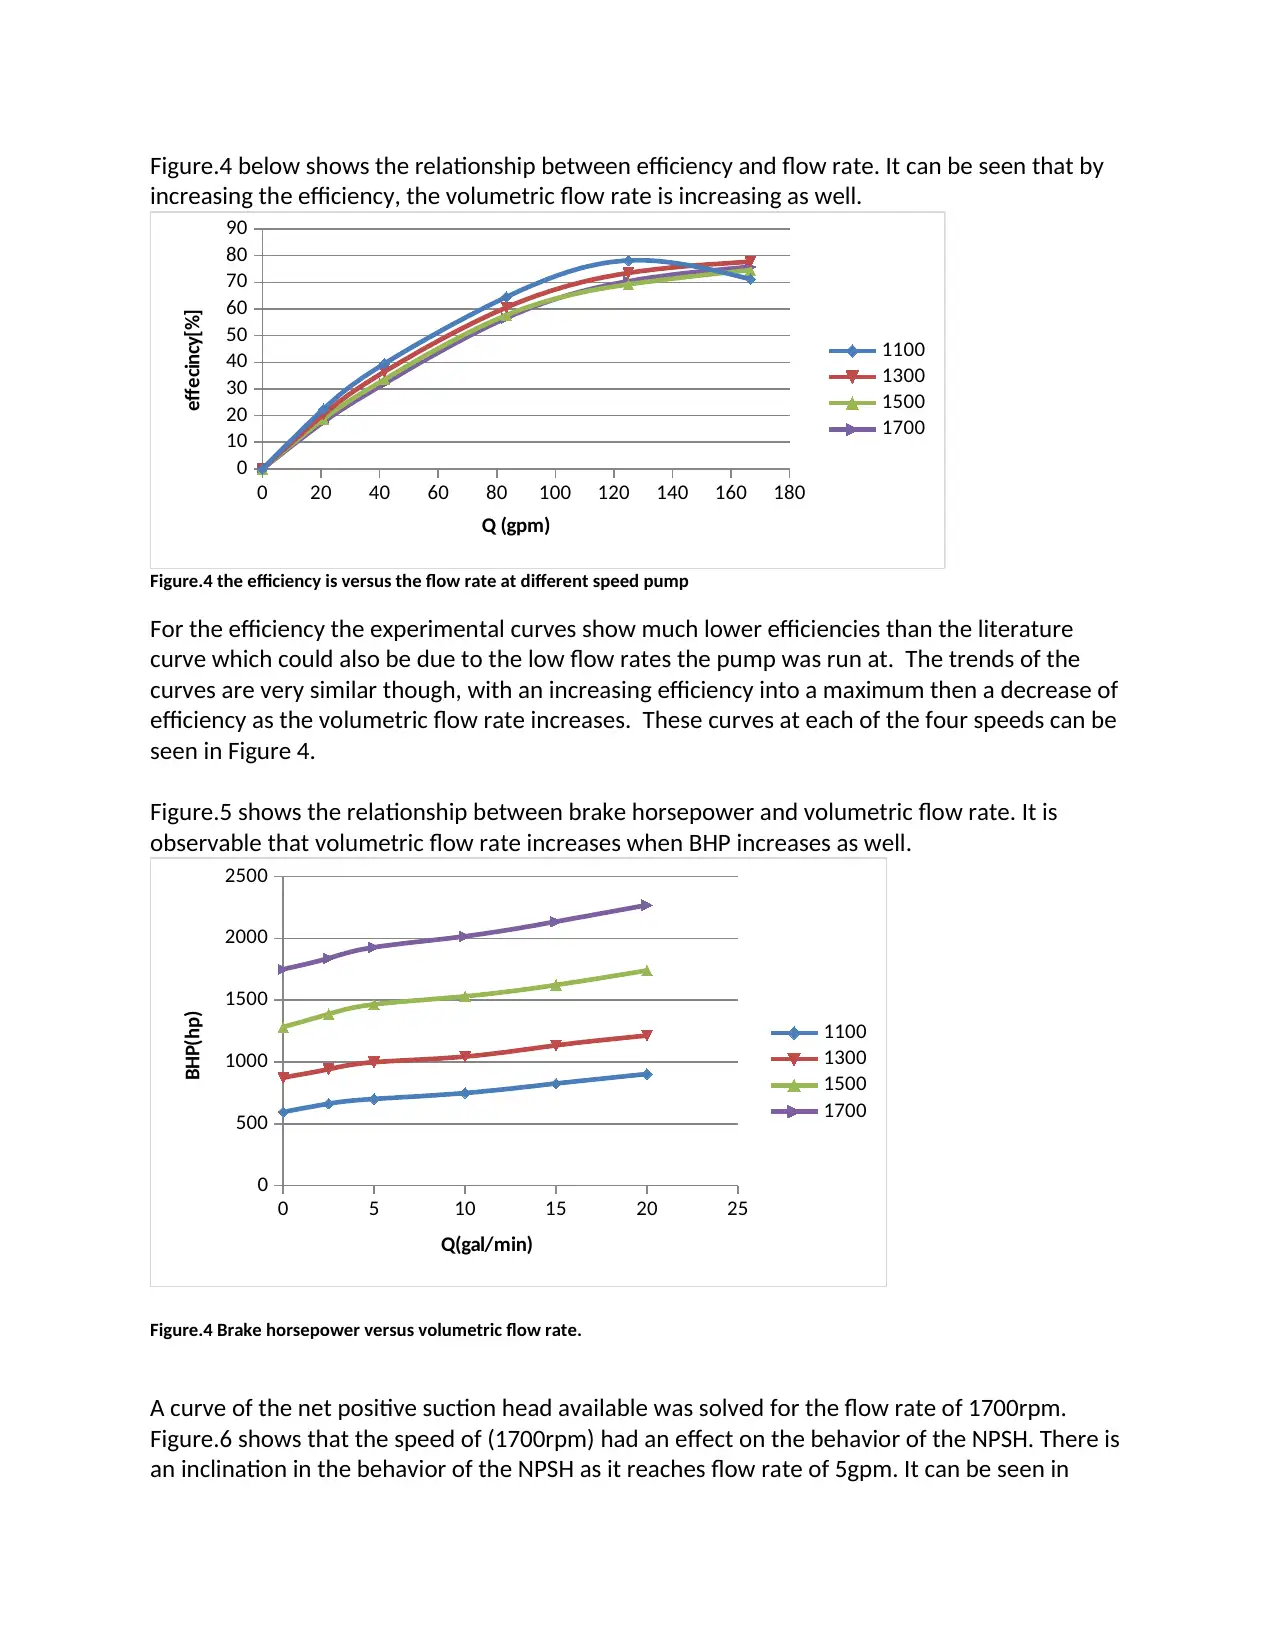
This report documents an experiment investigating the performance of a centrifugal pump. The experiment aimed to determine the effects of flow rate and speed on the pump's head, efficiency, and brake horsepower (BHP). The setup included a centrifugal pump, pressure gauges, a flow rate meter, ...

Date: October 8, 2012
Summary
In this experiment the investigation of a centrifugal pump was done to determine the
effect of flow rate and speed on the head, efficiency and brake horsepower requirement of a
centrifugal pump. Three separate experiments were done and data were measure at different
speeds with different flow rates. Further calculations were made by utilizing numerous
equations in order to obtain values of pump head (hp), shaft work (BHP), net positive section
head (NPSH) and the efficiency. It is observed that the brake horsepower at different pump
speeds decreases as flow rate increases. Moreover, it is concluded that the efficiency increases
with the flow rate, however, at certain point that is 80%, and the efficiency starts to decline.
Furthermore, final results exhibit that the shaft work increases gradually as the flow rate
increases. Therefore, they are correlated directly to each other due to this behavior.
Surprisingly, at 1700 rpm, the net positive suction head drops rapidly with increasing the flow
rate.
Background and Methods
Pump System Description
The main objective of this experiment was to determine the impact of flow rate and
speed on the head, efficiency and brake horsepower requirement of a centrifugal pump. The
centrifugal pump as seen in figure 11 was used for this experiment. The pump receives water
from the tank, labeled as 9 in figure 1, which is connected to the suction line going into the
pump. The discharge line consists of a valve to allow for user variance of the volumetric flow
rate. Then, the water is returned to the tank. In order to measure the suction and discharge
pressures, two gauges connected to respective lines are used. Additionally, Torque reading is
obtained from the torque gauge that is fitted on the pump.
Pump Equipment
The system in figure 1 consists of:
Paraphrase This Document
Need a fresh take? Get an instant paraphrase of this document with our AI Paraphraser

1A- Suction Pressure gauge, P1 [in.H2O gauge].
1B- Discharge Pressure gauge, P2 [psig].
2A- Inlet (Suction) line.
2B- Outlet (Discharge) line.
3- Shaft Torque meter ().
4- Flow rate meter.
5-Rheostat for pump speed control.
6- Stroboscope to set pump rpm.
7-Pump Impeller
8-Pump Motor.
Measurement Procedure
The centrifugal pump was run at four speeds; 1100, 1300, 1500 and 1700 revolution per
minute (rpm). The motor rheostat, labeled as 5 in figure 1, was used to adjust these readings
and made accurate by using the stroboscope (6). At each different speed, measurements of the
suction pressure using gauge 1A from figure 1, discharge pressure from gauge 1B and the
torque from 3 were measured. Those measurements were taken at flow rates of 0, 2.5,5,10,15
and 20 gallons per minute. After that, the motor was stopped slowly by decreasing the rheostat
to zero. Finally, the pump was operated in reverse rotation at different speeds, and the flow
rate with discharge valve wide open was observed.
Centrifugal Pump Calculation
To calculate head of the pump (hp), McCabe, Smith, and Harriott, 5th edition 2 gives Equation.1 to
be applied.
hp= Pb−Pa
ρ (1)
Where:
pa = pump suction pressure [lbf/ft2]
pb = pump discharge pressure [lbf/ft2]
= Density of fluid [lbm/ft3]
According to McCabe, Smith, and Harriott, 5th edition 2, the shaft work or horsepower for the
pump can be calculated from the shaft torque and rpm readings in Equation.2:
Figure 11. The pump system that has been used for the
experiment.

BHP=2 πτn (2)
Where:
τ = shaft torque [lbf-ft]
n = shaft speed [min-1]
BHP= shaft work [lbf-ft/min]
Based on McCabe, Smith, and Harriott, 5th edition 2, the ideal pump work per unit mass flow rate
[Ibf ft/Ibm} can be calculated from Equation.3:
Wp= BHP/m (3)
Where:
m=mass flowrate (Ibm/min)
McCabe, Smith, and Harriott, 5th edition 2 gave Equation.4, where NPSH can be calculated in
feet:
NPSH a= gc
g ( pa ' − pv
ρ −hfs )−Za (4)
Where,
Pa’ = absolute pressure at surface of reservoir [lbf/ft2]
Pv = vapor pressure of fluid [lbf/ft2]
hfs = friction loss in suction line [lbf- ft/lbm]
Za = height of pump above surface of suction reservoir
Result and Discussion
The centrifugal pump was operated at three different times. Each time, the pump was
operated at four different speeds, 1100, 1300, 1500 and 1700 revolutions per minute. Speeds
were operated at six different flow rates. On each time, the inlet and outlet pressures were
measured and the torque of the pump as well. Figure.2 below shows a typical centrifugal pump
curve.
Where:
τ = shaft torque [lbf-ft]
n = shaft speed [min-1]
BHP= shaft work [lbf-ft/min]
Based on McCabe, Smith, and Harriott, 5th edition 2, the ideal pump work per unit mass flow rate
[Ibf ft/Ibm} can be calculated from Equation.3:
Wp= BHP/m (3)
Where:
m=mass flowrate (Ibm/min)
McCabe, Smith, and Harriott, 5th edition 2 gave Equation.4, where NPSH can be calculated in
feet:
NPSH a= gc
g ( pa ' − pv
ρ −hfs )−Za (4)
Where,
Pa’ = absolute pressure at surface of reservoir [lbf/ft2]
Pv = vapor pressure of fluid [lbf/ft2]
hfs = friction loss in suction line [lbf- ft/lbm]
Za = height of pump above surface of suction reservoir
Result and Discussion
The centrifugal pump was operated at three different times. Each time, the pump was
operated at four different speeds, 1100, 1300, 1500 and 1700 revolutions per minute. Speeds
were operated at six different flow rates. On each time, the inlet and outlet pressures were
measured and the torque of the pump as well. Figure.2 below shows a typical centrifugal pump
curve.
⊘ This is a preview!⊘
Do you want full access?
Subscribe today to unlock all pages.

Trusted by 1+ million students worldwide

Figure 2 3. Centrifugal pump performance curves
Figure 23 above shows a typical head capacity curves for a centrifugal pump. It
can be seen that as the volumetric flow rate increases as the pump head decreases. Figure.3
below shows the behavior of pump head at different flow rates with different speeds of pump.
The head does not decrease sharply, but it may be because of the lower volumetric flow rates
used for the experiment.
0 5 10 15 20 25
0
5
10
15
20
1100
1300
1500
1700
Q(gpm)
hp(feet)
Figure.3 Pump head versus volumetric flow rate.
Paraphrase This Document
Need a fresh take? Get an instant paraphrase of this document with our AI Paraphraser

Figure.4 below shows the relationship between efficiency and flow rate. It can be seen that by
increasing the efficiency, the volumetric flow rate is increasing as well.
0 20 40 60 80 100 120 140 160 180
0
10
20
30
40
50
60
70
80
90
1100
1300
1500
1700
Q (gpm)
effecincy[%]
Figure.4 the efficiency is versus the flow rate at different speed pump
For the efficiency the experimental curves show much lower efficiencies than the literature
curve which could also be due to the low flow rates the pump was run at. The trends of the
curves are very similar though, with an increasing efficiency into a maximum then a decrease of
efficiency as the volumetric flow rate increases. These curves at each of the four speeds can be
seen in Figure 4.
Figure.5 shows the relationship between brake horsepower and volumetric flow rate. It is
observable that volumetric flow rate increases when BHP increases as well.
0 5 10 15 20 25
0
500
1000
1500
2000
2500
1100
1300
1500
1700
Q(gal/min)
BHP(hp)
Figure.4 Brake horsepower versus volumetric flow rate.
A curve of the net positive suction head available was solved for the flow rate of 1700rpm.
Figure.6 shows that the speed of (1700rpm) had an effect on the behavior of the NPSH. There is
an inclination in the behavior of the NPSH as it reaches flow rate of 5gpm. It can be seen in

figure 6 below that there is a sharp trend decline at 5gpm for the net positive suction head as
the flow rate increases because of the high pump speed.
0 5 10 15 20 25
24.2
24.4
24.6
24.8
25
25.2
25.4
25.6
25.8
26
Volumetric flowrate[gpm]
NPSH(ft)
Figure.6 the net positive suction head is versus the flow rate at 1700rpm.
References:
1- McCabe, W.L., J.C. Smith, and P. Harriott (1993). Ch. 8 Transportation and Metering of
Fluids, in Unit Operations of Chemical Engineers, 5th edition. McGraw-Hill, New York. p.
195-204.
2- "Centrifugal Pumps." Http://www.pumpstroubleshooting.com/centrifugal-pumps.html.
Fuel Diaphragm Reciprocating Centrifugal Heat Pump Troubleshooting, 6 Sept. 2009.
Web. 17 Feb. 2012.
Appendices:
For further information about the calculations and the data on tables, a detailed excel file is
attached that has every single step of how variables were calculated such as the brake
horsepower (BHP), net positive section head (NPSH), and efficiency. All these data were
⊘ This is a preview!⊘
Do you want full access?
Subscribe today to unlock all pages.

Trusted by 1+ million students worldwide

collected within three weeks; thus, mean and standard deviation calculation were made for
further accuracy.
further accuracy.
1 out of 7
Related Documents

Your All-in-One AI-Powered Toolkit for Academic Success.
+13062052269
info@desklib.com
Available 24*7 on WhatsApp / Email
Unlock your academic potential
© 2024 | Zucol Services PVT LTD | All rights reserved.