Statistics Assignment: Hypothesis Testing and Statistical Analysis
VerifiedAdded on 2023/01/11
|7
|1124
|23
Homework Assignment
AI Summary
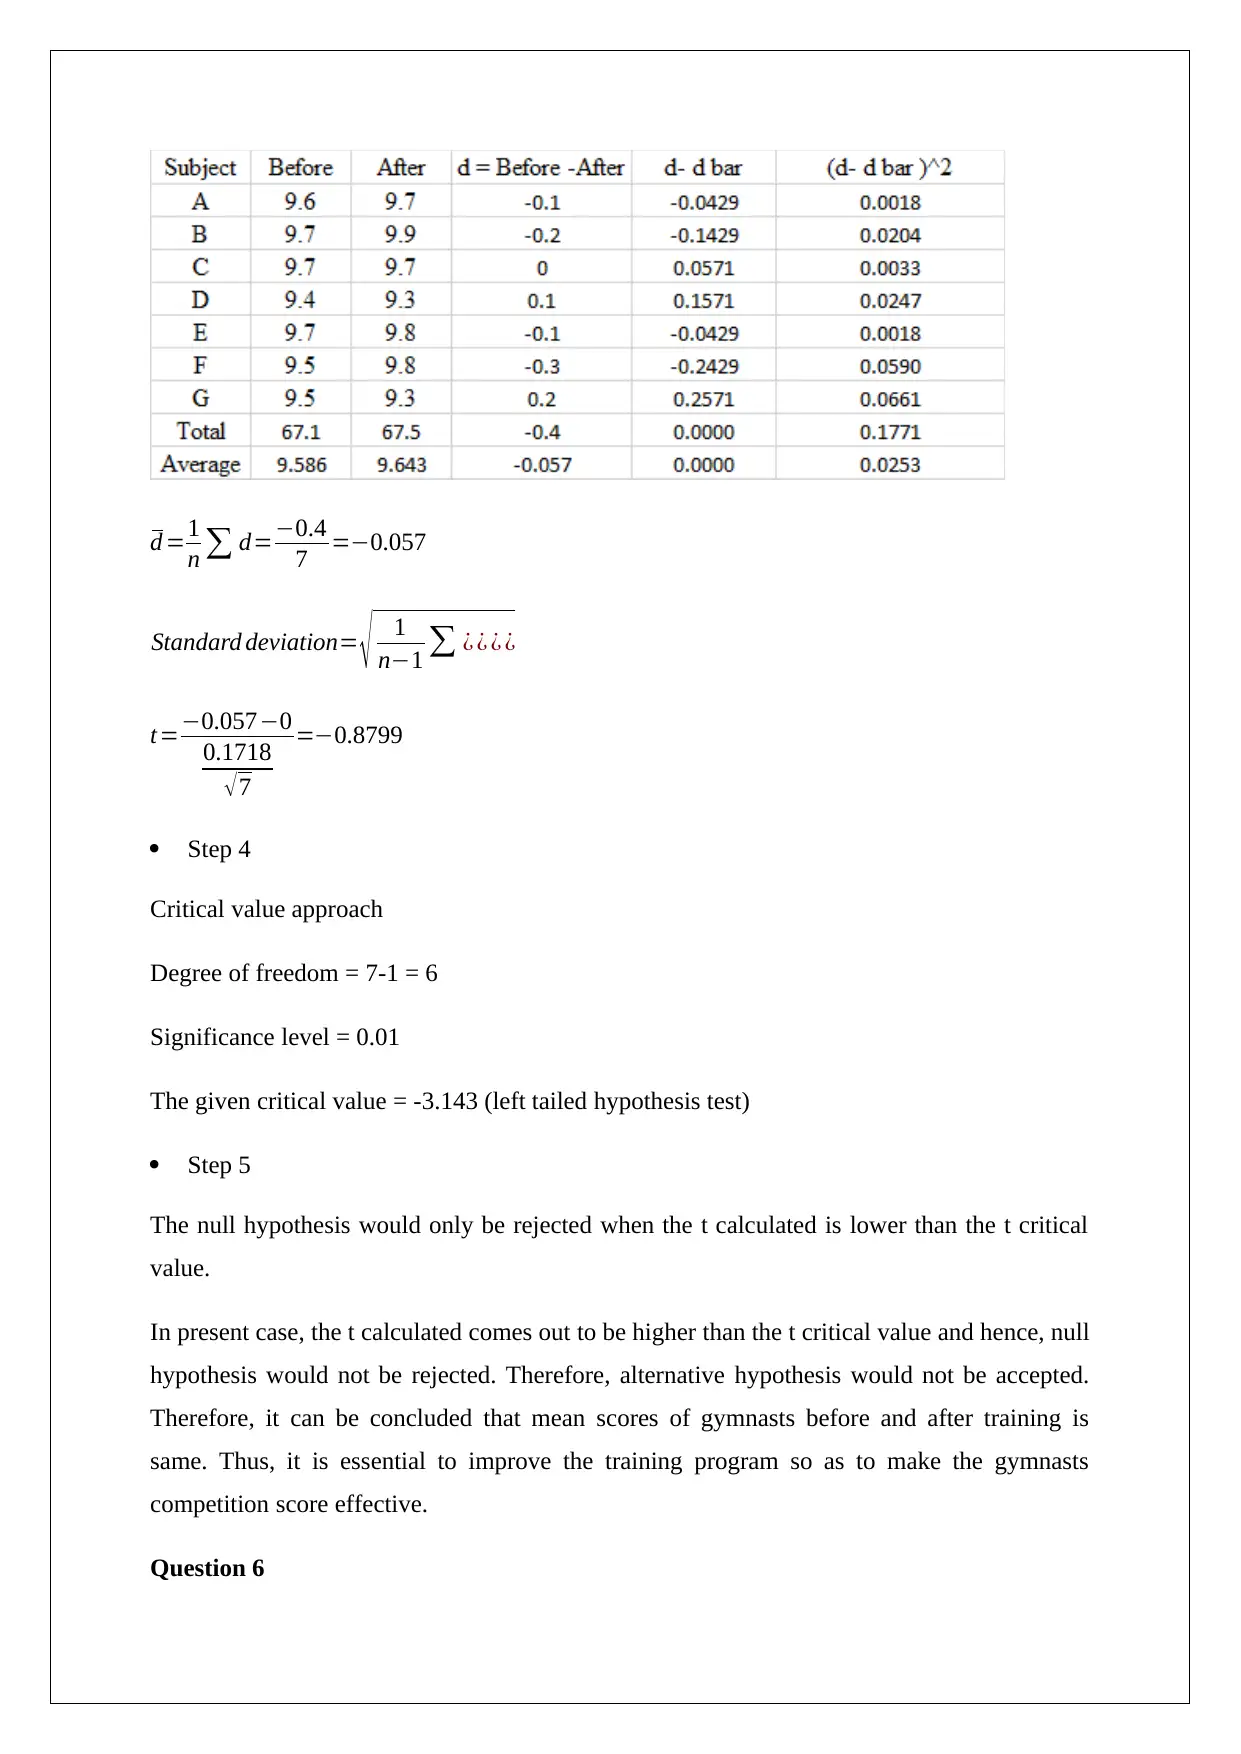
This statistics assignment presents solutions to six hypothesis testing problems. The first problem involves testing a claim about a population mean using a z-test. The second problem uses an F-test to compare the variance of blood pressure between men and women. The third problem tests a claim about a production process using a z-test for proportions. The fourth problem compares the mean response times of two companies using a z-test. The fifth problem uses a t-test to compare the scores of gymnasts before and after training, and the final problem uses a t-test to test a claim about the mean lifetime of car engines. Each solution includes the null and alternative hypotheses, the test statistic, the p-value, and a final conclusion.

1 out of 7
Related Documents
![Statistics Assignment: Hypothesis Testing Solutions - [University]](/_next/image/?url=https%3A%2F%2Fdesklib.com%2Fmedia%2Fimages%2Fbj%2F2a126809566149e6af44fcc81b2e9526.jpg&w=256&q=75)


Your All-in-One AI-Powered Toolkit for Academic Success.
+13062052269
info@desklib.com
Available 24*7 on WhatsApp / Email
![[object Object]](/_next/static/media/star-bottom.7253800d.svg)
Copyright © 2020–2026 A2Z Services. All Rights Reserved. Developed and managed by ZUCOL.