logo

DBS Group Holdings Ltd: Financial Analysis and Economic Condition in Singapore

Write a report to the board of directors of one of the selected companies below as part of the interview process for your first appointment as a Finance Director of a SGX listed company, focusing on your vision and strategic financial goals for the company.

39 Pages6458 Words102 Views
   

Added on  2023-04-25

About This Document

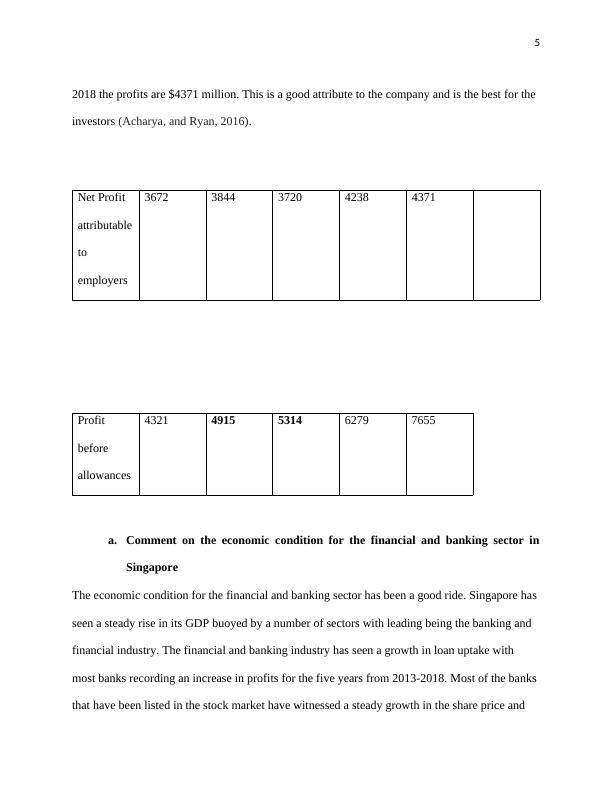
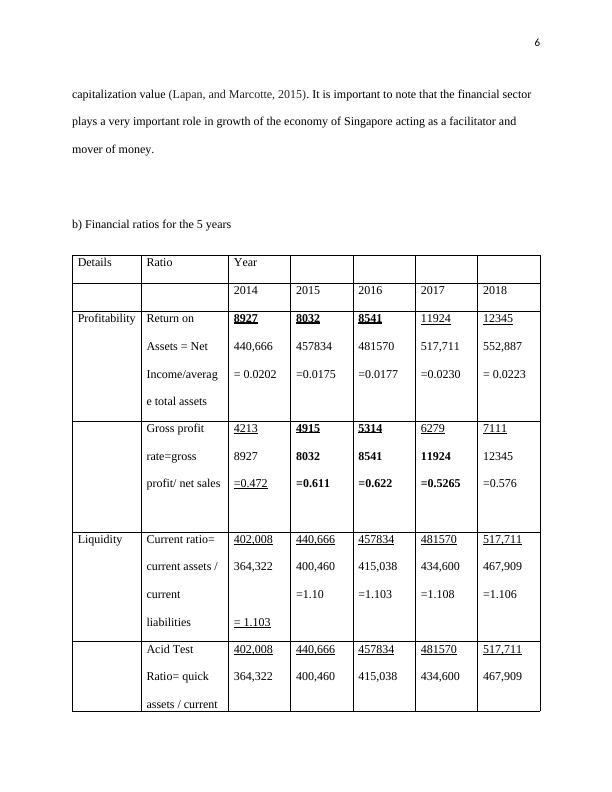
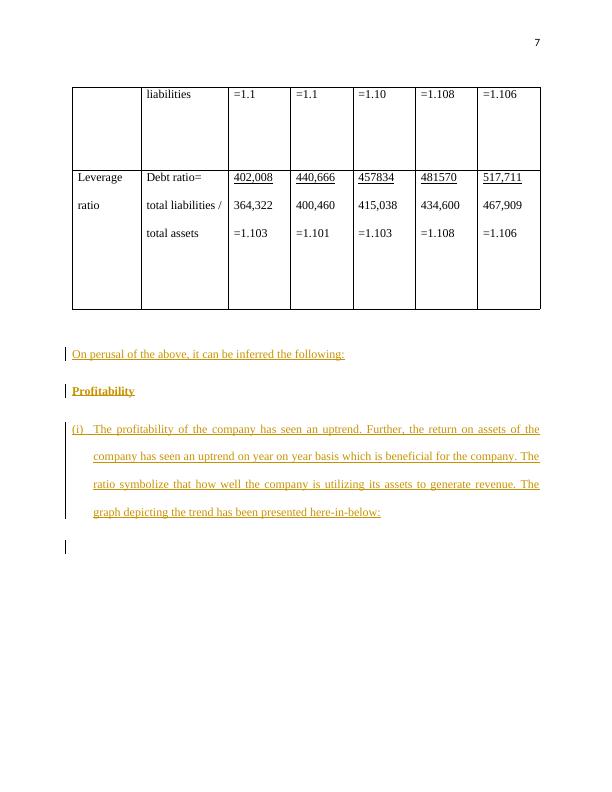
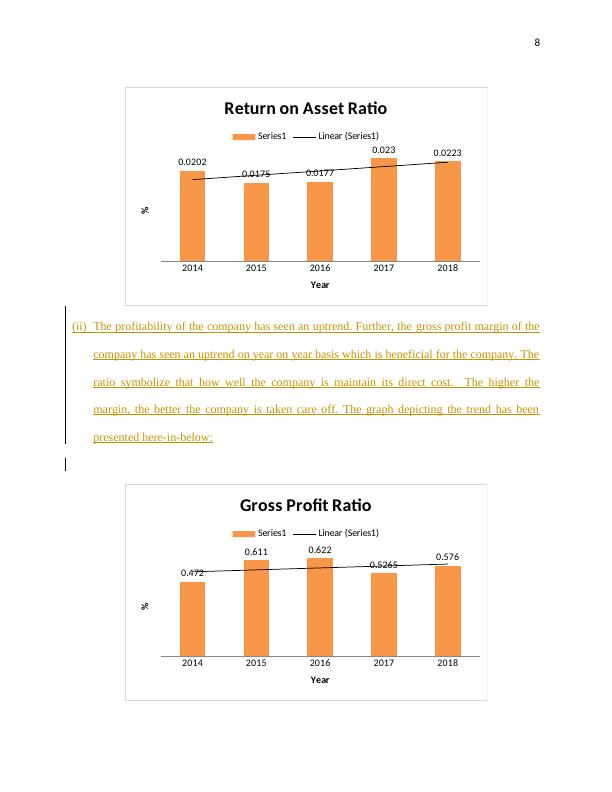
This document provides a financial analysis of DBS Group Holdings Ltd, including horizontal and vertical analysis, profitability ratios, liquidity ratios, leverage ratios, and dividend-related ratios. It also comments on the economic condition of the financial and banking sector in Singapore. The document includes a brief company background and identifies the profits of the company. The document is relevant for finance and banking students and professionals.

DBS Group Holdings Ltd: Financial Analysis and Economic Condition in Singapore

Write a report to the board of directors of one of the selected companies below as part of the interview process for your first appointment as a Finance Director of a SGX listed company, focusing on your vision and strategic financial goals for the company.

   Added on 2023-04-25

ShareRelated Documents
1
Name:
Course
Professor’s name
University name
City, State
Date of submission
DBS Group Holdings Ltd: Financial Analysis and Economic Condition in Singapore_1
2
SECTION A
1. DBS GROUP HOLDINGS LTD
2. Company Background
DBS Bank is a financial services provider and a multi-national bank headquartered in Marina
Bay in Singapore. It was established in 1968 by the government of Singapore as a takeover bid
for the industrial financing of Economic Development Board. It was previously known as
Development Bank of Singapore Limited before the name was changed in 2003. This was
because it was changing its role as a regional bank. It has its activities mostly in South East Asia
with key people being Peter Seah Lim as the chairman of the Board and Piyush Gupta as the
chief Executive Officer (CEO). It is the largest bank in South East Asia by asset base with an
equivalent of $518 billion as at 31 Dec 2017. Its revenue in 2016 was a rise to $ 10.28 billion.
The operating income in 2016 was $ 6.517 billion and this was a marginal increase of $470
million from the year 2015. The net income dropped in 2016 to $ 3.07 billion. The number of
employees by 2017 was at 24,174 which is among the biggest taskforce in financial and banking
service providers in south East Asia. Some of the major competitors are Bank of Singapore,
United overseas bank and OCBC Bank (Bonsall et al, 2017).
3. Horizontal and Vertical analysis of DBS bank
Horizontal analysis – Profit and Loss for 2014-2018
Horizontal analysis for profit and loss for 5 years beginning in 2014 to 2018.
DBS Group Holdings Ltd: Financial Analysis and Economic Condition in Singapore_2
3
Details 2014 2015 2016 2017 2018 %
In
millions$
Ni millions
$
$ $ $
Income
Interest income 6720 7080 7568 8986 9811 7%
Interest expense 1616 1691 2007 2791 2725 11%
Net interest income 3425 5389 5561 9827 9827 13%
Non-interest income 2410 2643 2980 3899 4039 6%
Total income 8927 8032 8541 11924 1321
1
5%
Total expenses 3007 3117 3227 3669 3741 8%
Profit before allowances 4213 4915 5314 6279 7111 9%
Profit before taxes 4418 4480 4335 6569 7231 7%
Net Profit attributable to
employers
3672 3844 3720 4238 4371 11%
Balance sheet for DBS Group Holdings
Selected balance sheet items 2017 2016 2015 2014 2013
Total assets 517,711 481570 457834 440,666 402,008
Customer loans 323,099 301,51
6
283,289 275,588 248,654
DBS Group Holdings Ltd: Financial Analysis and Economic Condition in Singapore_3
4
Total liabilities 467,909 434,60
0
415,038 400,460 364,322
Equity 34.50B 33.72B 31.45B 29.07B 28.95B
As per the horizontal and vertical analysis, the total assets from 2013 to 2017 has been on an
upward trajectory.
The total liabilities also are on the rise since 2013.
Net profit has been fluctuating in different years, however, it has remained on a steady rise since
2013.
Revenue has also been increasing for the bank (Abbott, et al, 2016).
4. Identify the profits
The profits for the company keeps on fluctuating as the years continue. The profits before
allowances in 2014 was 4915, while in 2016 it was 5314 and 2017 was 6279 million. This shows
an increase in the profitability levels of the company. The profits before allowances are on a
steady rise( Drever et al,2015). Net profits attributable to the employers are in 2014, $3672
million, in 2015 it is $ 3844 million, in 2016 it is $3720 million, in 2017 it is 4238 million and in
DBS Group Holdings Ltd: Financial Analysis and Economic Condition in Singapore_4
5
2018 the profits are $4371 million. This is a good attribute to the company and is the best for the
investors (Acharya, and Ryan, 2016).
Net Profit
attributable
to
employers
3672 3844 3720 4238 4371
Profit
before
allowances
4321 4915 5314 6279 7655
a. Comment on the economic condition for the financial and banking sector in
Singapore
The economic condition for the financial and banking sector has been a good ride. Singapore has
seen a steady rise in its GDP buoyed by a number of sectors with leading being the banking and
financial industry. The financial and banking industry has seen a growth in loan uptake with
most banks recording an increase in profits for the five years from 2013-2018. Most of the banks
that have been listed in the stock market have witnessed a steady growth in the share price and
DBS Group Holdings Ltd: Financial Analysis and Economic Condition in Singapore_5
6
capitalization value (Lapan, and Marcotte, 2015). It is important to note that the financial sector
plays a very important role in growth of the economy of Singapore acting as a facilitator and
mover of money.
b) Financial ratios for the 5 years
Details Ratio Year
2014 2015 2016 2017 2018
Profitability Return on
Assets = Net
Income/averag
e total assets
8927
440,666
= 0.0202
8032
457834
=0.0175
8541
481570
=0.0177
11924
517,711
=0.0230
12345
552,887
= 0.0223
Gross profit
rate=gross
profit/ net sales
4213
8927
=0.472
4915
8032
=0.611
5314
8541
=0.622
6279
11924
=0.5265
7111
12345
=0.576
Liquidity Current ratio=
current assets /
current
liabilities
402,008
364,322
= 1.103
440,666
400,460
=1.10
457834
415,038
=1.103
481570
434,600
=1.108
517,711
467,909
=1.106
Acid Test
Ratio= quick
assets / current
402,008
364,322
440,666
400,460
457834
415,038
481570
434,600
517,711
467,909
DBS Group Holdings Ltd: Financial Analysis and Economic Condition in Singapore_6
7
liabilities =1.1 =1.1 =1.10 =1.108 =1.106
Leverage
ratio
Debt ratio=
total liabilities /
total assets
402,008
364,322
=1.103
440,666
400,460
=1.101
457834
415,038
=1.103
481570
434,600
=1.108
517,711
467,909
=1.106
On perusal of the above, it can be inferred the following:
Profitability
(i) The profitability of the company has seen an uptrend. Further, the return on assets of the
company has seen an uptrend on year on year basis which is beneficial for the company. The
ratio symbolize that how well the company is utilizing its assets to generate revenue. The
graph depicting the trend has been presented here-in-below:
DBS Group Holdings Ltd: Financial Analysis and Economic Condition in Singapore_7
8
(ii) The profitability of the company has seen an uptrend. Further, the gross profit margin of the
company has seen an uptrend on year on year basis which is beneficial for the company. The
ratio symbolize that how well the company is maintain its direct cost. The higher the
margin, the better the company is taken care off. The graph depicting the trend has been
presented here-in-below:
2014 2015 2016 2017 2018
0.0202
0.0175 0.0177
0.023 0.0223
Return on Asset Ratio
Series1 Linear (Series1)
Year
%
2014 2015 2016 2017 2018
0.472
0.611 0.622
0.5265 0.576
Gross Profit Ratio
Series1 Linear (Series1)
Year
%
DBS Group Holdings Ltd: Financial Analysis and Economic Condition in Singapore_8

End of preview

Want to access all the pages? Upload your documents or become a member.

Related Documents
Finance and Planning - Assignment
|9
|954
|53

Comparison of DBS Bank and OCBC Bank in the Banking and Finance Industry
|9
|2957
|35

Financial Management of United Overseas Bank Ltd
|22
|4734
|89

Development Bank of Singapore
|20
|4860
|241

Comparative Study of UOB and OCBC for Bank Management and Financial Services
|11
|2584
|75

Financial Decision Making Report
|22
|4160
|37