Debit Securities Analysis, Ratio & Altman Z Score: Qube Holdings
VerifiedAdded on 2023/06/18
|11
|2915
|493
Report
AI Summary
This report provides a comprehensive analysis of Qube Holdings' debit securities, beginning with an industry structure analysis using Porter's Five Forces, which indicates a strong position for the company. The fundamental analysis employs a 'top-down methodology' to assess economic conditions and industry trends. Key financial ratios, including EBITDA margin, return on capital employed, and EBIT interest coverage, are calculated and analyzed, revealing a recent decline in profitability. The Altman Z-score is used to evaluate the company's risk of bankruptcy. The report also includes a forecast of future ratios using a three-year average. The analysis sheds light on Qube Holding's financial health, debt management, and overall operational efficiency, offering valuable insights into its performance and future prospects.

Debit Securities
Paraphrase This Document
Need a fresh take? Get an instant paraphrase of this document with our AI Paraphraser
TABLE OF CONTENTS
INTRODUCTION...........................................................................................................................3
MAIN BODY...................................................................................................................................3
Industry structure analysis..........................................................................................................3
Industry fundamental analysis....................................................................................................4
Ratio analysis..............................................................................................................................4
Altman Z score............................................................................................................................8
CONCLUSION..............................................................................................................................10
REFERENCES..............................................................................................................................11
INTRODUCTION
The debit securities are defined as the type of financial asset which entitle the owner with
the interest payment. This can be simply stated as the type of asset which is being created at time
when one of the party lend money to another. The present study is based on company Qube
Holdings which was founded in the year 2006 by Chris Corrigan. The company is the Australia’s
largest import and export logistics provider. The current report will outline the industry structure
analysis along with fundamental analysis. Further the ratios will be calculated along with
forecasting of ratios for next year. In the end, Altman Z score will be calculated in order to
analyse the security.
MAIN BODY
Industry structure analysis
Analysis of industry structure is very important as it outlines the characteristic of the
industry and working patterns of overall industry. For the company to work in better and
effective manner it is necessary that they evaluate all the working patterns and follow the similar
kind of activities in their own operations as well (Marques, de Sousa Ribeiro and Barboza,
2018). for the industry structure analysis use of Porter five forces will be undertaken which as
follows-
Threat of substitute- the threat of substitute for Qube Holding is low as there are only
limited ways through which import and export of goods can be done. Hence, this is good
for company and as a result of this operations of business will be good.
Threat of new entrant- the threat of new people entering within the import and export
logistic industry is high. thus, this is beneficial for Qube Holding as the people will come
less in industry due to high investment so company can be more profitable.
Bargaining power of supplier- the supplier within the logistic industry are many and as a
result of this, Qube Holding has many option to choose from. Thus, this not affects the
profitability of company. the reason underlying this fact is that when the suppliers are
more and if their rates are high the company can go with other supplier.
Bargaining power of buyer- the buyer are the king for the company and business has to
make all its services in direction of betterment of consumers (Cantrell, 2019). Hence, for
⊘ This is a preview!⊘
Do you want full access?
Subscribe today to unlock all pages.
Trusted by 1+ million students worldwide
Qube Holding the bargaining power of consumer is high and this affects the working to a
great extent.
Competitive rivalry- the competition within the industry is very high and because of this
Qube Holding need to work in more effective manner (Manaseer and Al-Oshaibat, 2018).
This is essential for the reason that when competition is high then company need to have
some distinct capabilities so that consumer gets attracted towards the company.
Hence, with the help of Porter five forces it is clear that the company is having good position
within the industry and the performance of company is good.
Industry fundamental analysis
Fundamental analysis is being defined as the examination of the forces which can affect
the well- being of industry, economy and the company as well. for the effective management of
the company it is clear that they properly analyse the working of the industry and its patterns.
The reason underlying this fact is that when the company will be having proper knowledge of
industry then this will result in proper working of the company. This is necessary as it will
acknowledge Qube Holding relating to working trends and as a result of this effective working
will be managed in proper and good manner (Tin and Hii, 2020). Hence, for the proper working
of Qube Holding it is necessary that there is proper track of industry and for this they undertake
the use of ‘top down methodology’. This is a technique wherein the company first analyses the
economic condition and there after studies the trend in the industry. Further after that company
analyses its working in accordance with the industry and make their own strategies. Hence, this
will assist the company in evaluating the working in according to industry practices and then
make strategies for working effectively.
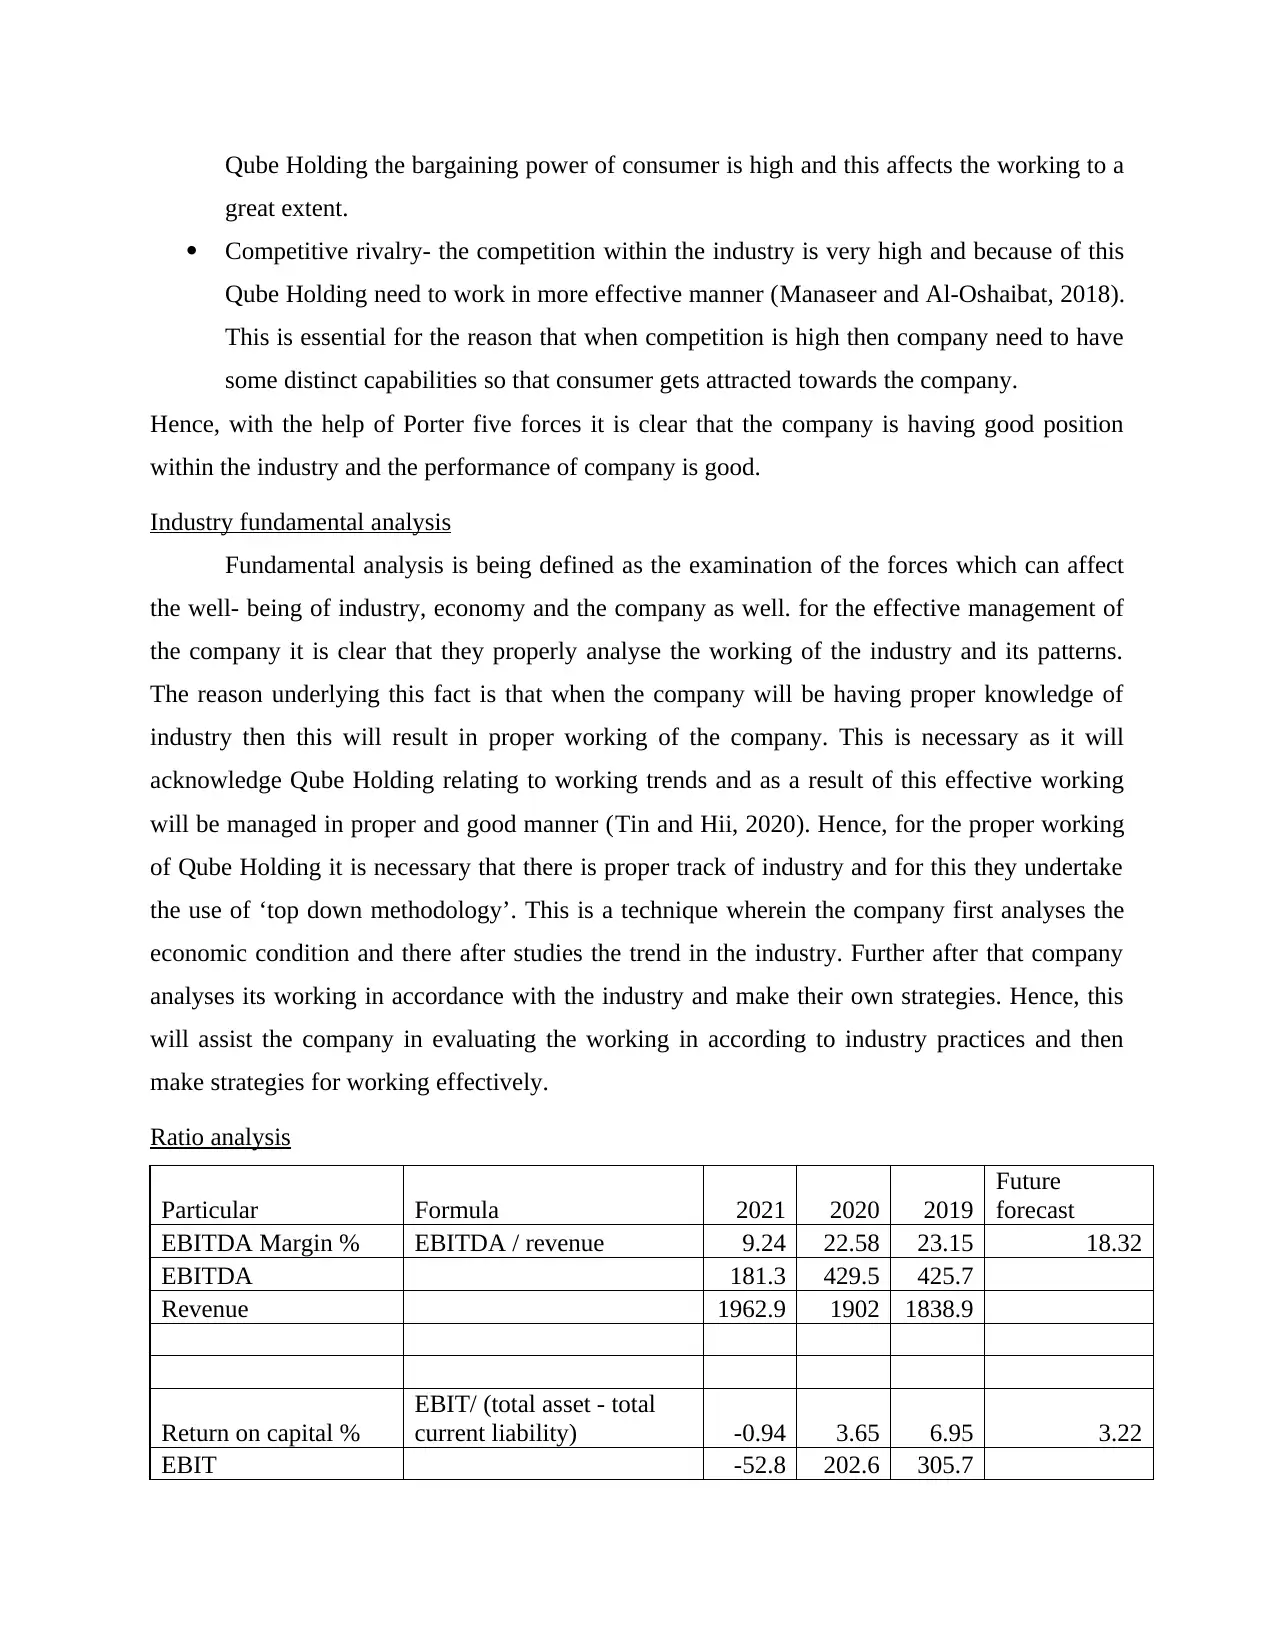
Ratio analysis
Particular Formula 2021 2020 2019
Future
forecast
EBITDA Margin % EBITDA / revenue 9.24 22.58 23.15 18.32
EBITDA 181.3 429.5 425.7
Revenue 1962.9 1902 1838.9
Return on capital %
EBIT/ (total asset - total
current liability) -0.94 3.65 6.95 3.22
EBIT -52.8 202.6 305.7
great extent.
Competitive rivalry- the competition within the industry is very high and because of this
Qube Holding need to work in more effective manner (Manaseer and Al-Oshaibat, 2018).
This is essential for the reason that when competition is high then company need to have
some distinct capabilities so that consumer gets attracted towards the company.
Hence, with the help of Porter five forces it is clear that the company is having good position
within the industry and the performance of company is good.
Industry fundamental analysis
Fundamental analysis is being defined as the examination of the forces which can affect
the well- being of industry, economy and the company as well. for the effective management of
the company it is clear that they properly analyse the working of the industry and its patterns.
The reason underlying this fact is that when the company will be having proper knowledge of
industry then this will result in proper working of the company. This is necessary as it will
acknowledge Qube Holding relating to working trends and as a result of this effective working
will be managed in proper and good manner (Tin and Hii, 2020). Hence, for the proper working
of Qube Holding it is necessary that there is proper track of industry and for this they undertake
the use of ‘top down methodology’. This is a technique wherein the company first analyses the
economic condition and there after studies the trend in the industry. Further after that company
analyses its working in accordance with the industry and make their own strategies. Hence, this
will assist the company in evaluating the working in according to industry practices and then
make strategies for working effectively.
Ratio analysis
Particular Formula 2021 2020 2019
Future
forecast
EBITDA Margin % EBITDA / revenue 9.24 22.58 23.15 18.32
EBITDA 181.3 429.5 425.7
Revenue 1962.9 1902 1838.9
Return on capital %
EBIT/ (total asset - total
current liability) -0.94 3.65 6.95 3.22
EBIT -52.8 202.6 305.7
Paraphrase This Document
Need a fresh take? Get an instant paraphrase of this document with our AI Paraphraser
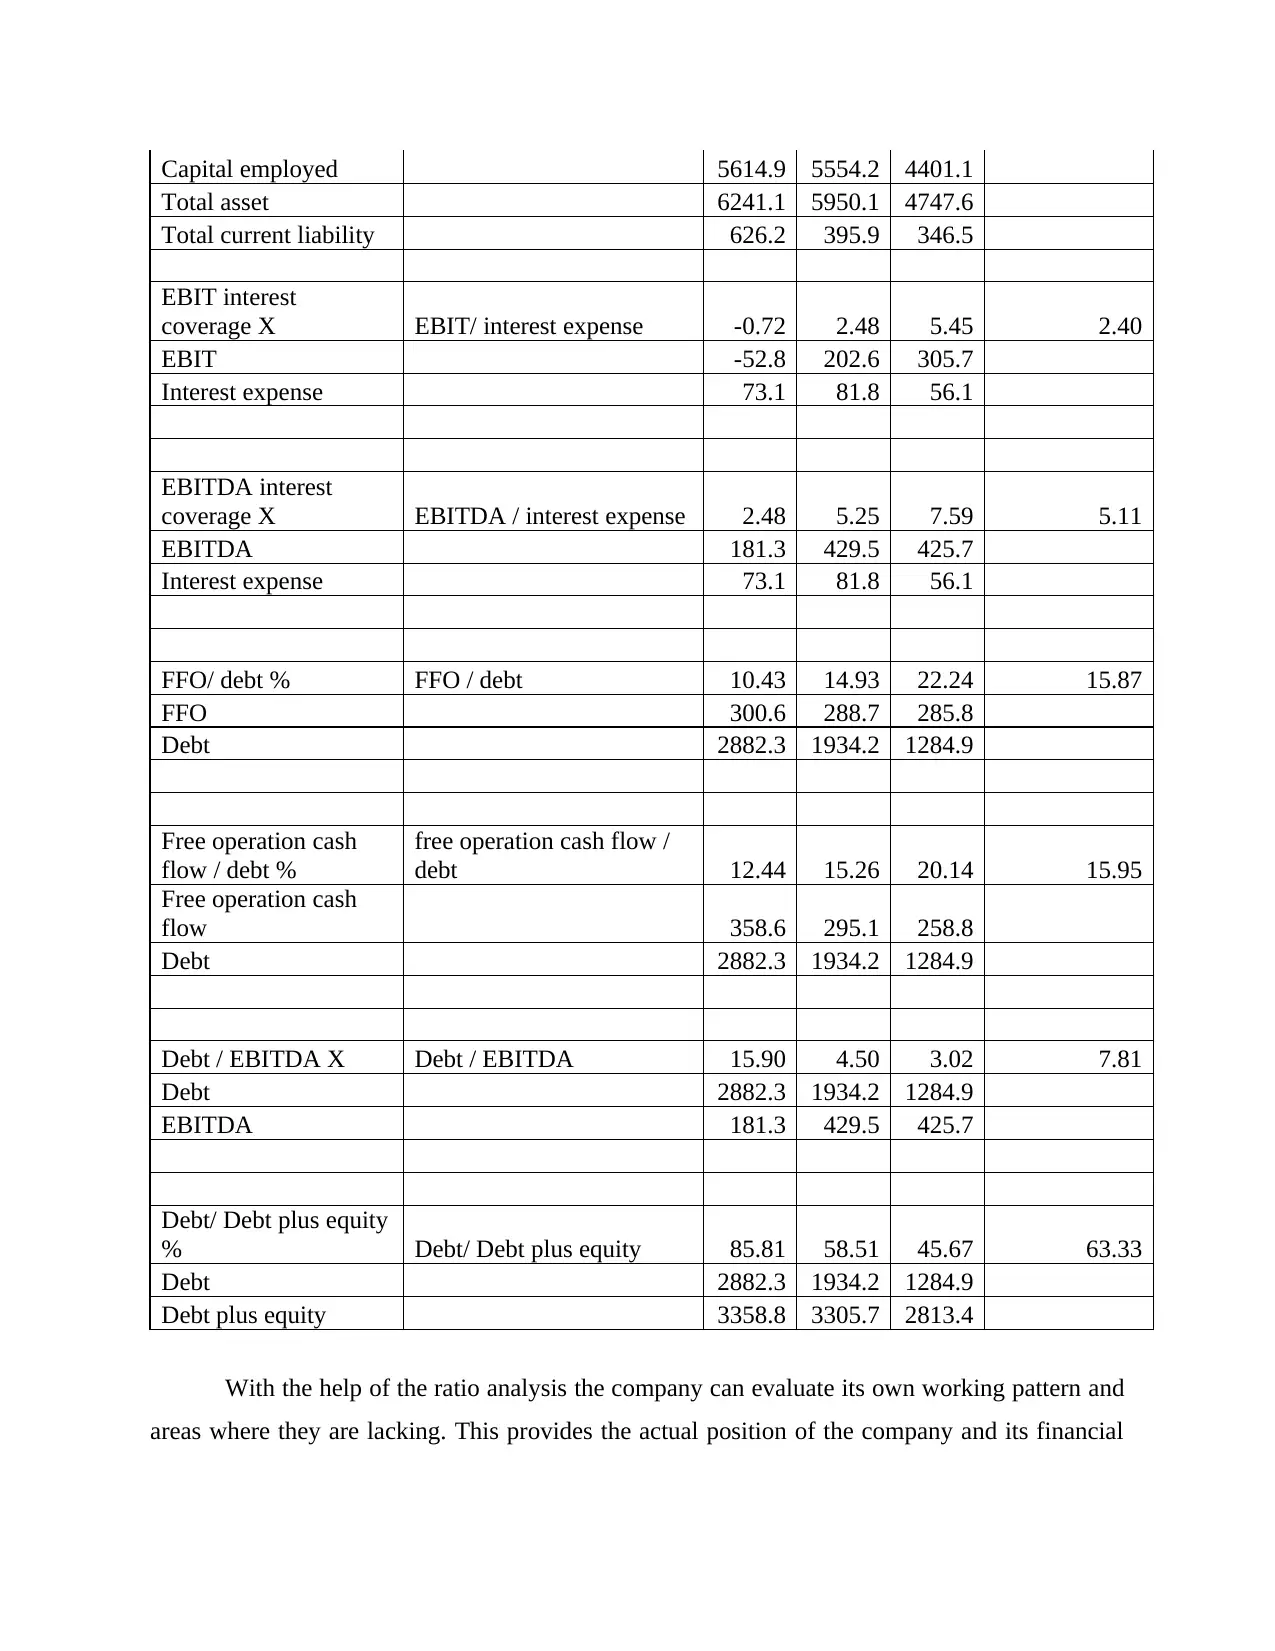
Capital employed 5614.9 5554.2 4401.1
Total asset 6241.1 5950.1 4747.6
Total current liability 626.2 395.9 346.5
EBIT interest
coverage X EBIT/ interest expense -0.72 2.48 5.45 2.40
EBIT -52.8 202.6 305.7
Interest expense 73.1 81.8 56.1
EBITDA interest
coverage X EBITDA / interest expense 2.48 5.25 7.59 5.11
EBITDA 181.3 429.5 425.7
Interest expense 73.1 81.8 56.1
FFO/ debt % FFO / debt 10.43 14.93 22.24 15.87
FFO 300.6 288.7 285.8
Debt 2882.3 1934.2 1284.9
Free operation cash
flow / debt %
free operation cash flow /
debt 12.44 15.26 20.14 15.95
Free operation cash
flow 358.6 295.1 258.8
Debt 2882.3 1934.2 1284.9
Debt / EBITDA X Debt / EBITDA 15.90 4.50 3.02 7.81
Debt 2882.3 1934.2 1284.9
EBITDA 181.3 429.5 425.7
Debt/ Debt plus equity
% Debt/ Debt plus equity 85.81 58.51 45.67 63.33
Debt 2882.3 1934.2 1284.9
Debt plus equity 3358.8 3305.7 2813.4
With the help of the ratio analysis the company can evaluate its own working pattern and
areas where they are lacking. This provides the actual position of the company and its financial
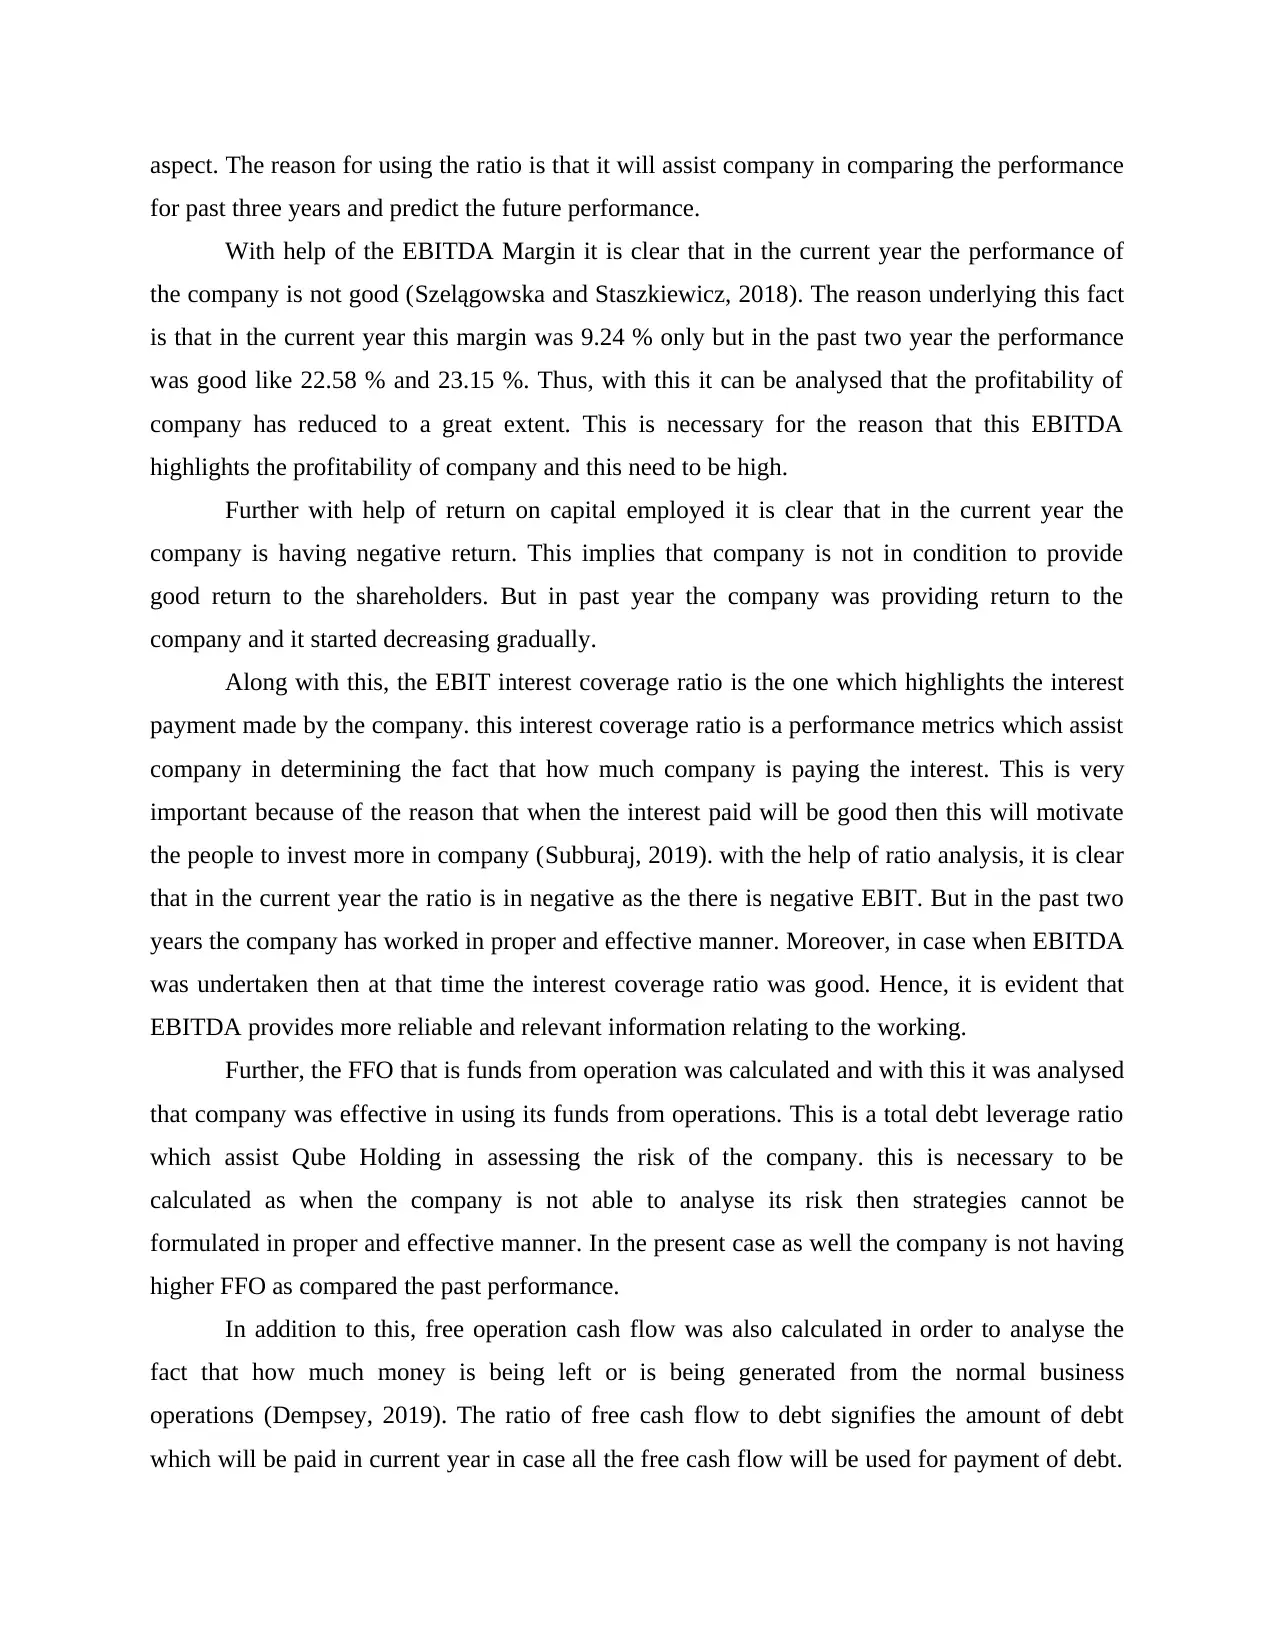
aspect. The reason for using the ratio is that it will assist company in comparing the performance
for past three years and predict the future performance.
With help of the EBITDA Margin it is clear that in the current year the performance of
the company is not good (Szelągowska and Staszkiewicz, 2018). The reason underlying this fact
is that in the current year this margin was 9.24 % only but in the past two year the performance
was good like 22.58 % and 23.15 %. Thus, with this it can be analysed that the profitability of
company has reduced to a great extent. This is necessary for the reason that this EBITDA
highlights the profitability of company and this need to be high.
Further with help of return on capital employed it is clear that in the current year the
company is having negative return. This implies that company is not in condition to provide
good return to the shareholders. But in past year the company was providing return to the
company and it started decreasing gradually.
Along with this, the EBIT interest coverage ratio is the one which highlights the interest
payment made by the company. this interest coverage ratio is a performance metrics which assist
company in determining the fact that how much company is paying the interest. This is very
important because of the reason that when the interest paid will be good then this will motivate
the people to invest more in company (Subburaj, 2019). with the help of ratio analysis, it is clear
that in the current year the ratio is in negative as the there is negative EBIT. But in the past two
years the company has worked in proper and effective manner. Moreover, in case when EBITDA
was undertaken then at that time the interest coverage ratio was good. Hence, it is evident that
EBITDA provides more reliable and relevant information relating to the working.
Further, the FFO that is funds from operation was calculated and with this it was analysed
that company was effective in using its funds from operations. This is a total debt leverage ratio
which assist Qube Holding in assessing the risk of the company. this is necessary to be
calculated as when the company is not able to analyse its risk then strategies cannot be
formulated in proper and effective manner. In the present case as well the company is not having
higher FFO as compared the past performance.
In addition to this, free operation cash flow was also calculated in order to analyse the
fact that how much money is being left or is being generated from the normal business
operations (Dempsey, 2019). The ratio of free cash flow to debt signifies the amount of debt
which will be paid in current year in case all the free cash flow will be used for payment of debt.
⊘ This is a preview!⊘
Do you want full access?
Subscribe today to unlock all pages.
Trusted by 1+ million students worldwide
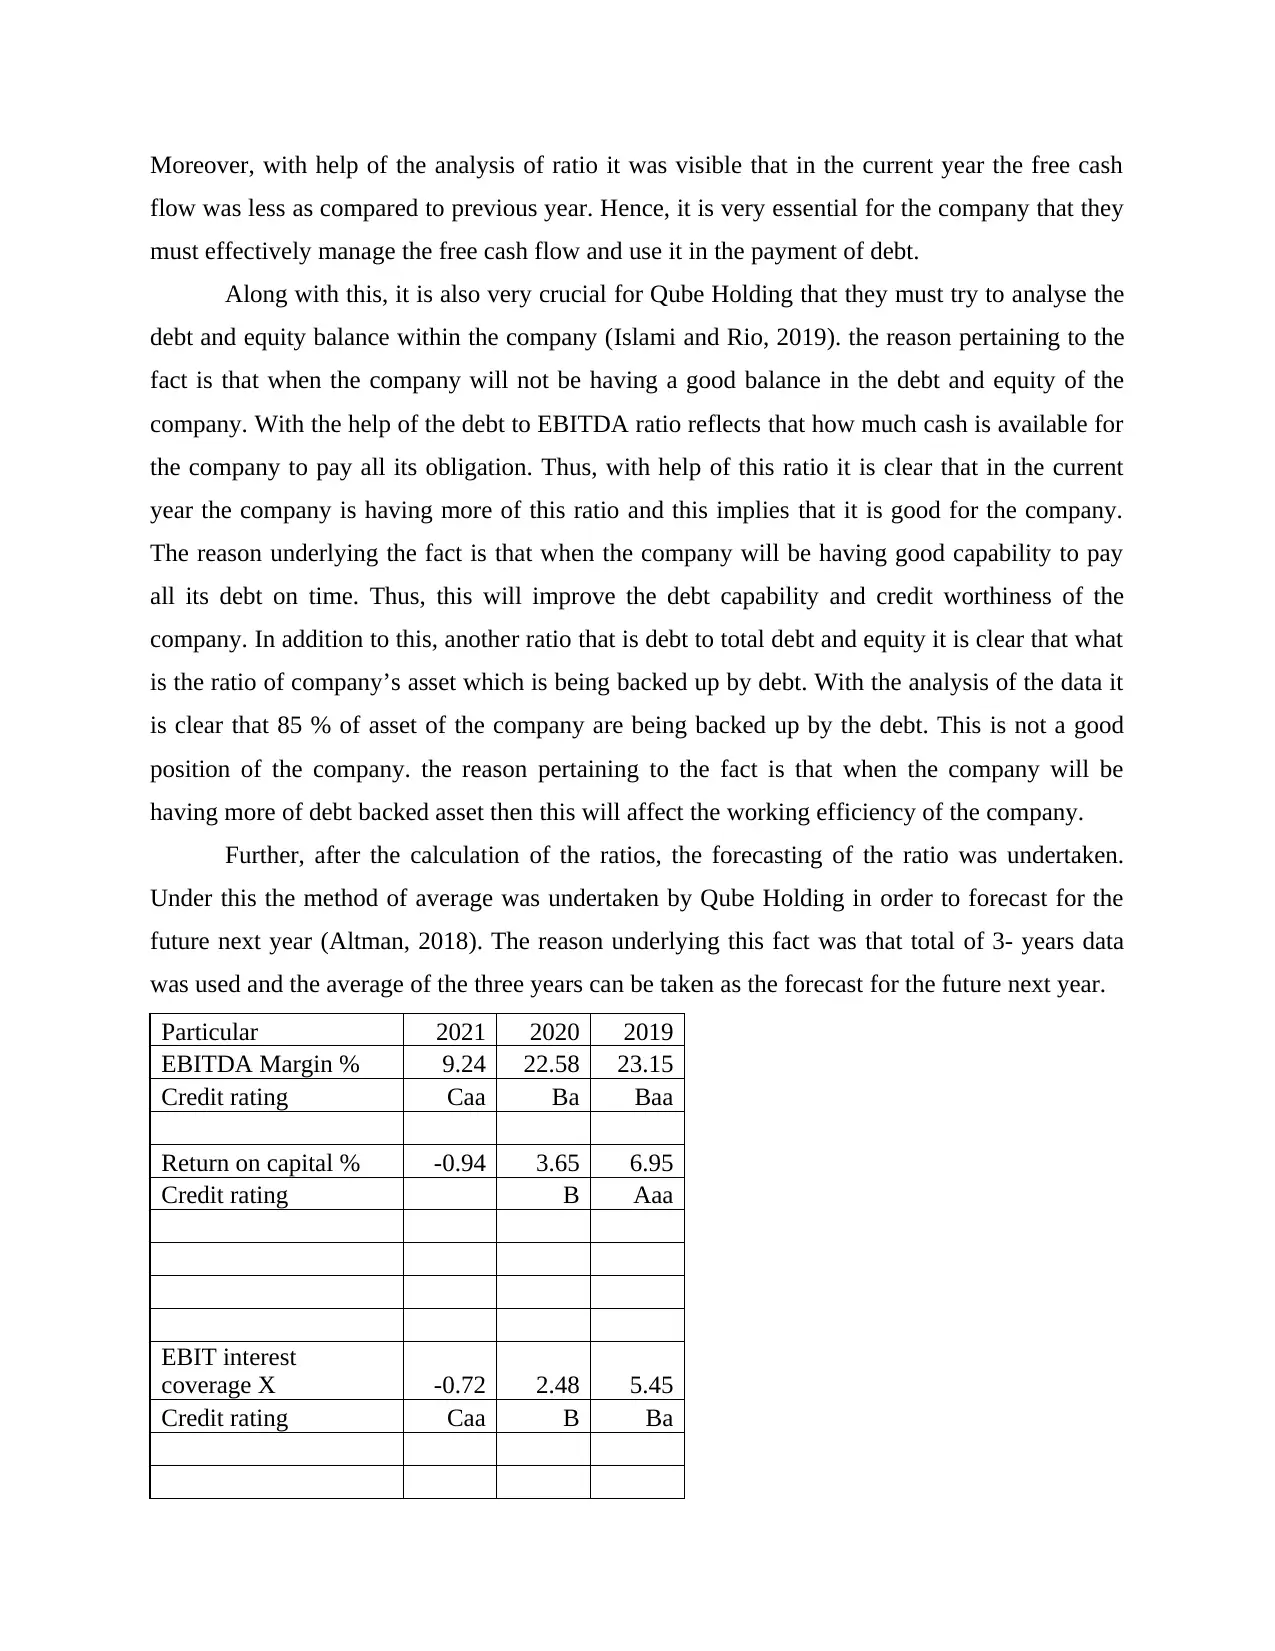
Moreover, with help of the analysis of ratio it was visible that in the current year the free cash
flow was less as compared to previous year. Hence, it is very essential for the company that they
must effectively manage the free cash flow and use it in the payment of debt.
Along with this, it is also very crucial for Qube Holding that they must try to analyse the
debt and equity balance within the company (Islami and Rio, 2019). the reason pertaining to the
fact is that when the company will not be having a good balance in the debt and equity of the
company. With the help of the debt to EBITDA ratio reflects that how much cash is available for
the company to pay all its obligation. Thus, with help of this ratio it is clear that in the current
year the company is having more of this ratio and this implies that it is good for the company.
The reason underlying the fact is that when the company will be having good capability to pay
all its debt on time. Thus, this will improve the debt capability and credit worthiness of the
company. In addition to this, another ratio that is debt to total debt and equity it is clear that what
is the ratio of company’s asset which is being backed up by debt. With the analysis of the data it
is clear that 85 % of asset of the company are being backed up by the debt. This is not a good
position of the company. the reason pertaining to the fact is that when the company will be
having more of debt backed asset then this will affect the working efficiency of the company.
Further, after the calculation of the ratios, the forecasting of the ratio was undertaken.
Under this the method of average was undertaken by Qube Holding in order to forecast for the
future next year (Altman, 2018). The reason underlying this fact was that total of 3- years data
was used and the average of the three years can be taken as the forecast for the future next year.
Particular 2021 2020 2019
EBITDA Margin % 9.24 22.58 23.15
Credit rating Caa Ba Baa
Return on capital % -0.94 3.65 6.95
Credit rating B Aaa
EBIT interest
coverage X -0.72 2.48 5.45
Credit rating Caa B Ba
Paraphrase This Document
Need a fresh take? Get an instant paraphrase of this document with our AI Paraphraser
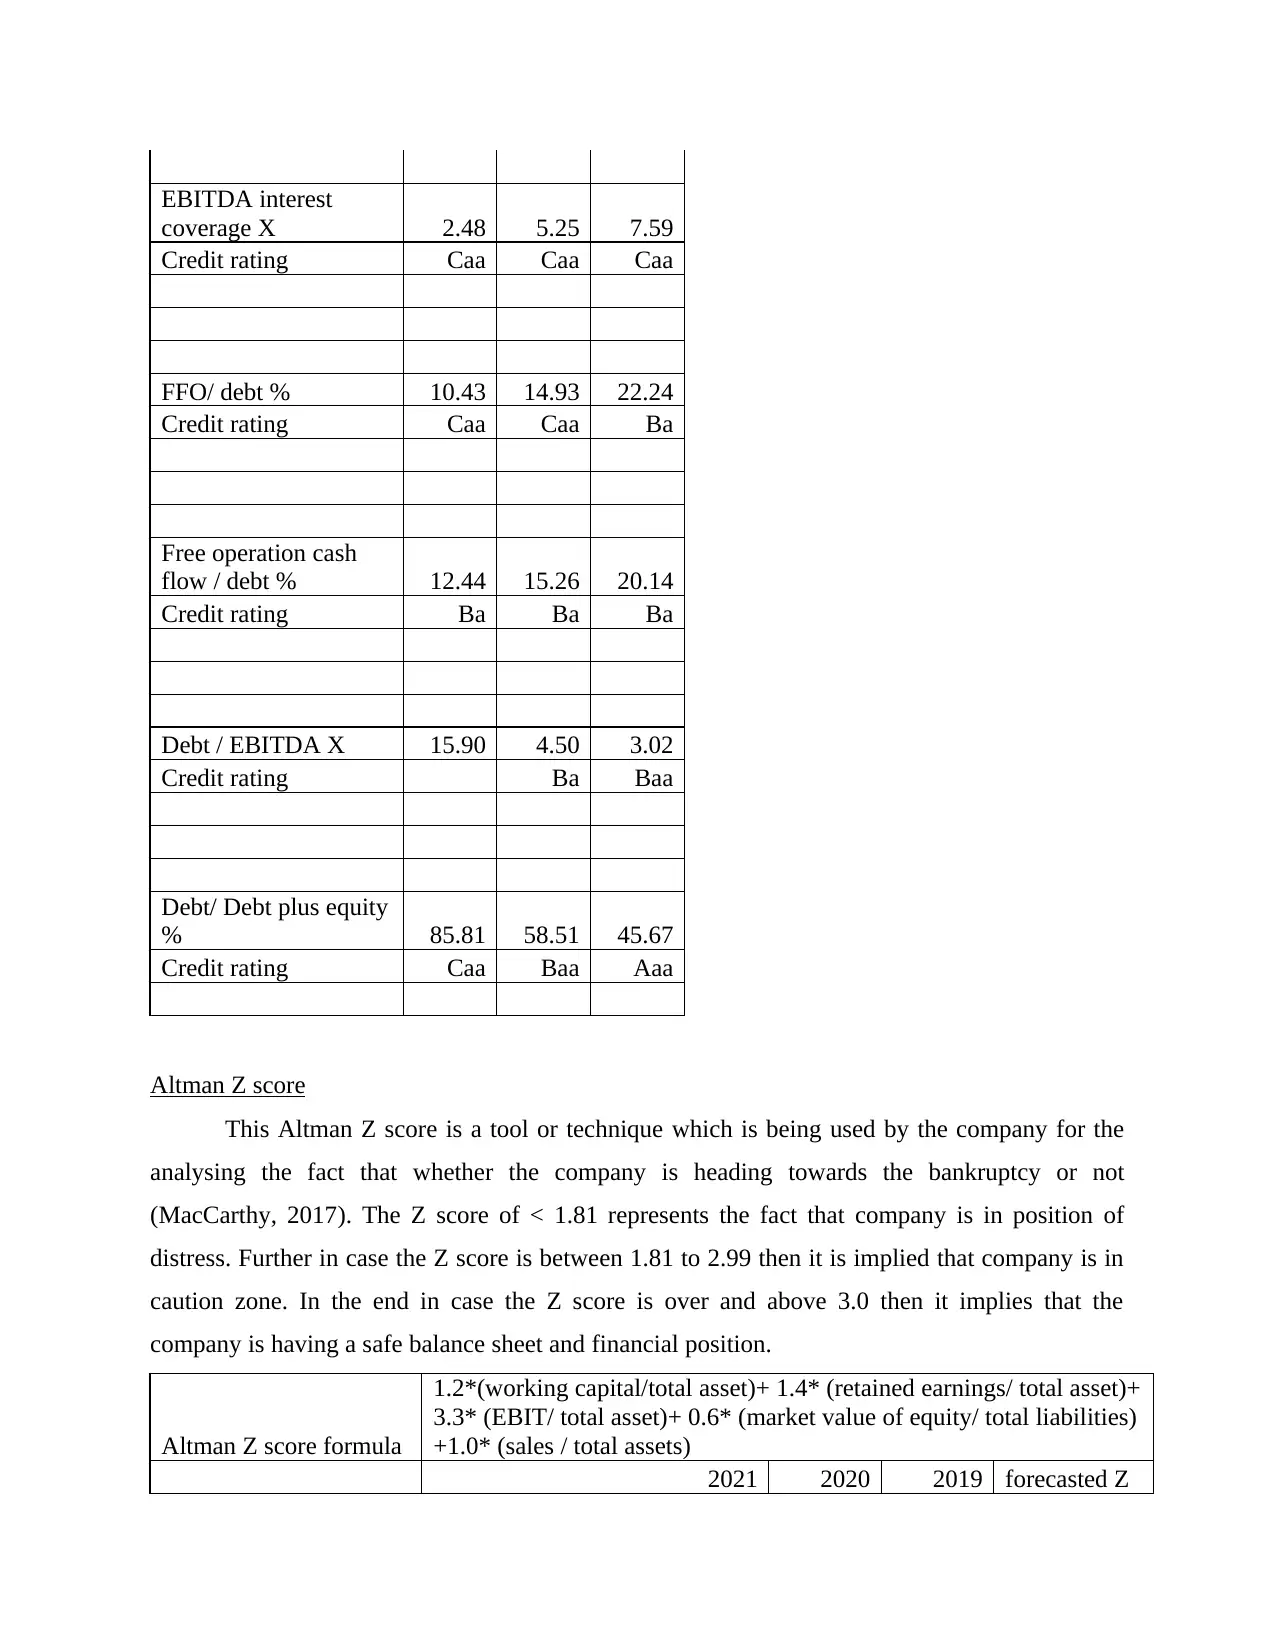
EBITDA interest
coverage X 2.48 5.25 7.59
Credit rating Caa Caa Caa
FFO/ debt % 10.43 14.93 22.24
Credit rating Caa Caa Ba
Free operation cash
flow / debt % 12.44 15.26 20.14
Credit rating Ba Ba Ba
Debt / EBITDA X 15.90 4.50 3.02
Credit rating Ba Baa
Debt/ Debt plus equity
% 85.81 58.51 45.67
Credit rating Caa Baa Aaa
Altman Z score
This Altman Z score is a tool or technique which is being used by the company for the
analysing the fact that whether the company is heading towards the bankruptcy or not
(MacCarthy, 2017). The Z score of < 1.81 represents the fact that company is in position of
distress. Further in case the Z score is between 1.81 to 2.99 then it is implied that company is in
caution zone. In the end in case the Z score is over and above 3.0 then it implies that the
company is having a safe balance sheet and financial position.
Altman Z score formula
1.2*(working capital/total asset)+ 1.4* (retained earnings/ total asset)+
3.3* (EBIT/ total asset)+ 0.6* (market value of equity/ total liabilities)
+1.0* (sales / total assets)
2021 2020 2019 forecasted Z
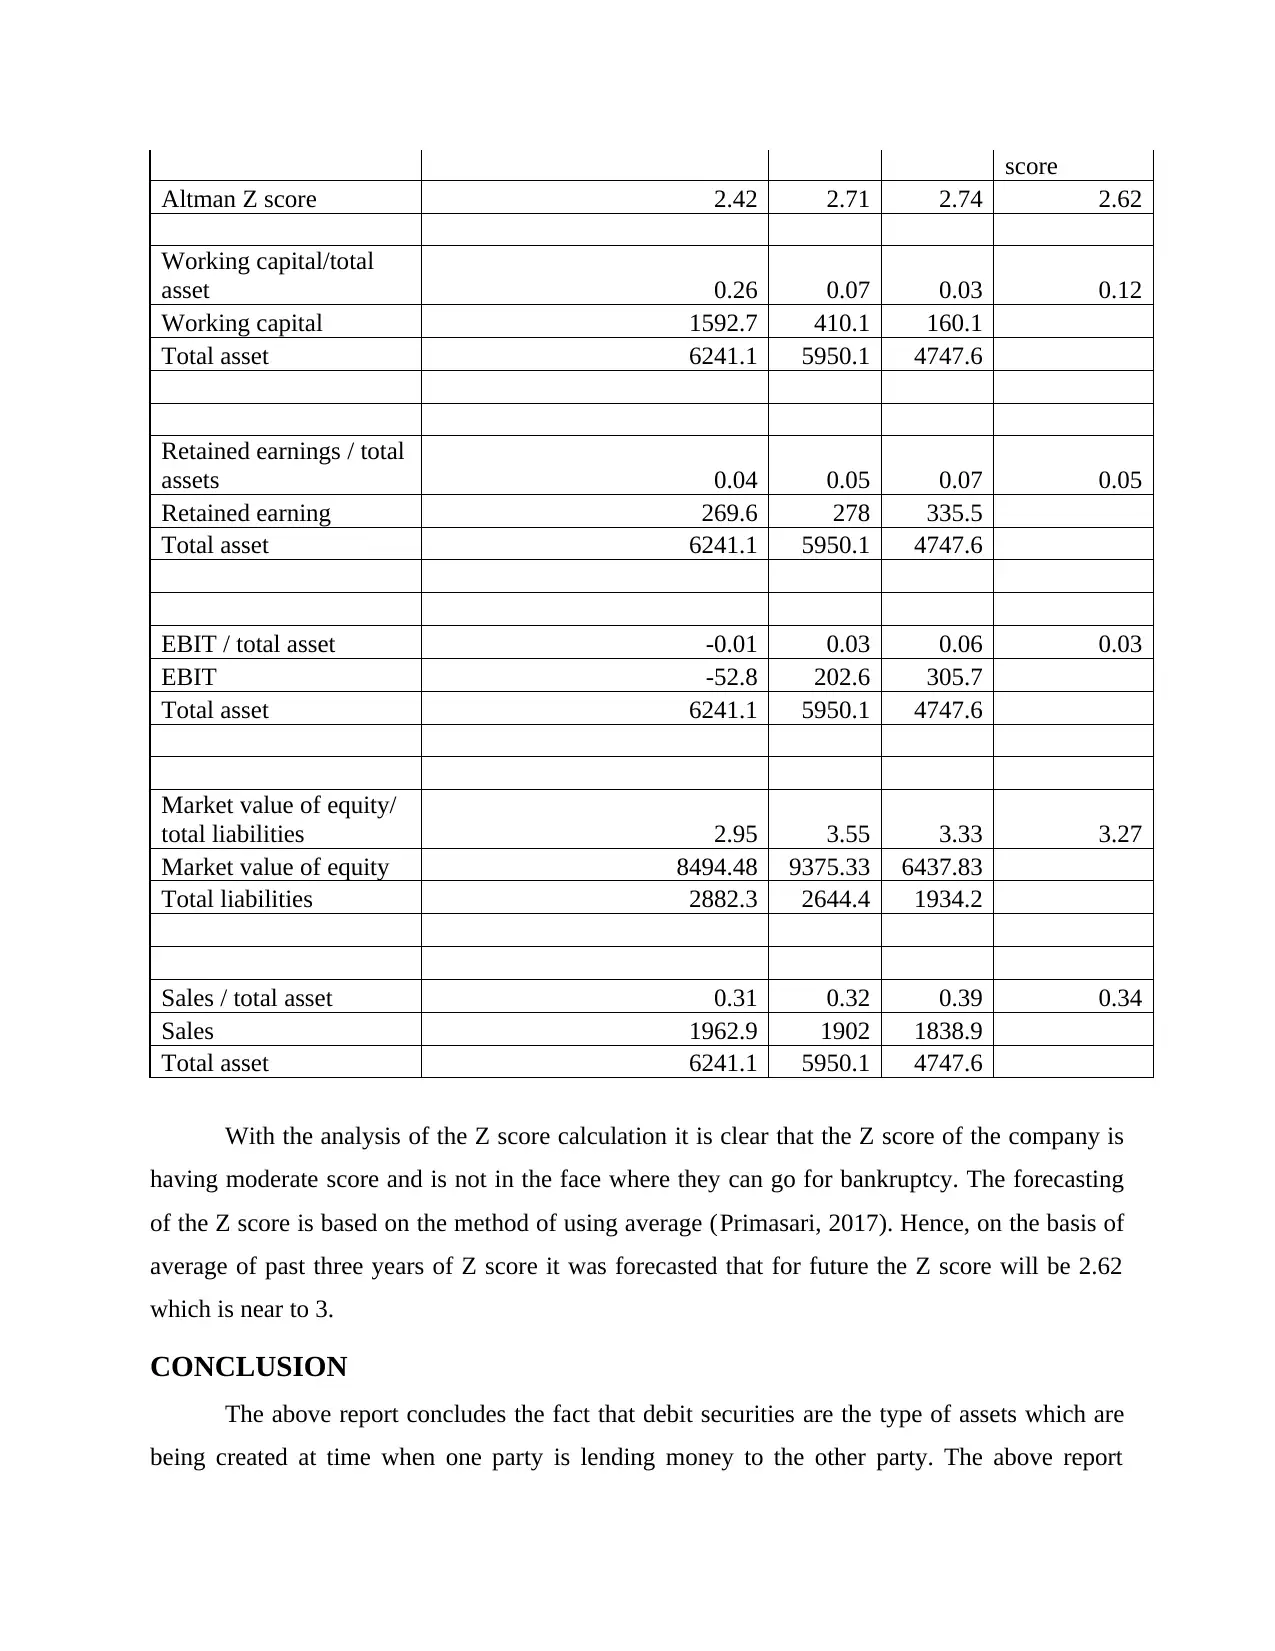
score
Altman Z score 2.42 2.71 2.74 2.62
Working capital/total
asset 0.26 0.07 0.03 0.12
Working capital 1592.7 410.1 160.1
Total asset 6241.1 5950.1 4747.6
Retained earnings / total
assets 0.04 0.05 0.07 0.05
Retained earning 269.6 278 335.5
Total asset 6241.1 5950.1 4747.6
EBIT / total asset -0.01 0.03 0.06 0.03
EBIT -52.8 202.6 305.7
Total asset 6241.1 5950.1 4747.6
Market value of equity/
total liabilities 2.95 3.55 3.33 3.27
Market value of equity 8494.48 9375.33 6437.83
Total liabilities 2882.3 2644.4 1934.2
Sales / total asset 0.31 0.32 0.39 0.34
Sales 1962.9 1902 1838.9
Total asset 6241.1 5950.1 4747.6
With the analysis of the Z score calculation it is clear that the Z score of the company is
having moderate score and is not in the face where they can go for bankruptcy. The forecasting
of the Z score is based on the method of using average (Primasari, 2017). Hence, on the basis of
average of past three years of Z score it was forecasted that for future the Z score will be 2.62
which is near to 3.
CONCLUSION
The above report concludes the fact that debit securities are the type of assets which are
being created at time when one party is lending money to the other party. The above report
⊘ This is a preview!⊘
Do you want full access?
Subscribe today to unlock all pages.
Trusted by 1+ million students worldwide
concludes that the use of ratio analysis is very important for the business as this will assist them
in analysing and evaluating the financial position of the company. the reason underlying this fact
is that when the company will be having proper calculation based on ratio then they can decide
that how to improve the working. Further it was evaluated that use of Z score is important for
analysing that whether the company is in phase of bankruptcy or not. But with the calculation it
is analysed that Qube Holding is not in phase of bankruptcy.
Paraphrase This Document
Need a fresh take? Get an instant paraphrase of this document with our AI Paraphraser
REFERENCES
Books and Journals
Altman, E. I., 2018. A fifty-year retrospective on credit risk models, the Altman Z-score family
of models and their applications to financial markets and managerial strategies. Journal of
Credit Risk. 14(4).
Cantrell, B. W., 2019. Generic Bank: Accounting for Debt Securities Sales and
Impairments. Issues in Accounting Education. 34(4). pp.15-29.
Dempsey, M., 2019. Accounting statements and ratio analysis. In Investment Analysis (pp. 77-
108). Routledge.
Islami, I. N. and Rio, W., 2019. Financial Ratio Analysis to Predict Financial Distress on
Property and Real Estate Company listed in Indonesia Stock Exchange. JAAF (Journal of
Applied Accounting and Finance). 2(2). pp.125-137.
MacCarthy, J., 2017. Using Altman Z-score and Beneish M-score models to detect financial
fraud and corporate failure: A case study of Enron Corporation. International Journal of
Finance and Accounting. 6(6). pp.159-166.
Manaseer, S. and Al-Oshaibat, S. D., 2018. Validity of Altman Z-score model to predict
financial failure: Evidence from Jordan. International Journal of Economics and
Finance. 10(8).
Marques, T. A., de Sousa Ribeiro, K. C. and Barboza, F., 2018. Corporate governance and debt
securities issued in Brazil and India: A multi-case study. Research in International
Business and Finance. 45. pp.257-270.
Primasari, N. S., 2017. Analisis Altman Z-Score, Grover Score, Springate, Dan Zmijewski
Sebagai Signaling Financial Distress (Studi Empiris Industri Barang-Barang Konsumsi Di
Indonesia). Accounting and Management Journal. 1(1).
Subburaj, L., 2019. IMPACT OF ACCOUNTING RATIO ANALYSIS IN MAKING OF
MEANINGFUL BUSINESS DECISIONS. INNOVATIONS IN BUSINESS AND
MANAGEMENT, p.193.
Szelągowska, A. and Staszkiewicz, P., 2018, May. Evaluation of the Impact of Credit Rating
Agencies Decisions on the Market of Treasury Debt Securities. In Annual Conference on
Finance and Accounting (pp. 143-151). Springer, Cham.
Tin, O. S. and Hii, J. W. S., 2020. The Relationship Between Heuristics Behaviour and
Investment Performance on Debt Securities in Johor. Journal of Arts & Social
Sciences. 3(2). pp.53-74.
1 out of 11
Related Documents


Your All-in-One AI-Powered Toolkit for Academic Success.
+13062052269
info@desklib.com
Available 24*7 on WhatsApp / Email
![[object Object]](/_next/static/media/star-bottom.7253800d.svg)
Unlock your academic potential
Copyright © 2020–2026 A2Z Services. All Rights Reserved. Developed and managed by ZUCOL.