Decision Support Tools Assignment: Decision Analysis and Simulation
VerifiedAdded on 2023/04/21
|14
|5377
|493
Homework Assignment
AI Summary
This assignment solution addresses decision analysis and simulation techniques. Question 1 explores payoff matrices and decision trees, including their advantages and applications in scenarios involving robot purchases under different market conditions, using maximax, maximin, Laplace, and regret criteria, as well as expected monetary value and expected value of perfect information. Question 2 involves probability revisions and calculations related to survey results and expected value of sample information. Question 3 presents a Monte Carlo simulation of an airline's daily profit, analyzing fare variations and overbooking compensation, followed by a managerial letter summarizing the findings and recommendations. Finally, Question 4 uses regression models to analyze the relationship between GMAT scores, age, and GPA, providing insights into their statistical significance and predictive power.

DECISION SUPPORT TOOLS
STUDENT ID:
[Pick the date]
STUDENT ID:
[Pick the date]
Paraphrase This Document
Need a fresh take? Get an instant paraphrase of this document with our AI Paraphraser
Question 1
(a) The key advantage of using the payoff matrix is that it highlights the possible payoffs in
various scenarios which facilitates comparison. The first step in forming the payoff
matrix is to highlight the various possible states of nature and identify the possible
payoffs for the different alternatives based on underlying costs and benefits. This
information is then used to construct payoff matrix (Eriksson & Kovalainen, 2015).
(b) Decision trees have the advantage of representing the various intermediate stages which
lead to the computation of the overall payoff. In situations where it is necessary to review
these intermediate decisions or nodes, it makes sense to have a decision tree analysis as
payoff tends to highlight the potential payoff resulting from a given alternative under a
given state(Medhi, 2015).
(c) The requisite computations are carried out below.
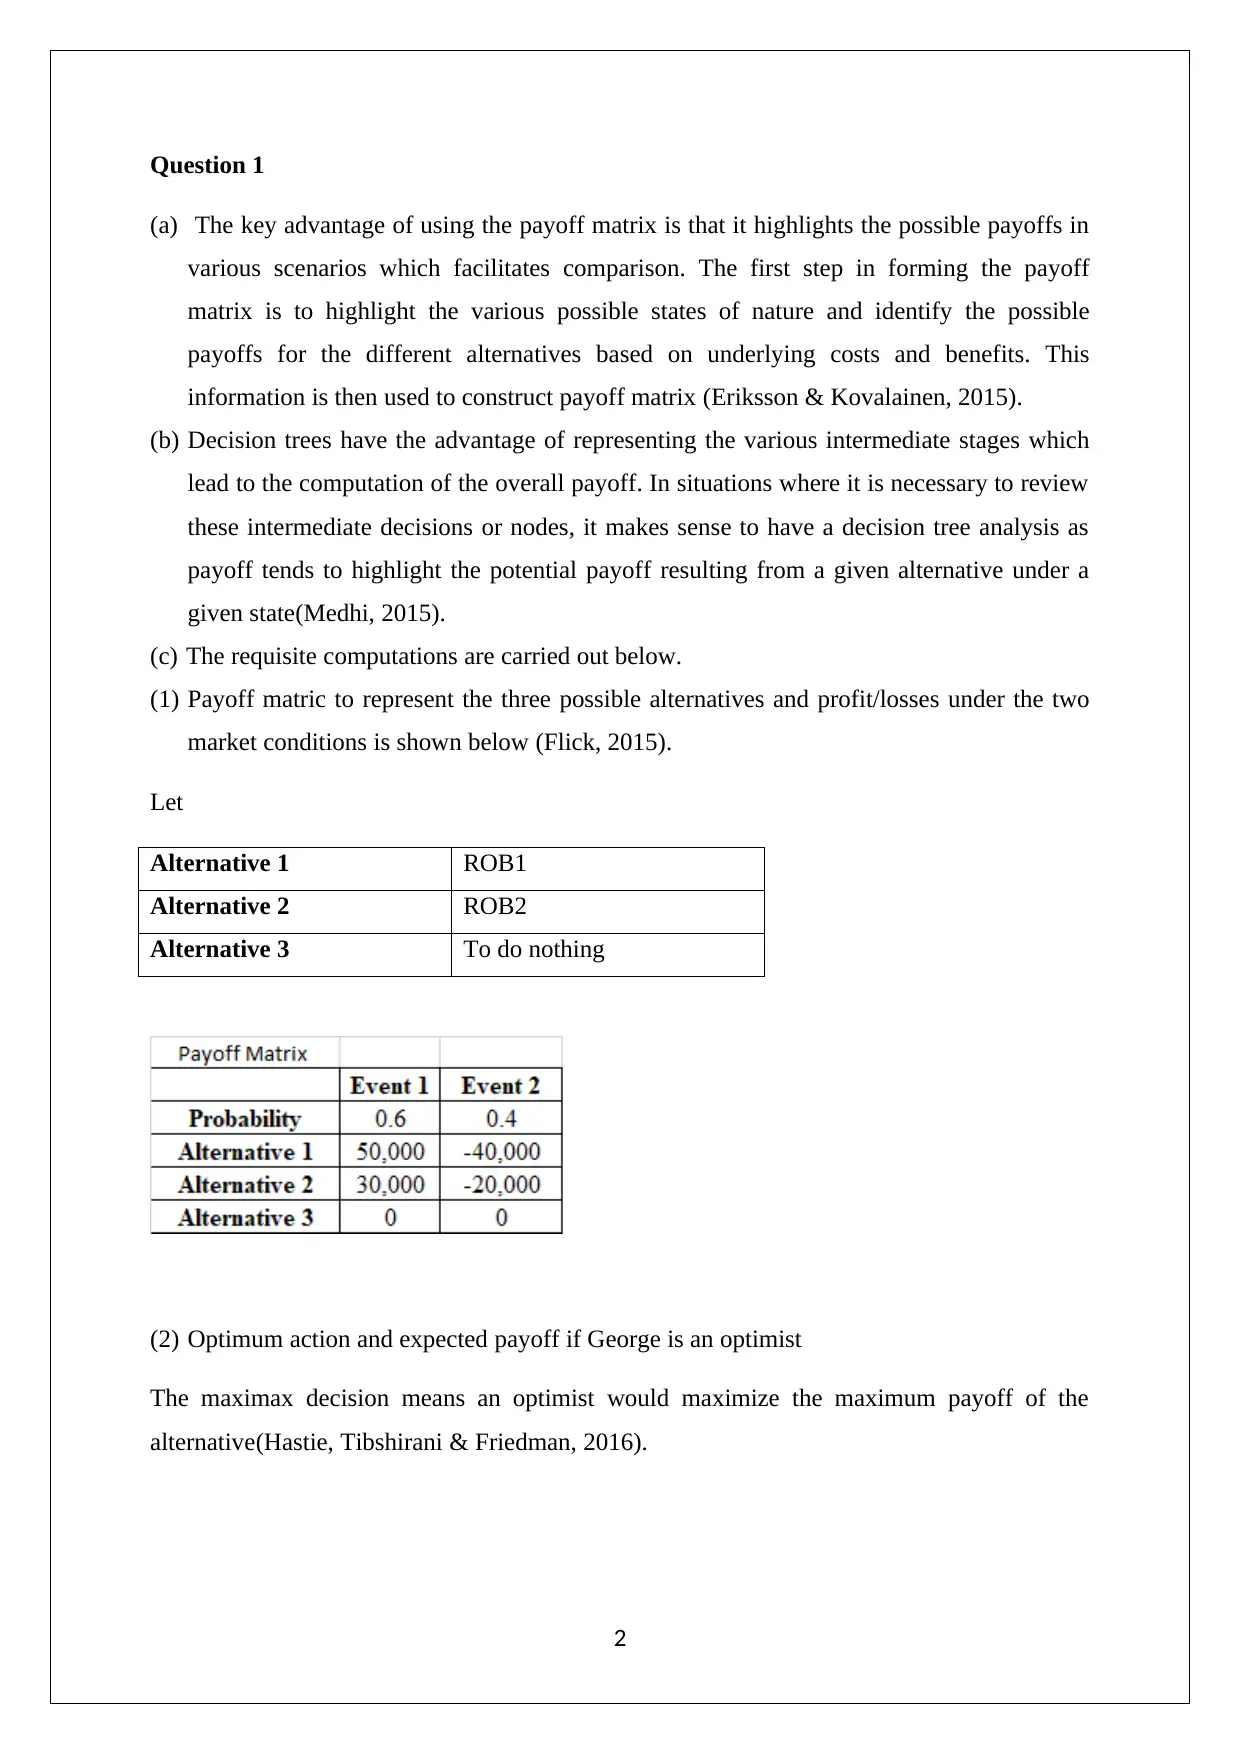
(1) Payoff matric to represent the three possible alternatives and profit/losses under the two
market conditions is shown below (Flick, 2015).
Let
Alternative 1 ROB1
Alternative 2 ROB2
Alternative 3 To do nothing
(2) Optimum action and expected payoff if George is an optimist
The maximax decision means an optimist would maximize the maximum payoff of the
alternative(Hastie, Tibshirani & Friedman, 2016).
2
(a) The key advantage of using the payoff matrix is that it highlights the possible payoffs in
various scenarios which facilitates comparison. The first step in forming the payoff
matrix is to highlight the various possible states of nature and identify the possible
payoffs for the different alternatives based on underlying costs and benefits. This
information is then used to construct payoff matrix (Eriksson & Kovalainen, 2015).
(b) Decision trees have the advantage of representing the various intermediate stages which
lead to the computation of the overall payoff. In situations where it is necessary to review
these intermediate decisions or nodes, it makes sense to have a decision tree analysis as
payoff tends to highlight the potential payoff resulting from a given alternative under a
given state(Medhi, 2015).
(c) The requisite computations are carried out below.
(1) Payoff matric to represent the three possible alternatives and profit/losses under the two
market conditions is shown below (Flick, 2015).
Let
Alternative 1 ROB1
Alternative 2 ROB2
Alternative 3 To do nothing
(2) Optimum action and expected payoff if George is an optimist
The maximax decision means an optimist would maximize the maximum payoff of the
alternative(Hastie, Tibshirani & Friedman, 2016).
2
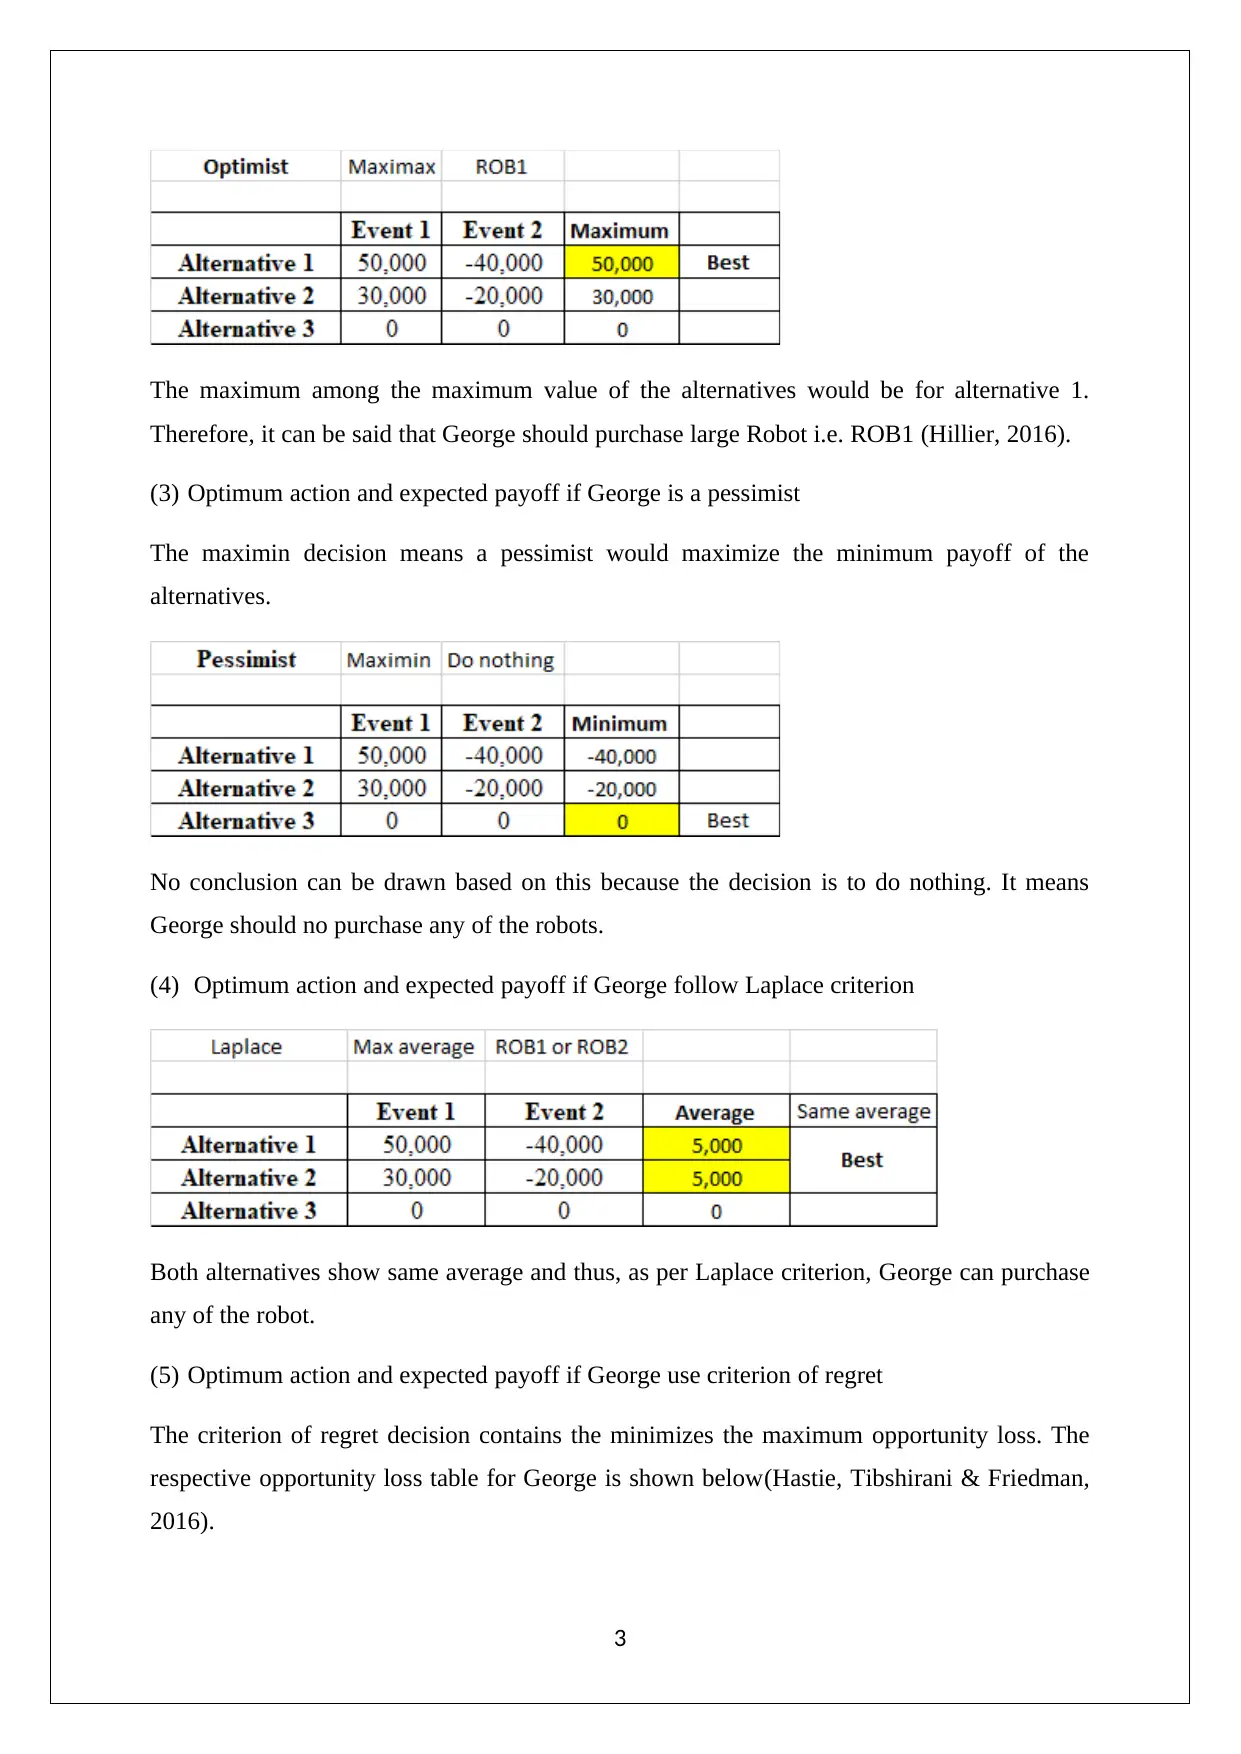
The maximum among the maximum value of the alternatives would be for alternative 1.
Therefore, it can be said that George should purchase large Robot i.e. ROB1 (Hillier, 2016).
(3) Optimum action and expected payoff if George is a pessimist
The maximin decision means a pessimist would maximize the minimum payoff of the
alternatives.
No conclusion can be drawn based on this because the decision is to do nothing. It means
George should no purchase any of the robots.
(4) Optimum action and expected payoff if George follow Laplace criterion
Both alternatives show same average and thus, as per Laplace criterion, George can purchase
any of the robot.
(5) Optimum action and expected payoff if George use criterion of regret
The criterion of regret decision contains the minimizes the maximum opportunity loss. The
respective opportunity loss table for George is shown below(Hastie, Tibshirani & Friedman,
2016).
3
⊘ This is a preview!⊘
Do you want full access?
Subscribe today to unlock all pages.
Trusted by 1+ million students worldwide
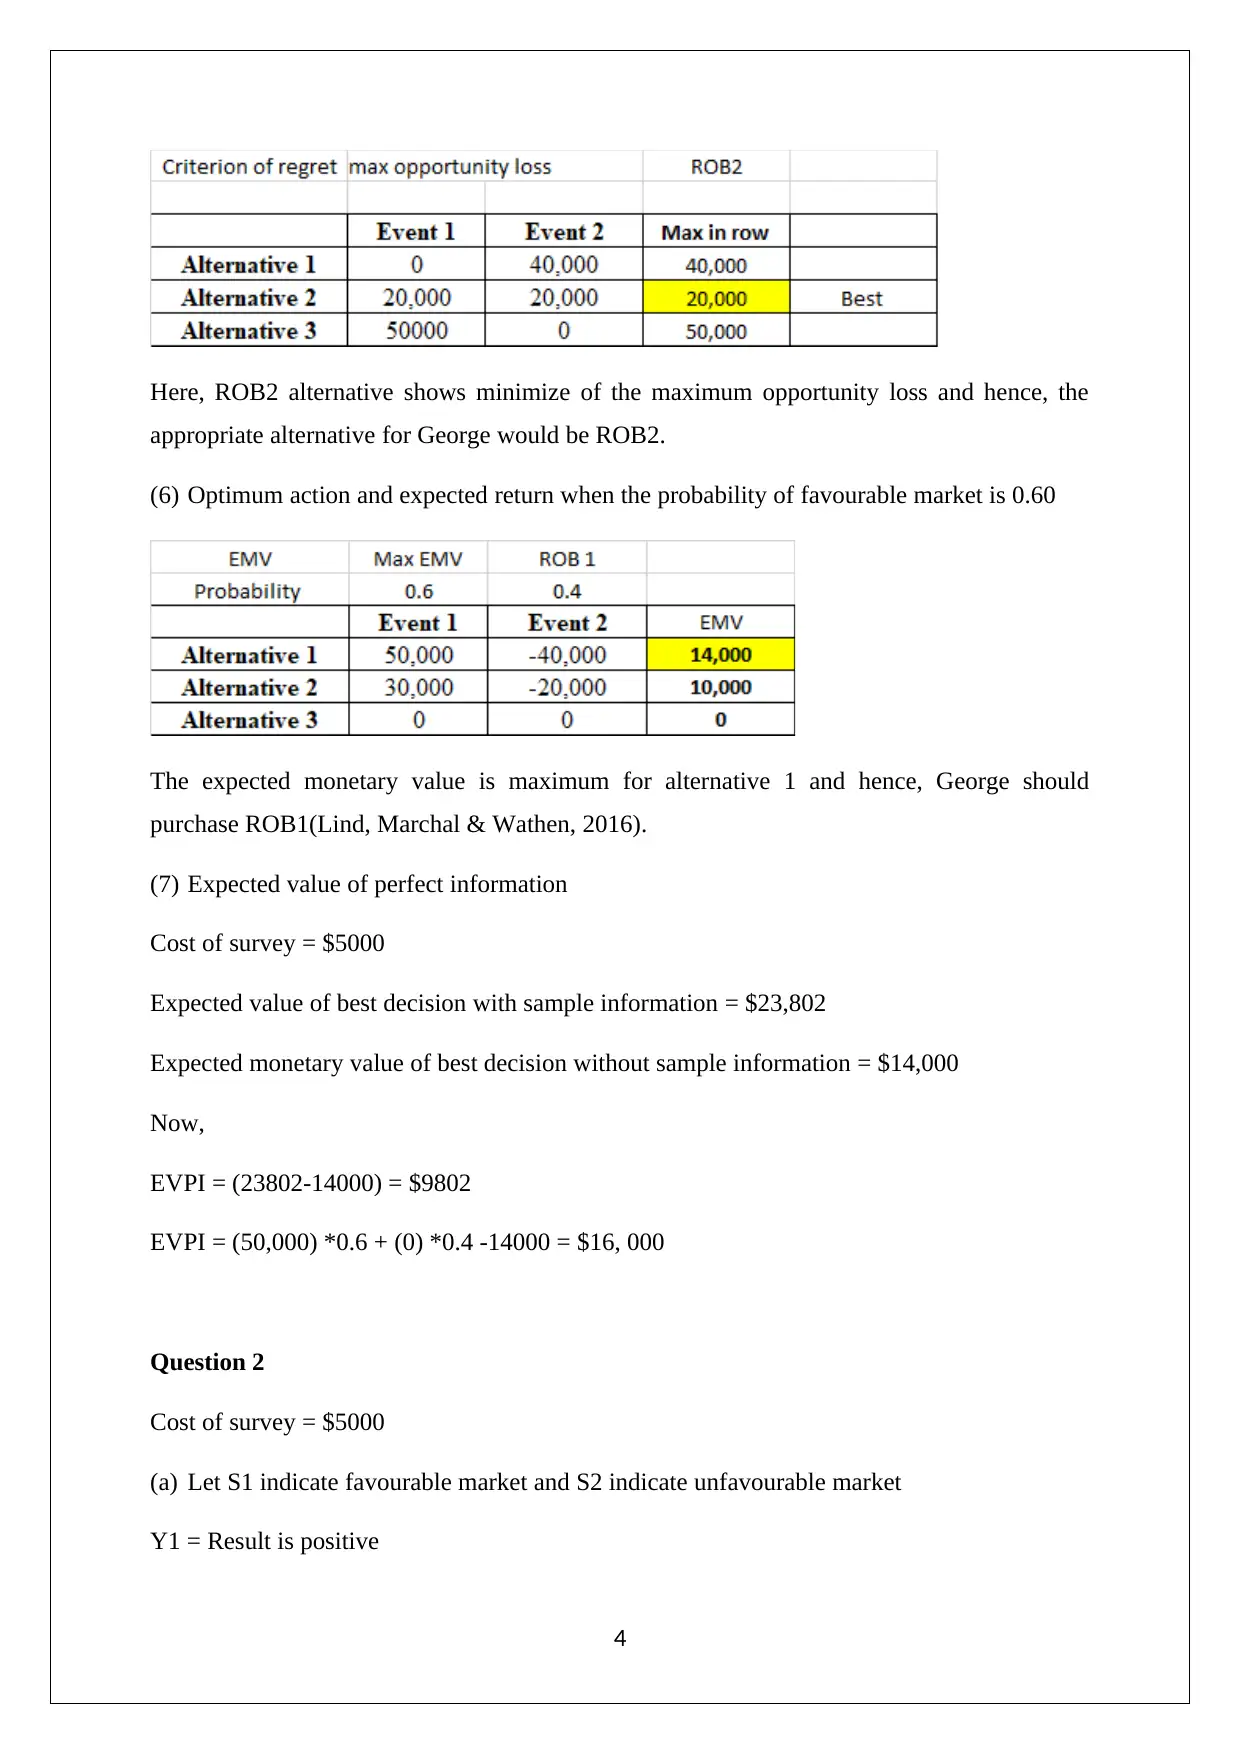
Here, ROB2 alternative shows minimize of the maximum opportunity loss and hence, the
appropriate alternative for George would be ROB2.
(6) Optimum action and expected return when the probability of favourable market is 0.60
The expected monetary value is maximum for alternative 1 and hence, George should
purchase ROB1(Lind, Marchal & Wathen, 2016).
(7) Expected value of perfect information
Cost of survey = $5000
Expected value of best decision with sample information = $23,802
Expected monetary value of best decision without sample information = $14,000
Now,
EVPI = (23802-14000) = $9802
EVPI = (50,000) *0.6 + (0) *0.4 -14000 = $16, 000
Question 2
Cost of survey = $5000
(a) Let S1 indicate favourable market and S2 indicate unfavourable market
Y1 = Result is positive
4
Paraphrase This Document
Need a fresh take? Get an instant paraphrase of this document with our AI Paraphraser
Y2= Result s negative
As per the given data,. P(Y1 l S1) = 0.9, P(Y2 l S2) = 0.8
Also, this would imply, P(Y2 l S1) = 0.1, P (Y1 l S2) = 0.2
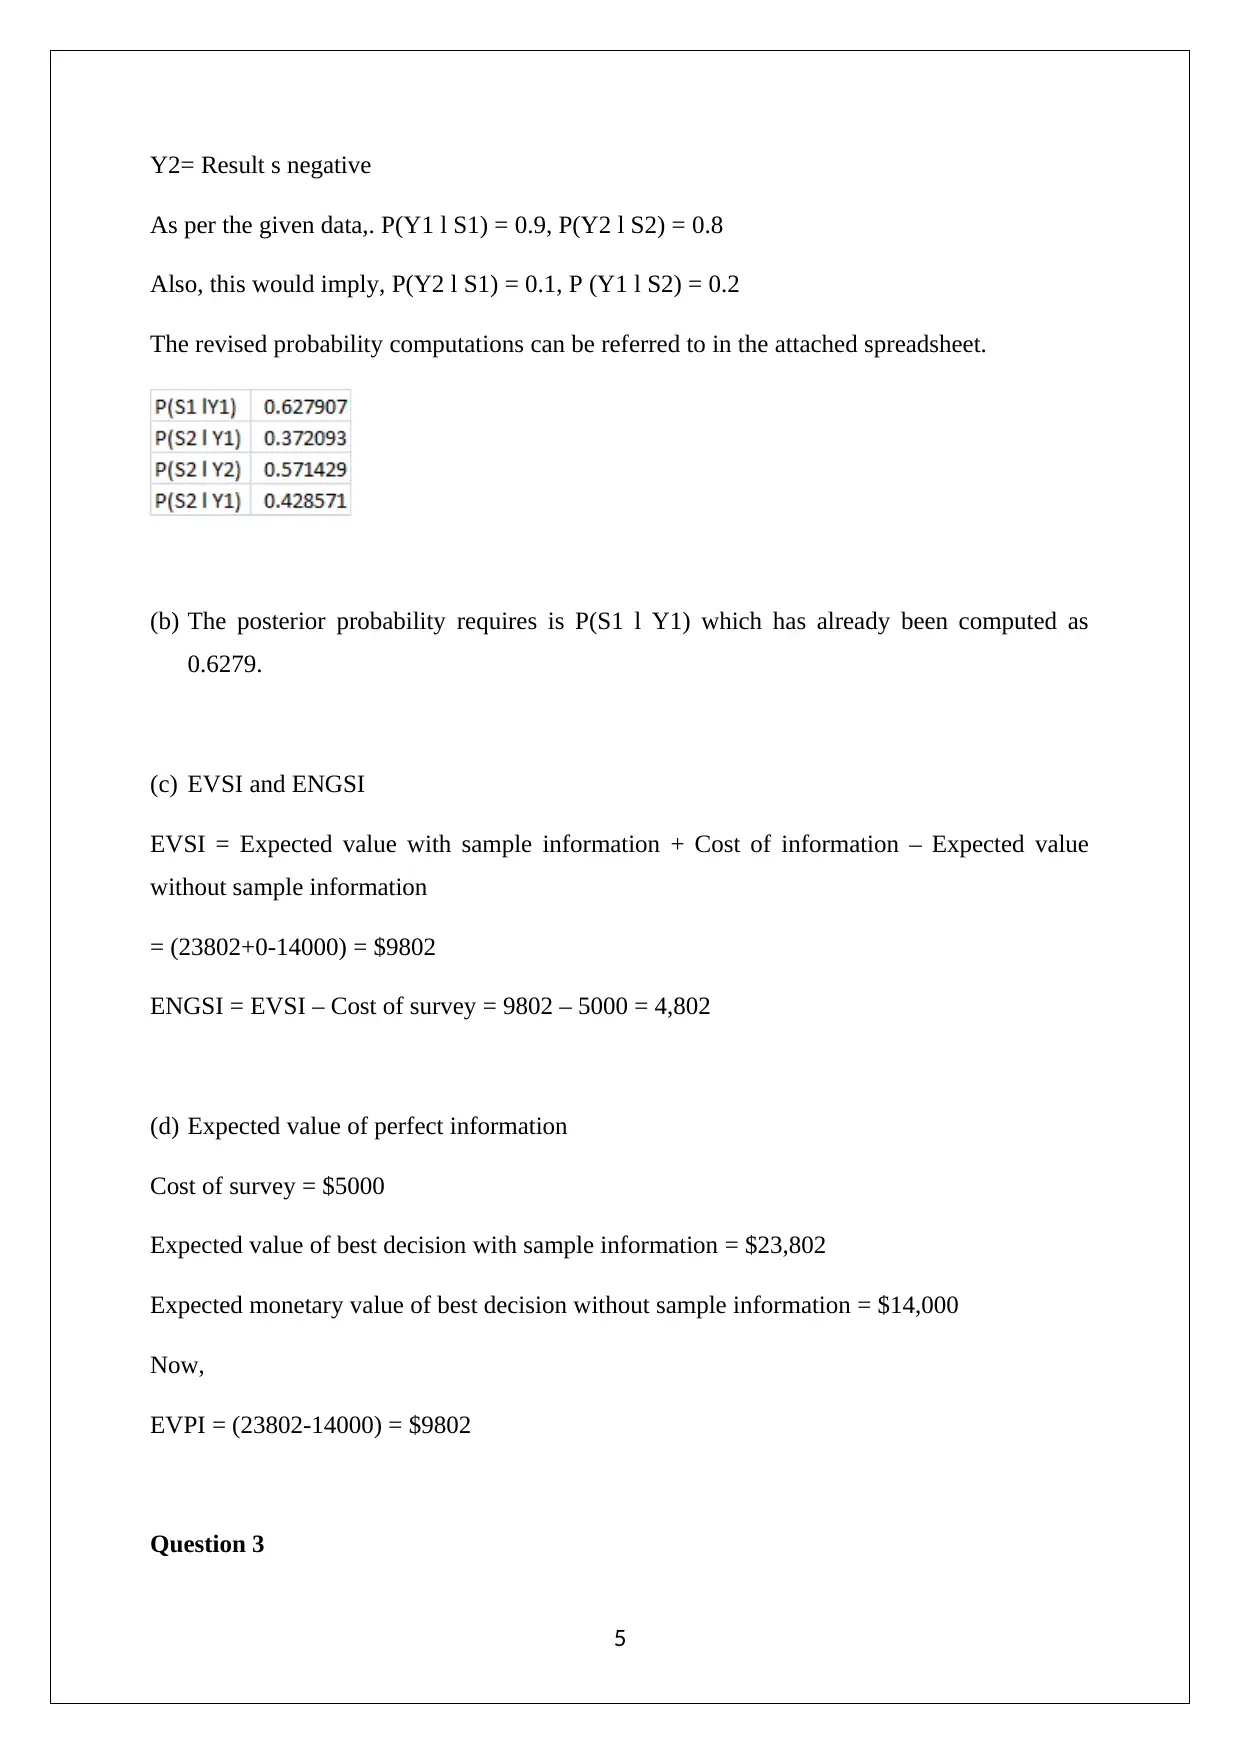
The revised probability computations can be referred to in the attached spreadsheet.
(b) The posterior probability requires is P(S1 l Y1) which has already been computed as
0.6279.
(c) EVSI and ENGSI
EVSI = Expected value with sample information + Cost of information – Expected value
without sample information
= (23802+0-14000) = $9802
ENGSI = EVSI – Cost of survey = 9802 – 5000 = 4,802
(d) Expected value of perfect information
Cost of survey = $5000
Expected value of best decision with sample information = $23,802
Expected monetary value of best decision without sample information = $14,000
Now,
EVPI = (23802-14000) = $9802
Question 3
5
As per the given data,. P(Y1 l S1) = 0.9, P(Y2 l S2) = 0.8
Also, this would imply, P(Y2 l S1) = 0.1, P (Y1 l S2) = 0.2
The revised probability computations can be referred to in the attached spreadsheet.
(b) The posterior probability requires is P(S1 l Y1) which has already been computed as
0.6279.
(c) EVSI and ENGSI
EVSI = Expected value with sample information + Cost of information – Expected value
without sample information
= (23802+0-14000) = $9802
ENGSI = EVSI – Cost of survey = 9802 – 5000 = 4,802
(d) Expected value of perfect information
Cost of survey = $5000
Expected value of best decision with sample information = $23,802
Expected monetary value of best decision without sample information = $14,000
Now,
EVPI = (23802-14000) = $9802
Question 3
5
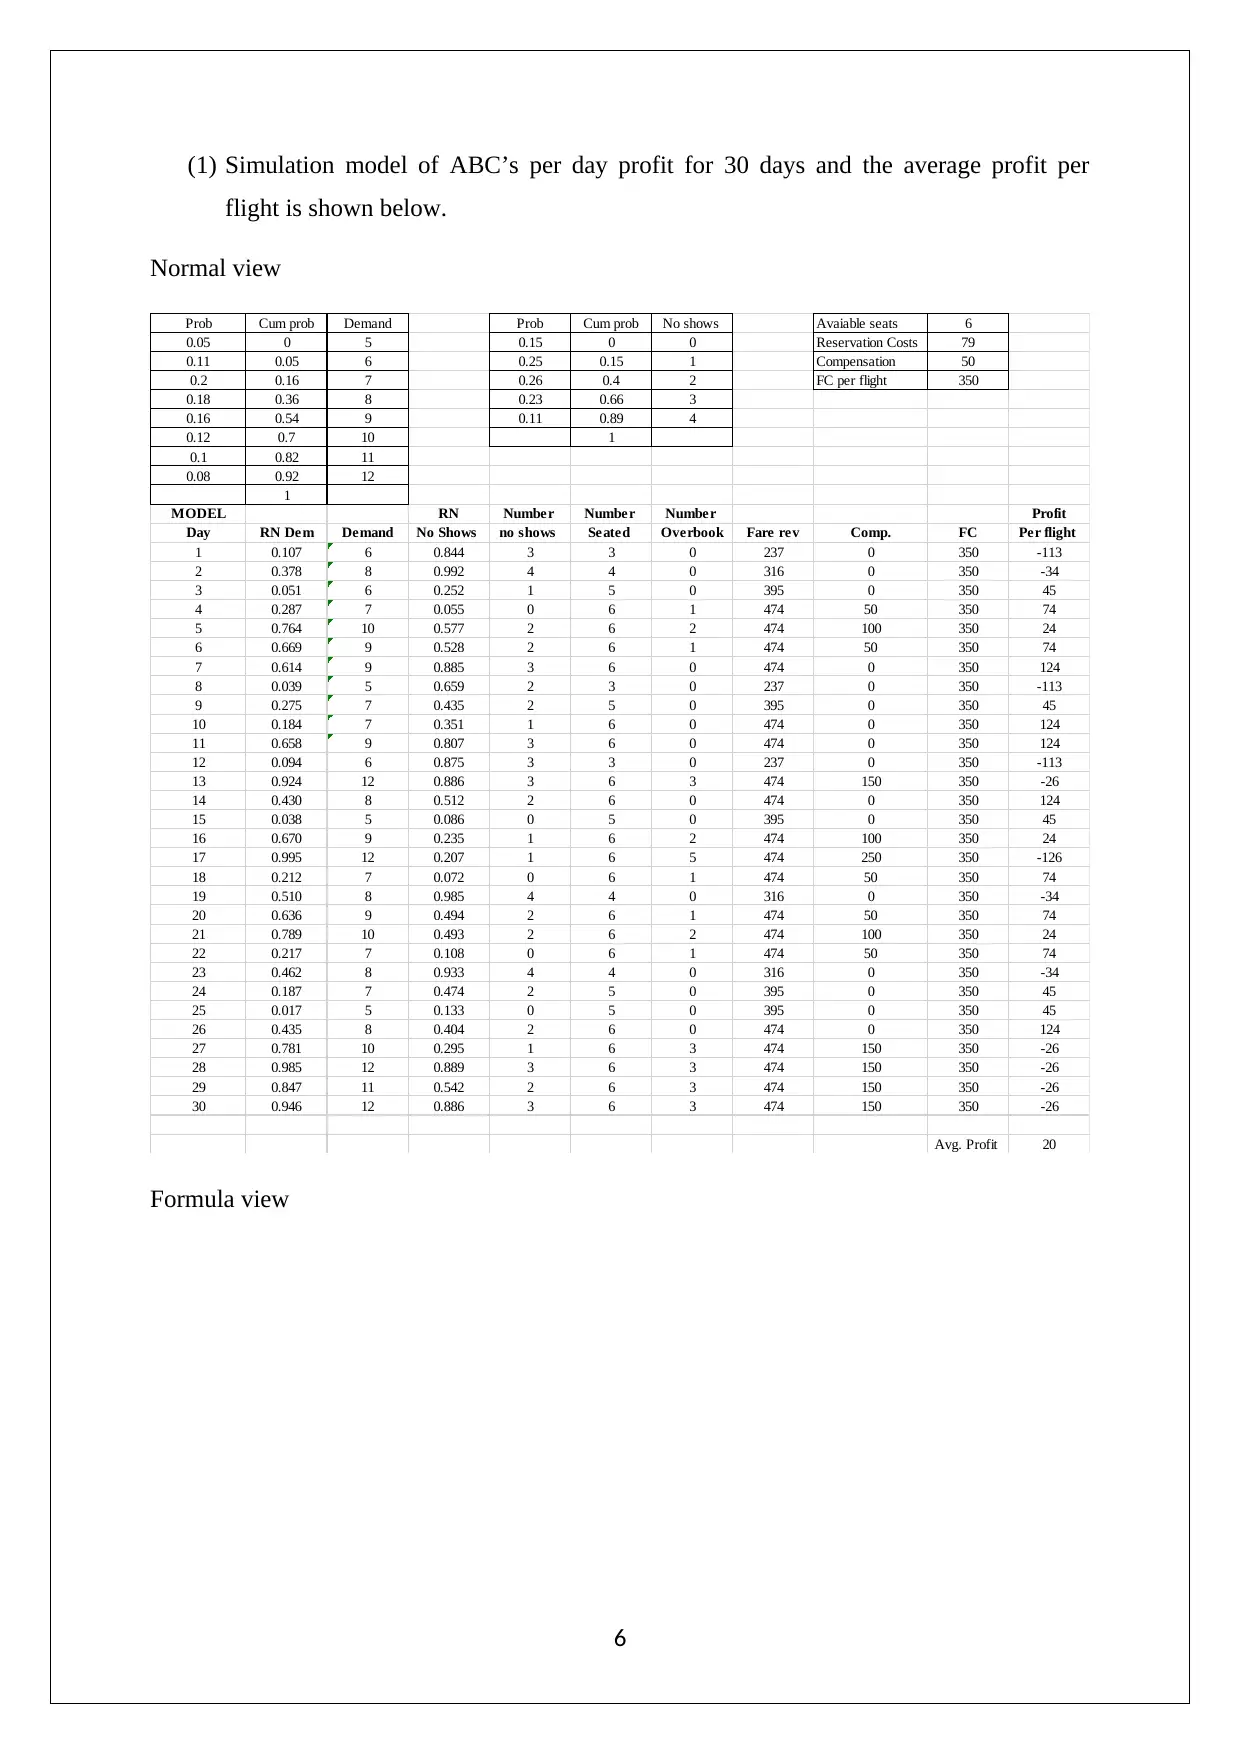
(1) Simulation model of ABC’s per day profit for 30 days and the average profit per
flight is shown below.
Normal view
Prob Cum prob Demand Prob Cum prob No shows Avaiable seats 6
0.05 0 5 0.15 0 0 Reservation Costs 79
0.11 0.05 6 0.25 0.15 1 Compensation 50
0.2 0.16 7 0.26 0.4 2 FC per flight 350
0.18 0.36 8 0.23 0.66 3
0.16 0.54 9 0.11 0.89 4
0.12 0.7 10 1
0.1 0.82 11
0.08 0.92 12
1
MODEL RN Number Number Number Profit
Day RN Dem Demand No Shows no shows Seated Overbook Fare rev Comp. FC Per flight
1 0.107 6 0.844 3 3 0 237 0 350 -113
2 0.378 8 0.992 4 4 0 316 0 350 -34
3 0.051 6 0.252 1 5 0 395 0 350 45
4 0.287 7 0.055 0 6 1 474 50 350 74
5 0.764 10 0.577 2 6 2 474 100 350 24
6 0.669 9 0.528 2 6 1 474 50 350 74
7 0.614 9 0.885 3 6 0 474 0 350 124
8 0.039 5 0.659 2 3 0 237 0 350 -113
9 0.275 7 0.435 2 5 0 395 0 350 45
10 0.184 7 0.351 1 6 0 474 0 350 124
11 0.658 9 0.807 3 6 0 474 0 350 124
12 0.094 6 0.875 3 3 0 237 0 350 -113
13 0.924 12 0.886 3 6 3 474 150 350 -26
14 0.430 8 0.512 2 6 0 474 0 350 124
15 0.038 5 0.086 0 5 0 395 0 350 45
16 0.670 9 0.235 1 6 2 474 100 350 24
17 0.995 12 0.207 1 6 5 474 250 350 -126
18 0.212 7 0.072 0 6 1 474 50 350 74
19 0.510 8 0.985 4 4 0 316 0 350 -34
20 0.636 9 0.494 2 6 1 474 50 350 74
21 0.789 10 0.493 2 6 2 474 100 350 24
22 0.217 7 0.108 0 6 1 474 50 350 74
23 0.462 8 0.933 4 4 0 316 0 350 -34
24 0.187 7 0.474 2 5 0 395 0 350 45
25 0.017 5 0.133 0 5 0 395 0 350 45
26 0.435 8 0.404 2 6 0 474 0 350 124
27 0.781 10 0.295 1 6 3 474 150 350 -26
28 0.985 12 0.889 3 6 3 474 150 350 -26
29 0.847 11 0.542 2 6 3 474 150 350 -26
30 0.946 12 0.886 3 6 3 474 150 350 -26
Avg. Profit 20
Formula view
6
⊘ This is a preview!⊘
Do you want full access?
Subscribe today to unlock all pages.
Trusted by 1+ million students worldwide
Prob Cum prob Demand Prob Cum prob No shows Avaiable seats 6
0.05 0 5 0.15 0 0 Reservation Costs 79
0.11 =A2+B2 6 0.25 =E2+F2 1 Compensation 50
0.2 =A3+B3 7 0.26 =E3+F3 2 FC per flight 350
0.18 =A4+B4 8 0.23 =E4+F4 3
0.16 =A5+B5 9 0.11 =E5+F5 4
0.12 =A6+B6 10 =E6+F6
0.1 =A7+B7 11
0.08 =A8+B8 12
=B9+A9
MODEL RN Number Number Number Profit
Day RN Demand Demand No Shows no shows Seated Overbook Fare rev Comp. FC Per flight
1 =RAND() =VLOOKUP(B13,$B$2:$C$9,2,1) =RAND() =VLOOKUP(D13,$F$2:$G$6,2,1) =IF(C13-E13>=6,"6",C13-E13) =IF(C13-E13-$J$1<=0,"0",C13-E13-F13) =F13*$J$2 =G13*$J$3 =$J$4 =H13-I13-J13
2 =RAND() =VLOOKUP(B14,$B$2:$C$9,2,1) =RAND() =VLOOKUP(D14,$F$2:$G$6,2,1) =IF(C14-E14>=6,"6",C14-E14) =IF(C14-E14-$J$1<=0,"0",C14-E14-F14) =F14*$J$2 =G14*$J$3 =$J$4 =H14-I14-J14
3 =RAND() =VLOOKUP(B15,$B$2:$C$9,2,1) =RAND() =VLOOKUP(D15,$F$2:$G$6,2,1) =IF(C15-E15>=6,"6",C15-E15) =IF(C15-E15-$J$1<=0,"0",C15-E15-F15) =F15*$J$2 =G15*$J$3 =$J$4 =H15-I15-J15
4 =RAND() =VLOOKUP(B16,$B$2:$C$9,2,1) =RAND() =VLOOKUP(D16,$F$2:$G$6,2,1) =IF(C16-E16>=6,"6",C16-E16) =IF(C16-E16-$J$1<=0,"0",C16-E16-F16) =F16*$J$2 =G16*$J$3 =$J$4 =H16-I16-J16
5 =RAND() =VLOOKUP(B17,$B$2:$C$9,2,1) =RAND() =VLOOKUP(D17,$F$2:$G$6,2,1) =IF(C17-E17>=6,"6",C17-E17) =IF(C17-E17-$J$1<=0,"0",C17-E17-F17) =F17*$J$2 =G17*$J$3 =$J$4 =H17-I17-J17
6 =RAND() =VLOOKUP(B18,$B$2:$C$9,2,1) =RAND() =VLOOKUP(D18,$F$2:$G$6,2,1) =IF(C18-E18>=6,"6",C18-E18) =IF(C18-E18-$J$1<=0,"0",C18-E18-F18) =F18*$J$2 =G18*$J$3 =$J$4 =H18-I18-J18
7 =RAND() =VLOOKUP(B19,$B$2:$C$9,2,1) =RAND() =VLOOKUP(D19,$F$2:$G$6,2,1) =IF(C19-E19>=6,"6",C19-E19) =IF(C19-E19-$J$1<=0,"0",C19-E19-F19) =F19*$J$2 =G19*$J$3 =$J$4 =H19-I19-J19
8 =RAND() =VLOOKUP(B20,$B$2:$C$9,2,1) =RAND() =VLOOKUP(D20,$F$2:$G$6,2,1) =IF(C20-E20>=6,"6",C20-E20) =IF(C20-E20-$J$1<=0,"0",C20-E20-F20) =F20*$J$2 =G20*$J$3 =$J$4 =H20-I20-J20
9 =RAND() =VLOOKUP(B21,$B$2:$C$9,2,1) =RAND() =VLOOKUP(D21,$F$2:$G$6,2,1) =IF(C21-E21>=6,"6",C21-E21) =IF(C21-E21-$J$1<=0,"0",C21-E21-F21) =F21*$J$2 =G21*$J$3 =$J$4 =H21-I21-J21
10 =RAND() =VLOOKUP(B22,$B$2:$C$9,2,1) =RAND() =VLOOKUP(D22,$F$2:$G$6,2,1) =IF(C22-E22>=6,"6",C22-E22) =IF(C22-E22-$J$1<=0,"0",C22-E22-F22) =F22*$J$2 =G22*$J$3 =$J$4 =H22-I22-J22
11 =RAND() =VLOOKUP(B23,$B$2:$C$9,2,1) =RAND() =VLOOKUP(D23,$F$2:$G$6,2,1) =IF(C23-E23>=6,"6",C23-E23) =IF(C23-E23-$J$1<=0,"0",C23-E23-F23) =F23*$J$2 =G23*$J$3 =$J$4 =H23-I23-J23
12 =RAND() =VLOOKUP(B24,$B$2:$C$9,2,1) =RAND() =VLOOKUP(D24,$F$2:$G$6,2,1) =IF(C24-E24>=6,"6",C24-E24) =IF(C24-E24-$J$1<=0,"0",C24-E24-F24) =F24*$J$2 =G24*$J$3 =$J$4 =H24-I24-J24
13 =RAND() =VLOOKUP(B25,$B$2:$C$9,2,1) =RAND() =VLOOKUP(D25,$F$2:$G$6,2,1) =IF(C25-E25>=6,"6",C25-E25) =IF(C25-E25-$J$1<=0,"0",C25-E25-F25) =F25*$J$2 =G25*$J$3 =$J$4 =H25-I25-J25
14 =RAND() =VLOOKUP(B26,$B$2:$C$9,2,1) =RAND() =VLOOKUP(D26,$F$2:$G$6,2,1) =IF(C26-E26>=6,"6",C26-E26) =IF(C26-E26-$J$1<=0,"0",C26-E26-F26) =F26*$J$2 =G26*$J$3 =$J$4 =H26-I26-J26
15 =RAND() =VLOOKUP(B27,$B$2:$C$9,2,1) =RAND() =VLOOKUP(D27,$F$2:$G$6,2,1) =IF(C27-E27>=6,"6",C27-E27) =IF(C27-E27-$J$1<=0,"0",C27-E27-F27) =F27*$J$2 =G27*$J$3 =$J$4 =H27-I27-J27
16 =RAND() =VLOOKUP(B28,$B$2:$C$9,2,1) =RAND() =VLOOKUP(D28,$F$2:$G$6,2,1) =IF(C28-E28>=6,"6",C28-E28) =IF(C28-E28-$J$1<=0,"0",C28-E28-F28) =F28*$J$2 =G28*$J$3 =$J$4 =H28-I28-J28
17 =RAND() =VLOOKUP(B29,$B$2:$C$9,2,1) =RAND() =VLOOKUP(D29,$F$2:$G$6,2,1) =IF(C29-E29>=6,"6",C29-E29) =IF(C29-E29-$J$1<=0,"0",C29-E29-F29) =F29*$J$2 =G29*$J$3 =$J$4 =H29-I29-J29
18 =RAND() =VLOOKUP(B30,$B$2:$C$9,2,1) =RAND() =VLOOKUP(D30,$F$2:$G$6,2,1) =IF(C30-E30>=6,"6",C30-E30) =IF(C30-E30-$J$1<=0,"0",C30-E30-F30) =F30*$J$2 =G30*$J$3 =$J$4 =H30-I30-J30
19 =RAND() =VLOOKUP(B31,$B$2:$C$9,2,1) =RAND() =VLOOKUP(D31,$F$2:$G$6,2,1) =IF(C31-E31>=6,"6",C31-E31) =IF(C31-E31-$J$1<=0,"0",C31-E31-F31) =F31*$J$2 =G31*$J$3 =$J$4 =H31-I31-J31
20 =RAND() =VLOOKUP(B32,$B$2:$C$9,2,1) =RAND() =VLOOKUP(D32,$F$2:$G$6,2,1) =IF(C32-E32>=6,"6",C32-E32) =IF(C32-E32-$J$1<=0,"0",C32-E32-F32) =F32*$J$2 =G32*$J$3 =$J$4 =H32-I32-J32
21 =RAND() =VLOOKUP(B33,$B$2:$C$9,2,1) =RAND() =VLOOKUP(D33,$F$2:$G$6,2,1) =IF(C33-E33>=6,"6",C33-E33) =IF(C33-E33-$J$1<=0,"0",C33-E33-F33) =F33*$J$2 =G33*$J$3 =$J$4 =H33-I33-J33
22 =RAND() =VLOOKUP(B34,$B$2:$C$9,2,1) =RAND() =VLOOKUP(D34,$F$2:$G$6,2,1) =IF(C34-E34>=6,"6",C34-E34) =IF(C34-E34-$J$1<=0,"0",C34-E34-F34) =F34*$J$2 =G34*$J$3 =$J$4 =H34-I34-J34
23 =RAND() =VLOOKUP(B35,$B$2:$C$9,2,1) =RAND() =VLOOKUP(D35,$F$2:$G$6,2,1) =IF(C35-E35>=6,"6",C35-E35) =IF(C35-E35-$J$1<=0,"0",C35-E35-F35) =F35*$J$2 =G35*$J$3 =$J$4 =H35-I35-J35
24 =RAND() =VLOOKUP(B36,$B$2:$C$9,2,1) =RAND() =VLOOKUP(D36,$F$2:$G$6,2,1) =IF(C36-E36>=6,"6",C36-E36) =IF(C36-E36-$J$1<=0,"0",C36-E36-F36) =F36*$J$2 =G36*$J$3 =$J$4 =H36-I36-J36
25 =RAND() =VLOOKUP(B37,$B$2:$C$9,2,1) =RAND() =VLOOKUP(D37,$F$2:$G$6,2,1) =IF(C37-E37>=6,"6",C37-E37) =IF(C37-E37-$J$1<=0,"0",C37-E37-F37) =F37*$J$2 =G37*$J$3 =$J$4 =H37-I37-J37
26 =RAND() =VLOOKUP(B38,$B$2:$C$9,2,1) =RAND() =VLOOKUP(D38,$F$2:$G$6,2,1) =IF(C38-E38>=6,"6",C38-E38) =IF(C38-E38-$J$1<=0,"0",C38-E38-F38) =F38*$J$2 =G38*$J$3 =$J$4 =H38-I38-J38
27 =RAND() =VLOOKUP(B39,$B$2:$C$9,2,1) =RAND() =VLOOKUP(D39,$F$2:$G$6,2,1) =IF(C39-E39>=6,"6",C39-E39) =IF(C39-E39-$J$1<=0,"0",C39-E39-F39) =F39*$J$2 =G39*$J$3 =$J$4 =H39-I39-J39
28 =RAND() =VLOOKUP(B40,$B$2:$C$9,2,1) =RAND() =VLOOKUP(D40,$F$2:$G$6,2,1) =IF(C40-E40>=6,"6",C40-E40) =IF(C40-E40-$J$1<=0,"0",C40-E40-F40) =F40*$J$2 =G40*$J$3 =$J$4 =H40-I40-J40
29 =RAND() =VLOOKUP(B41,$B$2:$C$9,2,1) =RAND() =VLOOKUP(D41,$F$2:$G$6,2,1) =IF(C41-E41>=6,"6",C41-E41) =IF(C41-E41-$J$1<=0,"0",C41-E41-F41) =F41*$J$2 =G41*$J$3 =$J$4 =H41-I41-J41
30 =RAND() =VLOOKUP(B42,$B$2:$C$9,2,1) =RAND() =VLOOKUP(D42,$F$2:$G$6,2,1) =IF(C42-E42>=6,"6",C42-E42) =IF(C42-E42-$J$1<=0,"0",C42-E42-F42) =F42*$J$2 =G42*$J$3 =$J$4 =H42-I42-J42
Avg. Profit =AVERAGE(K13:K42)
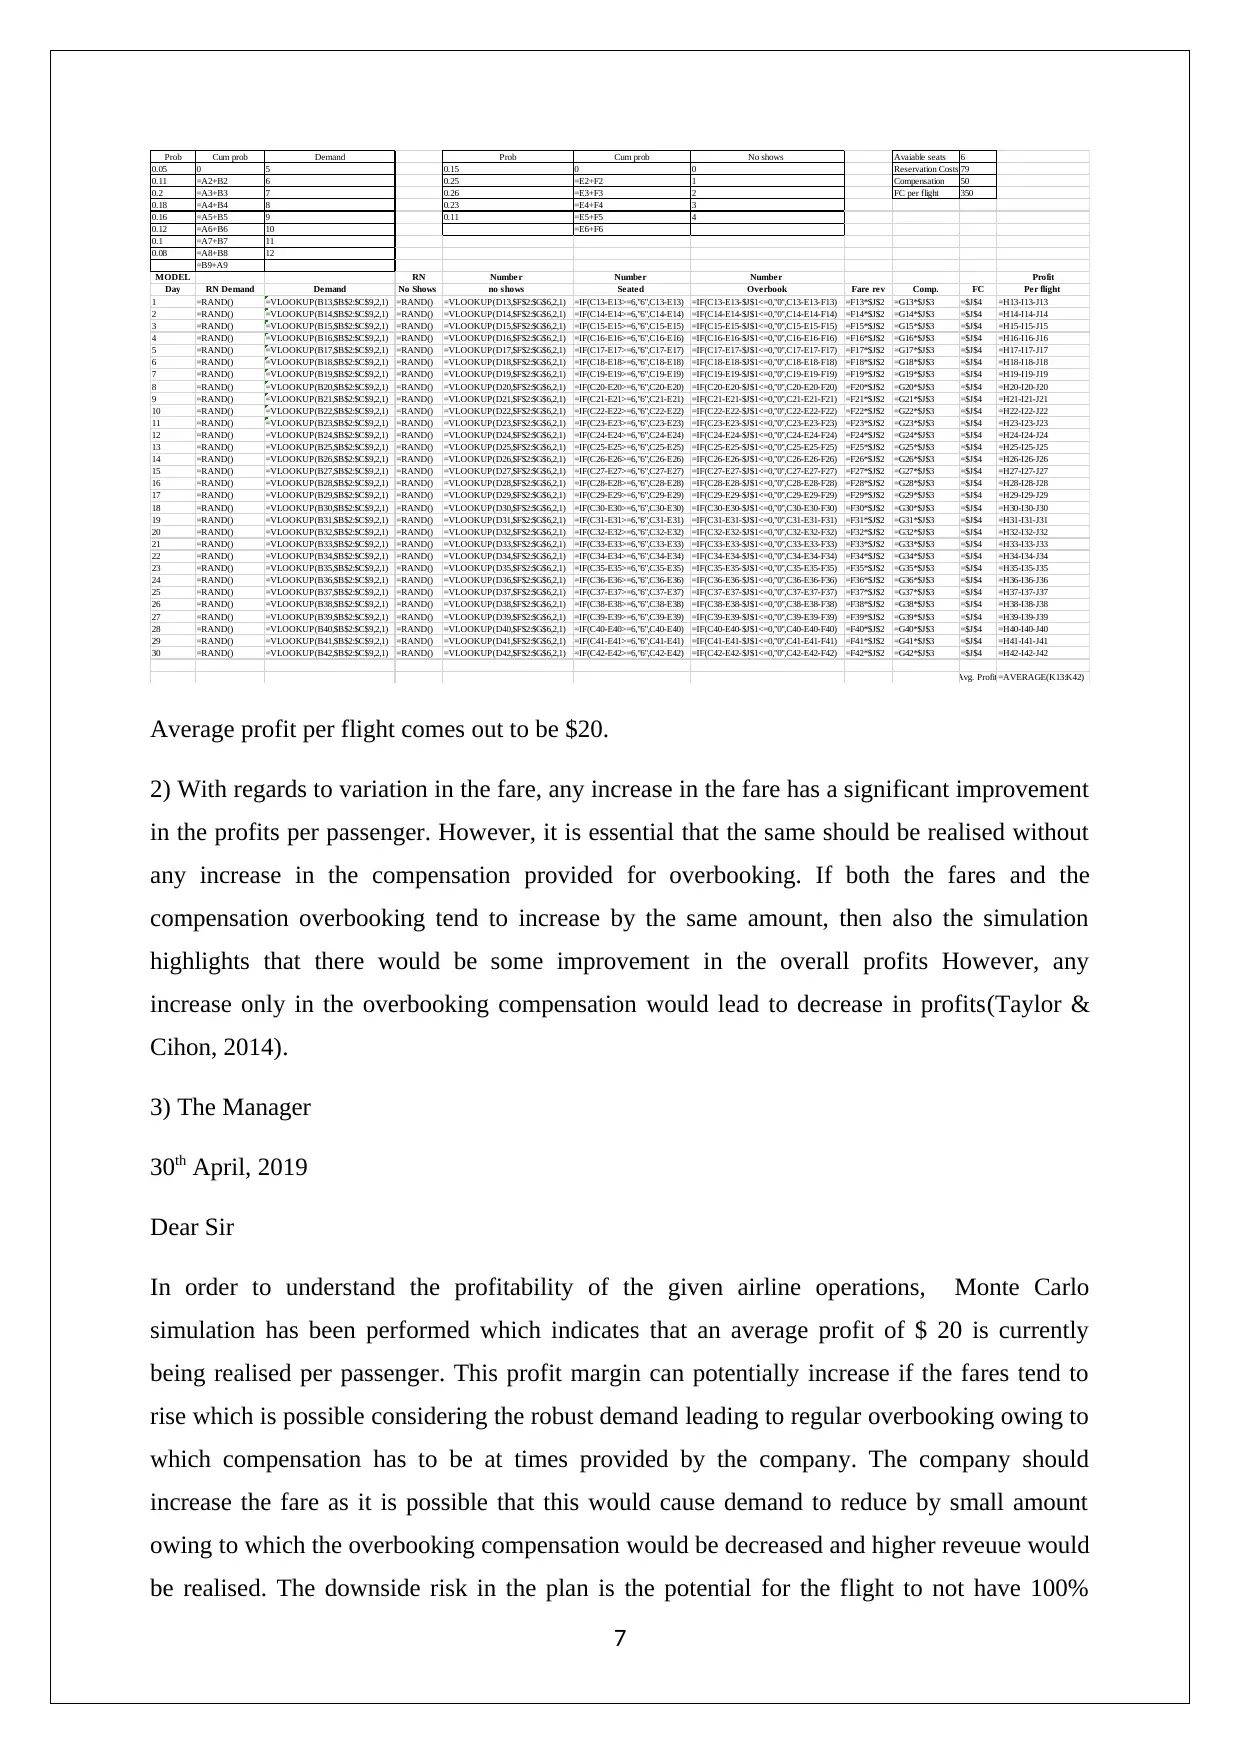
Average profit per flight comes out to be $20.
2) With regards to variation in the fare, any increase in the fare has a significant improvement
in the profits per passenger. However, it is essential that the same should be realised without
any increase in the compensation provided for overbooking. If both the fares and the
compensation overbooking tend to increase by the same amount, then also the simulation
highlights that there would be some improvement in the overall profits However, any
increase only in the overbooking compensation would lead to decrease in profits(Taylor &
Cihon, 2014).
3) The Manager
30th April, 2019
Dear Sir
In order to understand the profitability of the given airline operations, Monte Carlo
simulation has been performed which indicates that an average profit of $ 20 is currently
being realised per passenger. This profit margin can potentially increase if the fares tend to
rise which is possible considering the robust demand leading to regular overbooking owing to
which compensation has to be at times provided by the company. The company should
increase the fare as it is possible that this would cause demand to reduce by small amount
owing to which the overbooking compensation would be decreased and higher reveuue would
be realised. The downside risk in the plan is the potential for the flight to not have 100%
7
0.05 0 5 0.15 0 0 Reservation Costs 79
0.11 =A2+B2 6 0.25 =E2+F2 1 Compensation 50
0.2 =A3+B3 7 0.26 =E3+F3 2 FC per flight 350
0.18 =A4+B4 8 0.23 =E4+F4 3
0.16 =A5+B5 9 0.11 =E5+F5 4
0.12 =A6+B6 10 =E6+F6
0.1 =A7+B7 11
0.08 =A8+B8 12
=B9+A9
MODEL RN Number Number Number Profit
Day RN Demand Demand No Shows no shows Seated Overbook Fare rev Comp. FC Per flight
1 =RAND() =VLOOKUP(B13,$B$2:$C$9,2,1) =RAND() =VLOOKUP(D13,$F$2:$G$6,2,1) =IF(C13-E13>=6,"6",C13-E13) =IF(C13-E13-$J$1<=0,"0",C13-E13-F13) =F13*$J$2 =G13*$J$3 =$J$4 =H13-I13-J13
2 =RAND() =VLOOKUP(B14,$B$2:$C$9,2,1) =RAND() =VLOOKUP(D14,$F$2:$G$6,2,1) =IF(C14-E14>=6,"6",C14-E14) =IF(C14-E14-$J$1<=0,"0",C14-E14-F14) =F14*$J$2 =G14*$J$3 =$J$4 =H14-I14-J14
3 =RAND() =VLOOKUP(B15,$B$2:$C$9,2,1) =RAND() =VLOOKUP(D15,$F$2:$G$6,2,1) =IF(C15-E15>=6,"6",C15-E15) =IF(C15-E15-$J$1<=0,"0",C15-E15-F15) =F15*$J$2 =G15*$J$3 =$J$4 =H15-I15-J15
4 =RAND() =VLOOKUP(B16,$B$2:$C$9,2,1) =RAND() =VLOOKUP(D16,$F$2:$G$6,2,1) =IF(C16-E16>=6,"6",C16-E16) =IF(C16-E16-$J$1<=0,"0",C16-E16-F16) =F16*$J$2 =G16*$J$3 =$J$4 =H16-I16-J16
5 =RAND() =VLOOKUP(B17,$B$2:$C$9,2,1) =RAND() =VLOOKUP(D17,$F$2:$G$6,2,1) =IF(C17-E17>=6,"6",C17-E17) =IF(C17-E17-$J$1<=0,"0",C17-E17-F17) =F17*$J$2 =G17*$J$3 =$J$4 =H17-I17-J17
6 =RAND() =VLOOKUP(B18,$B$2:$C$9,2,1) =RAND() =VLOOKUP(D18,$F$2:$G$6,2,1) =IF(C18-E18>=6,"6",C18-E18) =IF(C18-E18-$J$1<=0,"0",C18-E18-F18) =F18*$J$2 =G18*$J$3 =$J$4 =H18-I18-J18
7 =RAND() =VLOOKUP(B19,$B$2:$C$9,2,1) =RAND() =VLOOKUP(D19,$F$2:$G$6,2,1) =IF(C19-E19>=6,"6",C19-E19) =IF(C19-E19-$J$1<=0,"0",C19-E19-F19) =F19*$J$2 =G19*$J$3 =$J$4 =H19-I19-J19
8 =RAND() =VLOOKUP(B20,$B$2:$C$9,2,1) =RAND() =VLOOKUP(D20,$F$2:$G$6,2,1) =IF(C20-E20>=6,"6",C20-E20) =IF(C20-E20-$J$1<=0,"0",C20-E20-F20) =F20*$J$2 =G20*$J$3 =$J$4 =H20-I20-J20
9 =RAND() =VLOOKUP(B21,$B$2:$C$9,2,1) =RAND() =VLOOKUP(D21,$F$2:$G$6,2,1) =IF(C21-E21>=6,"6",C21-E21) =IF(C21-E21-$J$1<=0,"0",C21-E21-F21) =F21*$J$2 =G21*$J$3 =$J$4 =H21-I21-J21
10 =RAND() =VLOOKUP(B22,$B$2:$C$9,2,1) =RAND() =VLOOKUP(D22,$F$2:$G$6,2,1) =IF(C22-E22>=6,"6",C22-E22) =IF(C22-E22-$J$1<=0,"0",C22-E22-F22) =F22*$J$2 =G22*$J$3 =$J$4 =H22-I22-J22
11 =RAND() =VLOOKUP(B23,$B$2:$C$9,2,1) =RAND() =VLOOKUP(D23,$F$2:$G$6,2,1) =IF(C23-E23>=6,"6",C23-E23) =IF(C23-E23-$J$1<=0,"0",C23-E23-F23) =F23*$J$2 =G23*$J$3 =$J$4 =H23-I23-J23
12 =RAND() =VLOOKUP(B24,$B$2:$C$9,2,1) =RAND() =VLOOKUP(D24,$F$2:$G$6,2,1) =IF(C24-E24>=6,"6",C24-E24) =IF(C24-E24-$J$1<=0,"0",C24-E24-F24) =F24*$J$2 =G24*$J$3 =$J$4 =H24-I24-J24
13 =RAND() =VLOOKUP(B25,$B$2:$C$9,2,1) =RAND() =VLOOKUP(D25,$F$2:$G$6,2,1) =IF(C25-E25>=6,"6",C25-E25) =IF(C25-E25-$J$1<=0,"0",C25-E25-F25) =F25*$J$2 =G25*$J$3 =$J$4 =H25-I25-J25
14 =RAND() =VLOOKUP(B26,$B$2:$C$9,2,1) =RAND() =VLOOKUP(D26,$F$2:$G$6,2,1) =IF(C26-E26>=6,"6",C26-E26) =IF(C26-E26-$J$1<=0,"0",C26-E26-F26) =F26*$J$2 =G26*$J$3 =$J$4 =H26-I26-J26
15 =RAND() =VLOOKUP(B27,$B$2:$C$9,2,1) =RAND() =VLOOKUP(D27,$F$2:$G$6,2,1) =IF(C27-E27>=6,"6",C27-E27) =IF(C27-E27-$J$1<=0,"0",C27-E27-F27) =F27*$J$2 =G27*$J$3 =$J$4 =H27-I27-J27
16 =RAND() =VLOOKUP(B28,$B$2:$C$9,2,1) =RAND() =VLOOKUP(D28,$F$2:$G$6,2,1) =IF(C28-E28>=6,"6",C28-E28) =IF(C28-E28-$J$1<=0,"0",C28-E28-F28) =F28*$J$2 =G28*$J$3 =$J$4 =H28-I28-J28
17 =RAND() =VLOOKUP(B29,$B$2:$C$9,2,1) =RAND() =VLOOKUP(D29,$F$2:$G$6,2,1) =IF(C29-E29>=6,"6",C29-E29) =IF(C29-E29-$J$1<=0,"0",C29-E29-F29) =F29*$J$2 =G29*$J$3 =$J$4 =H29-I29-J29
18 =RAND() =VLOOKUP(B30,$B$2:$C$9,2,1) =RAND() =VLOOKUP(D30,$F$2:$G$6,2,1) =IF(C30-E30>=6,"6",C30-E30) =IF(C30-E30-$J$1<=0,"0",C30-E30-F30) =F30*$J$2 =G30*$J$3 =$J$4 =H30-I30-J30
19 =RAND() =VLOOKUP(B31,$B$2:$C$9,2,1) =RAND() =VLOOKUP(D31,$F$2:$G$6,2,1) =IF(C31-E31>=6,"6",C31-E31) =IF(C31-E31-$J$1<=0,"0",C31-E31-F31) =F31*$J$2 =G31*$J$3 =$J$4 =H31-I31-J31
20 =RAND() =VLOOKUP(B32,$B$2:$C$9,2,1) =RAND() =VLOOKUP(D32,$F$2:$G$6,2,1) =IF(C32-E32>=6,"6",C32-E32) =IF(C32-E32-$J$1<=0,"0",C32-E32-F32) =F32*$J$2 =G32*$J$3 =$J$4 =H32-I32-J32
21 =RAND() =VLOOKUP(B33,$B$2:$C$9,2,1) =RAND() =VLOOKUP(D33,$F$2:$G$6,2,1) =IF(C33-E33>=6,"6",C33-E33) =IF(C33-E33-$J$1<=0,"0",C33-E33-F33) =F33*$J$2 =G33*$J$3 =$J$4 =H33-I33-J33
22 =RAND() =VLOOKUP(B34,$B$2:$C$9,2,1) =RAND() =VLOOKUP(D34,$F$2:$G$6,2,1) =IF(C34-E34>=6,"6",C34-E34) =IF(C34-E34-$J$1<=0,"0",C34-E34-F34) =F34*$J$2 =G34*$J$3 =$J$4 =H34-I34-J34
23 =RAND() =VLOOKUP(B35,$B$2:$C$9,2,1) =RAND() =VLOOKUP(D35,$F$2:$G$6,2,1) =IF(C35-E35>=6,"6",C35-E35) =IF(C35-E35-$J$1<=0,"0",C35-E35-F35) =F35*$J$2 =G35*$J$3 =$J$4 =H35-I35-J35
24 =RAND() =VLOOKUP(B36,$B$2:$C$9,2,1) =RAND() =VLOOKUP(D36,$F$2:$G$6,2,1) =IF(C36-E36>=6,"6",C36-E36) =IF(C36-E36-$J$1<=0,"0",C36-E36-F36) =F36*$J$2 =G36*$J$3 =$J$4 =H36-I36-J36
25 =RAND() =VLOOKUP(B37,$B$2:$C$9,2,1) =RAND() =VLOOKUP(D37,$F$2:$G$6,2,1) =IF(C37-E37>=6,"6",C37-E37) =IF(C37-E37-$J$1<=0,"0",C37-E37-F37) =F37*$J$2 =G37*$J$3 =$J$4 =H37-I37-J37
26 =RAND() =VLOOKUP(B38,$B$2:$C$9,2,1) =RAND() =VLOOKUP(D38,$F$2:$G$6,2,1) =IF(C38-E38>=6,"6",C38-E38) =IF(C38-E38-$J$1<=0,"0",C38-E38-F38) =F38*$J$2 =G38*$J$3 =$J$4 =H38-I38-J38
27 =RAND() =VLOOKUP(B39,$B$2:$C$9,2,1) =RAND() =VLOOKUP(D39,$F$2:$G$6,2,1) =IF(C39-E39>=6,"6",C39-E39) =IF(C39-E39-$J$1<=0,"0",C39-E39-F39) =F39*$J$2 =G39*$J$3 =$J$4 =H39-I39-J39
28 =RAND() =VLOOKUP(B40,$B$2:$C$9,2,1) =RAND() =VLOOKUP(D40,$F$2:$G$6,2,1) =IF(C40-E40>=6,"6",C40-E40) =IF(C40-E40-$J$1<=0,"0",C40-E40-F40) =F40*$J$2 =G40*$J$3 =$J$4 =H40-I40-J40
29 =RAND() =VLOOKUP(B41,$B$2:$C$9,2,1) =RAND() =VLOOKUP(D41,$F$2:$G$6,2,1) =IF(C41-E41>=6,"6",C41-E41) =IF(C41-E41-$J$1<=0,"0",C41-E41-F41) =F41*$J$2 =G41*$J$3 =$J$4 =H41-I41-J41
30 =RAND() =VLOOKUP(B42,$B$2:$C$9,2,1) =RAND() =VLOOKUP(D42,$F$2:$G$6,2,1) =IF(C42-E42>=6,"6",C42-E42) =IF(C42-E42-$J$1<=0,"0",C42-E42-F42) =F42*$J$2 =G42*$J$3 =$J$4 =H42-I42-J42
Avg. Profit =AVERAGE(K13:K42)
Average profit per flight comes out to be $20.
2) With regards to variation in the fare, any increase in the fare has a significant improvement
in the profits per passenger. However, it is essential that the same should be realised without
any increase in the compensation provided for overbooking. If both the fares and the
compensation overbooking tend to increase by the same amount, then also the simulation
highlights that there would be some improvement in the overall profits However, any
increase only in the overbooking compensation would lead to decrease in profits(Taylor &
Cihon, 2014).
3) The Manager
30th April, 2019
Dear Sir
In order to understand the profitability of the given airline operations, Monte Carlo
simulation has been performed which indicates that an average profit of $ 20 is currently
being realised per passenger. This profit margin can potentially increase if the fares tend to
rise which is possible considering the robust demand leading to regular overbooking owing to
which compensation has to be at times provided by the company. The company should
increase the fare as it is possible that this would cause demand to reduce by small amount
owing to which the overbooking compensation would be decreased and higher reveuue would
be realised. The downside risk in the plan is the potential for the flight to not have 100%
7
Paraphrase This Document
Need a fresh take? Get an instant paraphrase of this document with our AI Paraphraser
occupancy owing to higher fares. However, this risk is considerably less as the demand is
robust which makes it unlikely for demand to be lower than 6 passengers on any given
day(Hastie, Tibshirani & Friedman, 2016).
Yours Sincerely
STUDENT NAME
Question 4
(1) Regression model
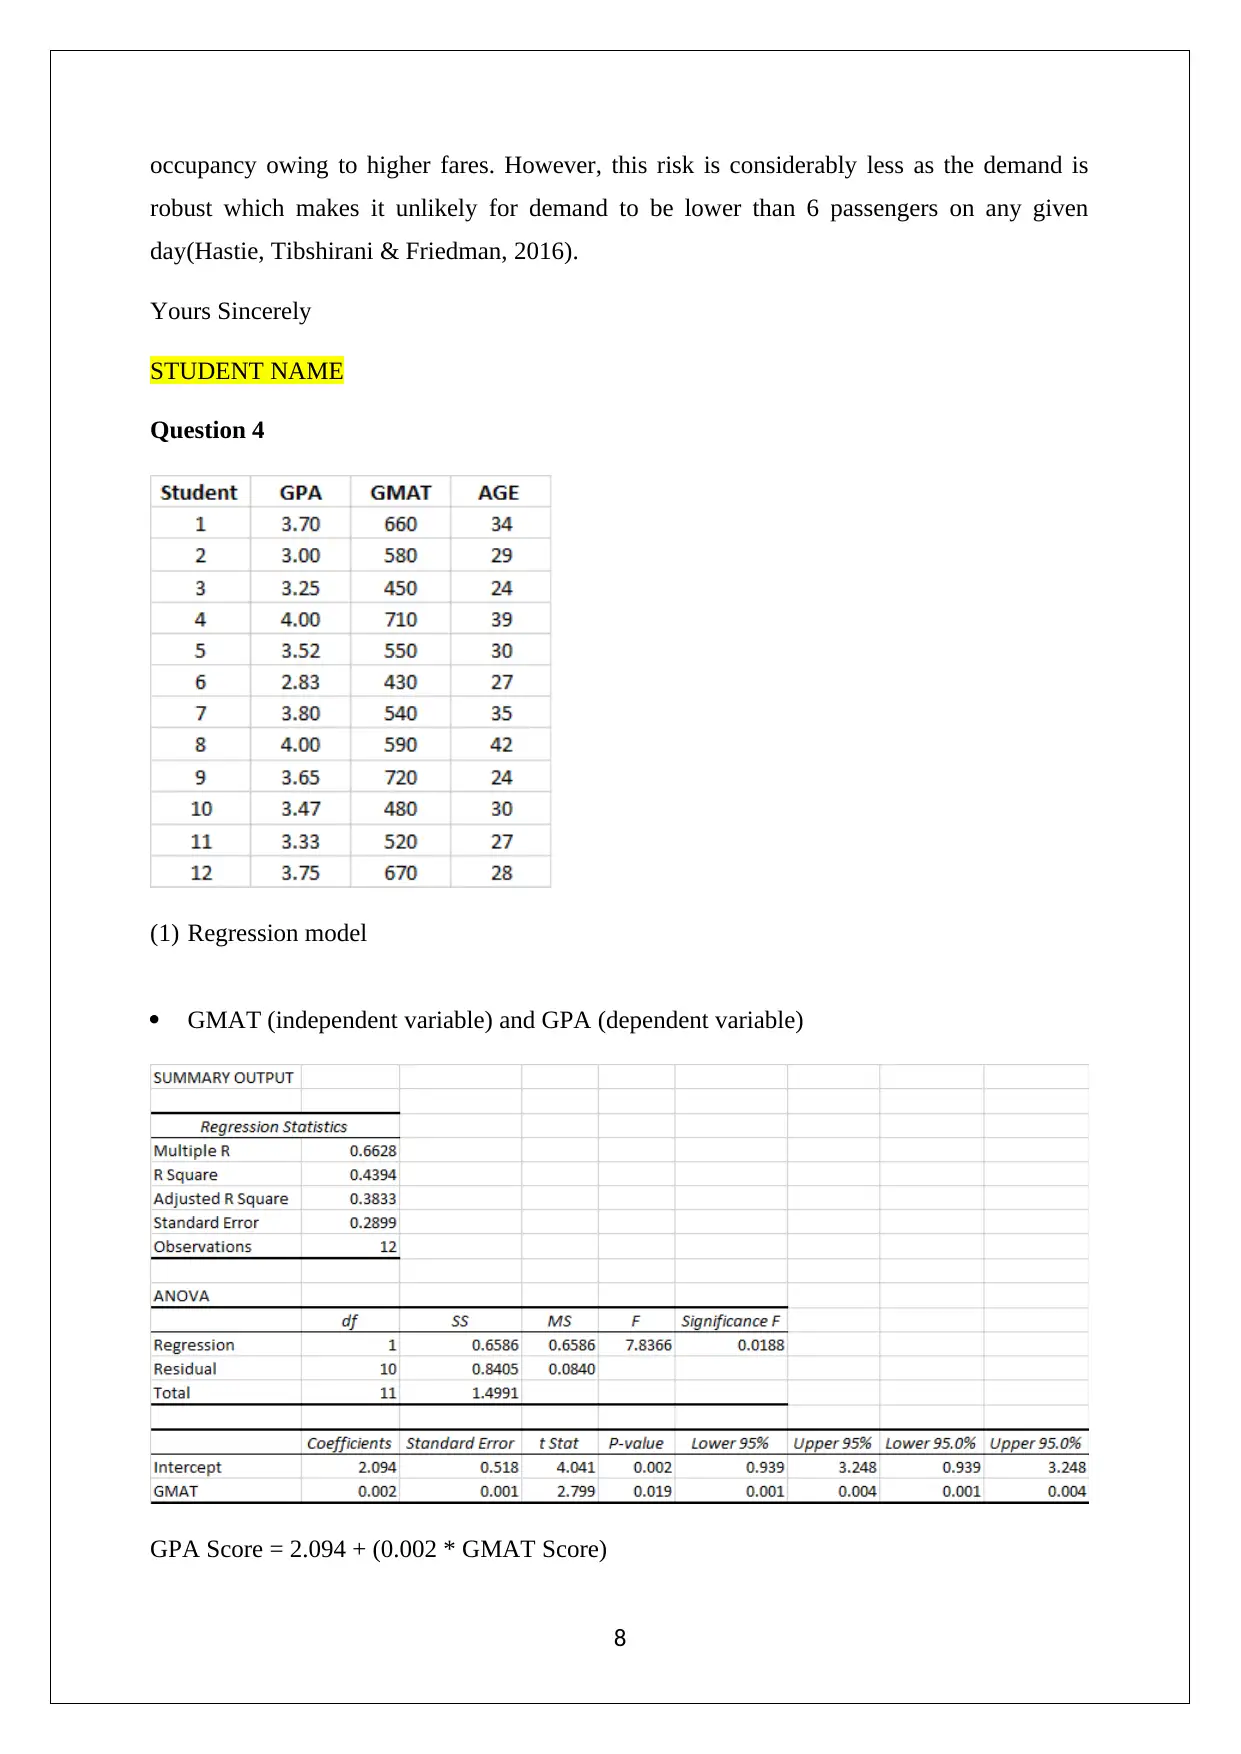
GMAT (independent variable) and GPA (dependent variable)
GPA Score = 2.094 + (0.002 * GMAT Score)
8
robust which makes it unlikely for demand to be lower than 6 passengers on any given
day(Hastie, Tibshirani & Friedman, 2016).
Yours Sincerely
STUDENT NAME
Question 4
(1) Regression model
GMAT (independent variable) and GPA (dependent variable)
GPA Score = 2.094 + (0.002 * GMAT Score)
8
Assuming a significance level of 5%, it can be said that the slope coefficient is statistically
significant because the p value is lower than the significance level. Further, the R square
value comes out to be 0.4394 which is lower than 0.5 which implies that only 43.94%
variation in GPA score is explained by the variation in GMAT score. It also implies that rest
56.06% of variation in GPA is described through other variables which would need to be
introduced to improve predictive power (Lind, Marchal & Wathen, 2016).
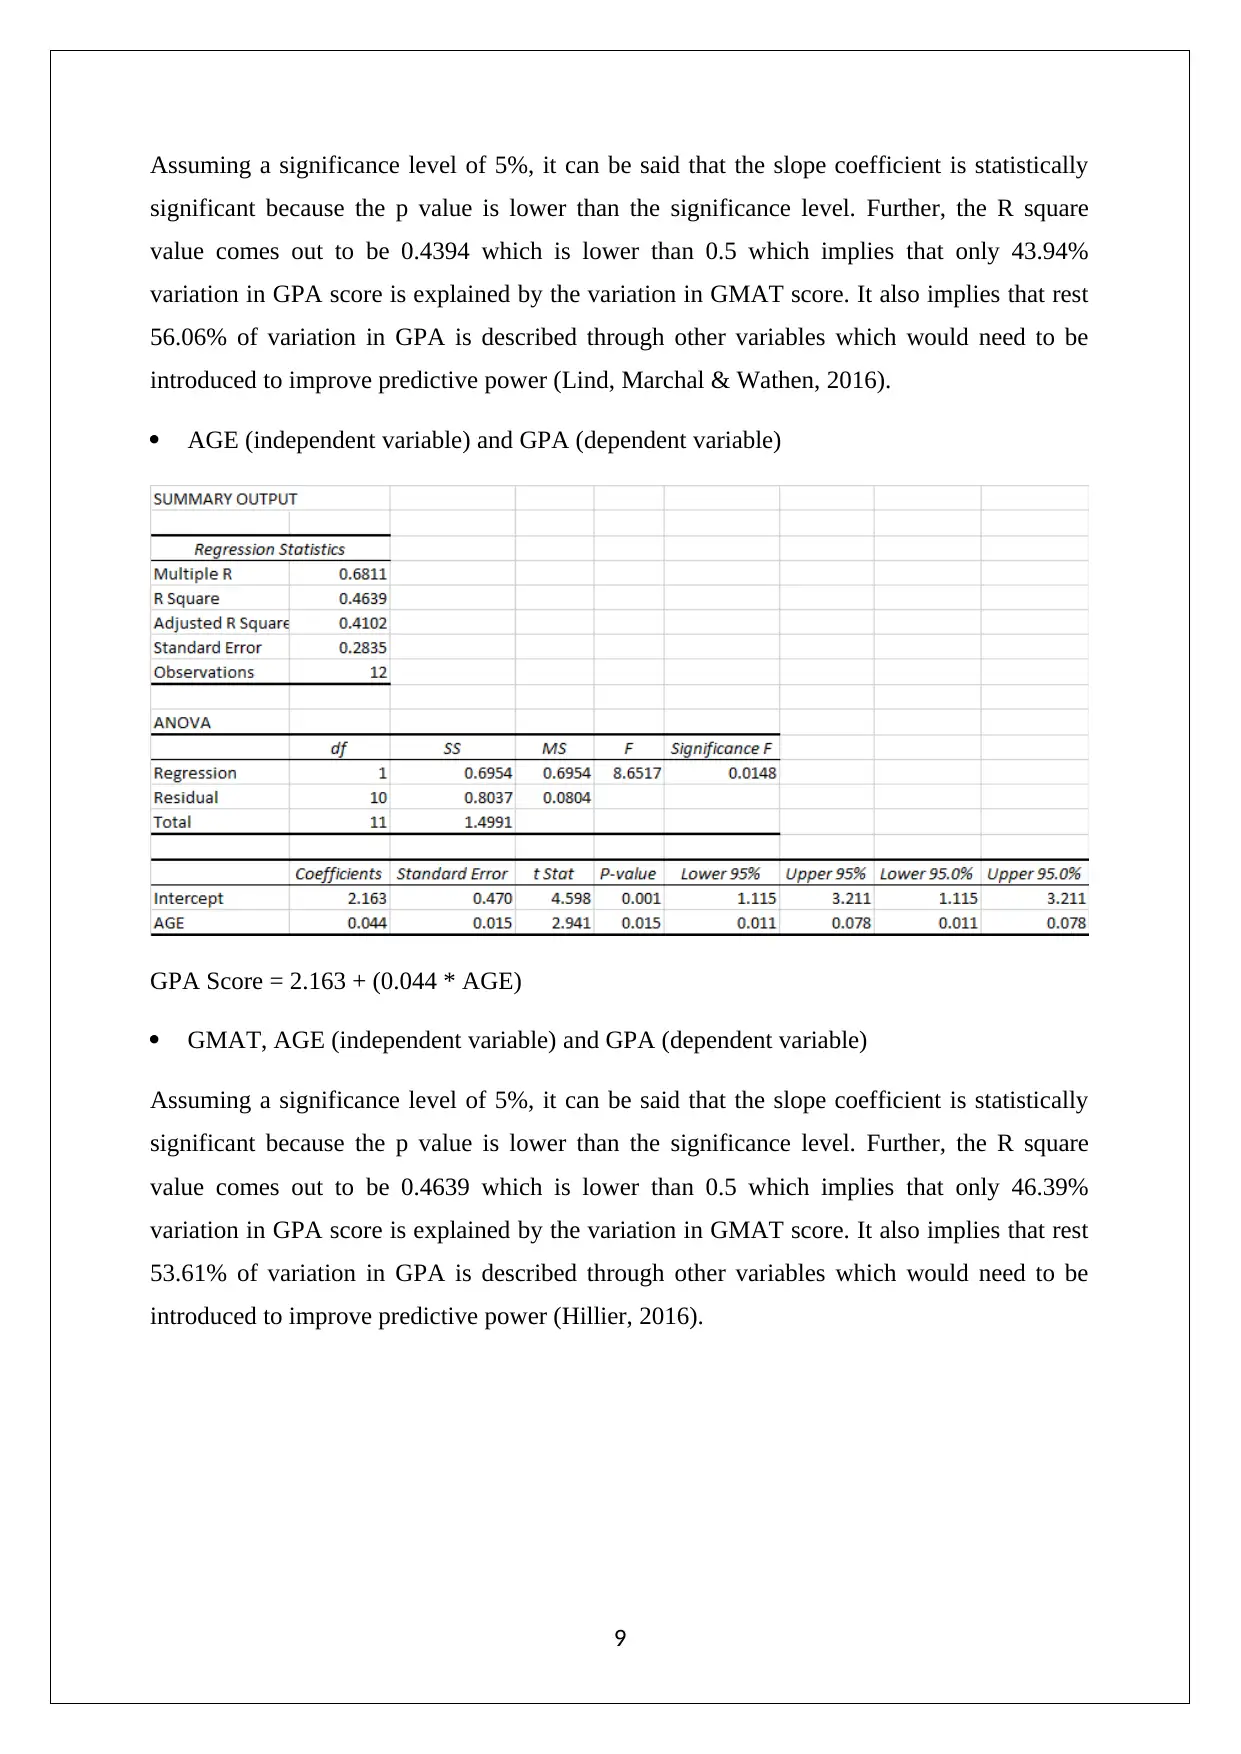
AGE (independent variable) and GPA (dependent variable)
GPA Score = 2.163 + (0.044 * AGE)
GMAT, AGE (independent variable) and GPA (dependent variable)
Assuming a significance level of 5%, it can be said that the slope coefficient is statistically
significant because the p value is lower than the significance level. Further, the R square
value comes out to be 0.4639 which is lower than 0.5 which implies that only 46.39%
variation in GPA score is explained by the variation in GMAT score. It also implies that rest
53.61% of variation in GPA is described through other variables which would need to be
introduced to improve predictive power (Hillier, 2016).
9
significant because the p value is lower than the significance level. Further, the R square
value comes out to be 0.4394 which is lower than 0.5 which implies that only 43.94%
variation in GPA score is explained by the variation in GMAT score. It also implies that rest
56.06% of variation in GPA is described through other variables which would need to be
introduced to improve predictive power (Lind, Marchal & Wathen, 2016).
AGE (independent variable) and GPA (dependent variable)
GPA Score = 2.163 + (0.044 * AGE)
GMAT, AGE (independent variable) and GPA (dependent variable)
Assuming a significance level of 5%, it can be said that the slope coefficient is statistically
significant because the p value is lower than the significance level. Further, the R square
value comes out to be 0.4639 which is lower than 0.5 which implies that only 46.39%
variation in GPA score is explained by the variation in GMAT score. It also implies that rest
53.61% of variation in GPA is described through other variables which would need to be
introduced to improve predictive power (Hillier, 2016).
9
⊘ This is a preview!⊘
Do you want full access?
Subscribe today to unlock all pages.
Trusted by 1+ million students worldwide
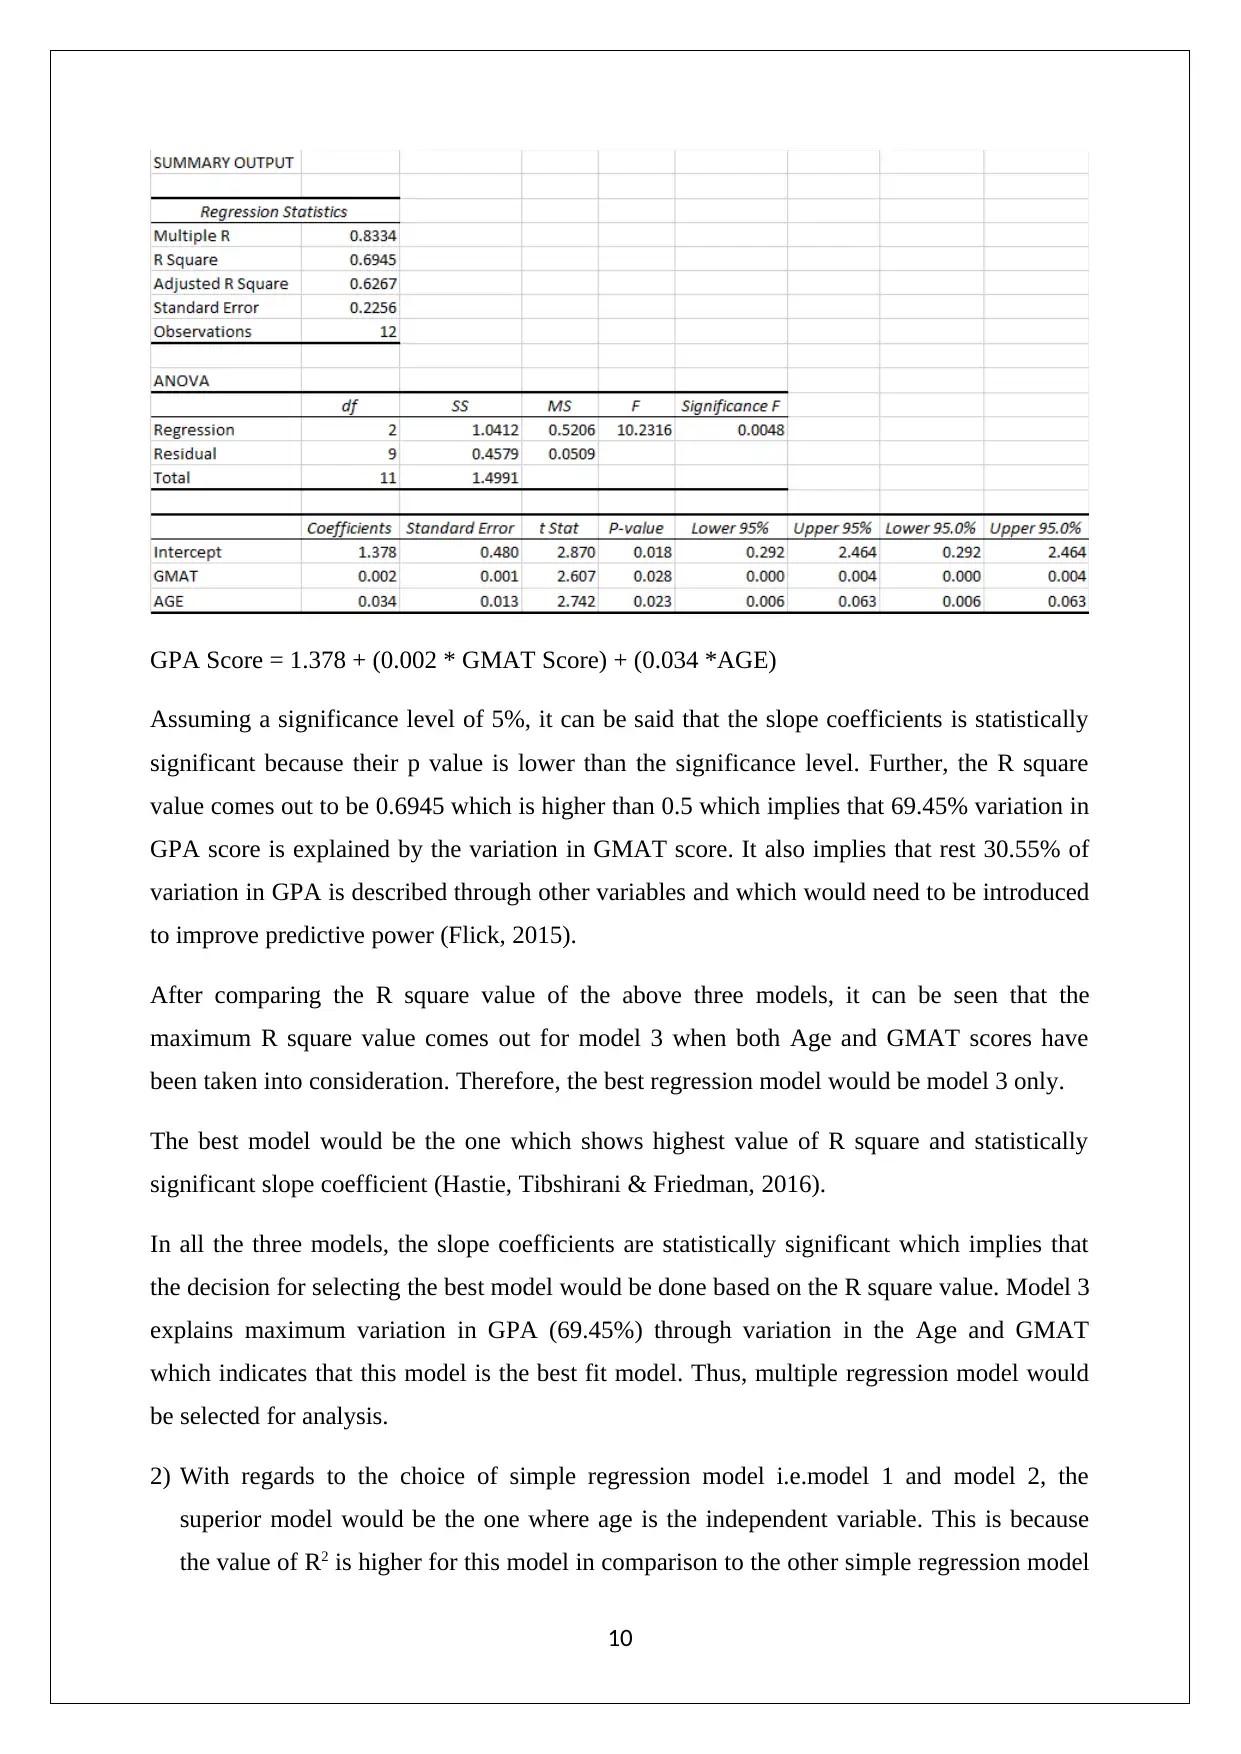
GPA Score = 1.378 + (0.002 * GMAT Score) + (0.034 *AGE)
Assuming a significance level of 5%, it can be said that the slope coefficients is statistically
significant because their p value is lower than the significance level. Further, the R square
value comes out to be 0.6945 which is higher than 0.5 which implies that 69.45% variation in
GPA score is explained by the variation in GMAT score. It also implies that rest 30.55% of
variation in GPA is described through other variables and which would need to be introduced
to improve predictive power (Flick, 2015).
After comparing the R square value of the above three models, it can be seen that the
maximum R square value comes out for model 3 when both Age and GMAT scores have
been taken into consideration. Therefore, the best regression model would be model 3 only.
The best model would be the one which shows highest value of R square and statistically
significant slope coefficient (Hastie, Tibshirani & Friedman, 2016).
In all the three models, the slope coefficients are statistically significant which implies that
the decision for selecting the best model would be done based on the R square value. Model 3
explains maximum variation in GPA (69.45%) through variation in the Age and GMAT
which indicates that this model is the best fit model. Thus, multiple regression model would
be selected for analysis.
2) With regards to the choice of simple regression model i.e.model 1 and model 2, the
superior model would be the one where age is the independent variable. This is because
the value of R2 is higher for this model in comparison to the other simple regression model
10
Paraphrase This Document
Need a fresh take? Get an instant paraphrase of this document with our AI Paraphraser
where GMAT is used as the independent variable. Further, the p value of the slope
coefficient is lower for age than GMAT making the former slope more significant (Flick,
2015).
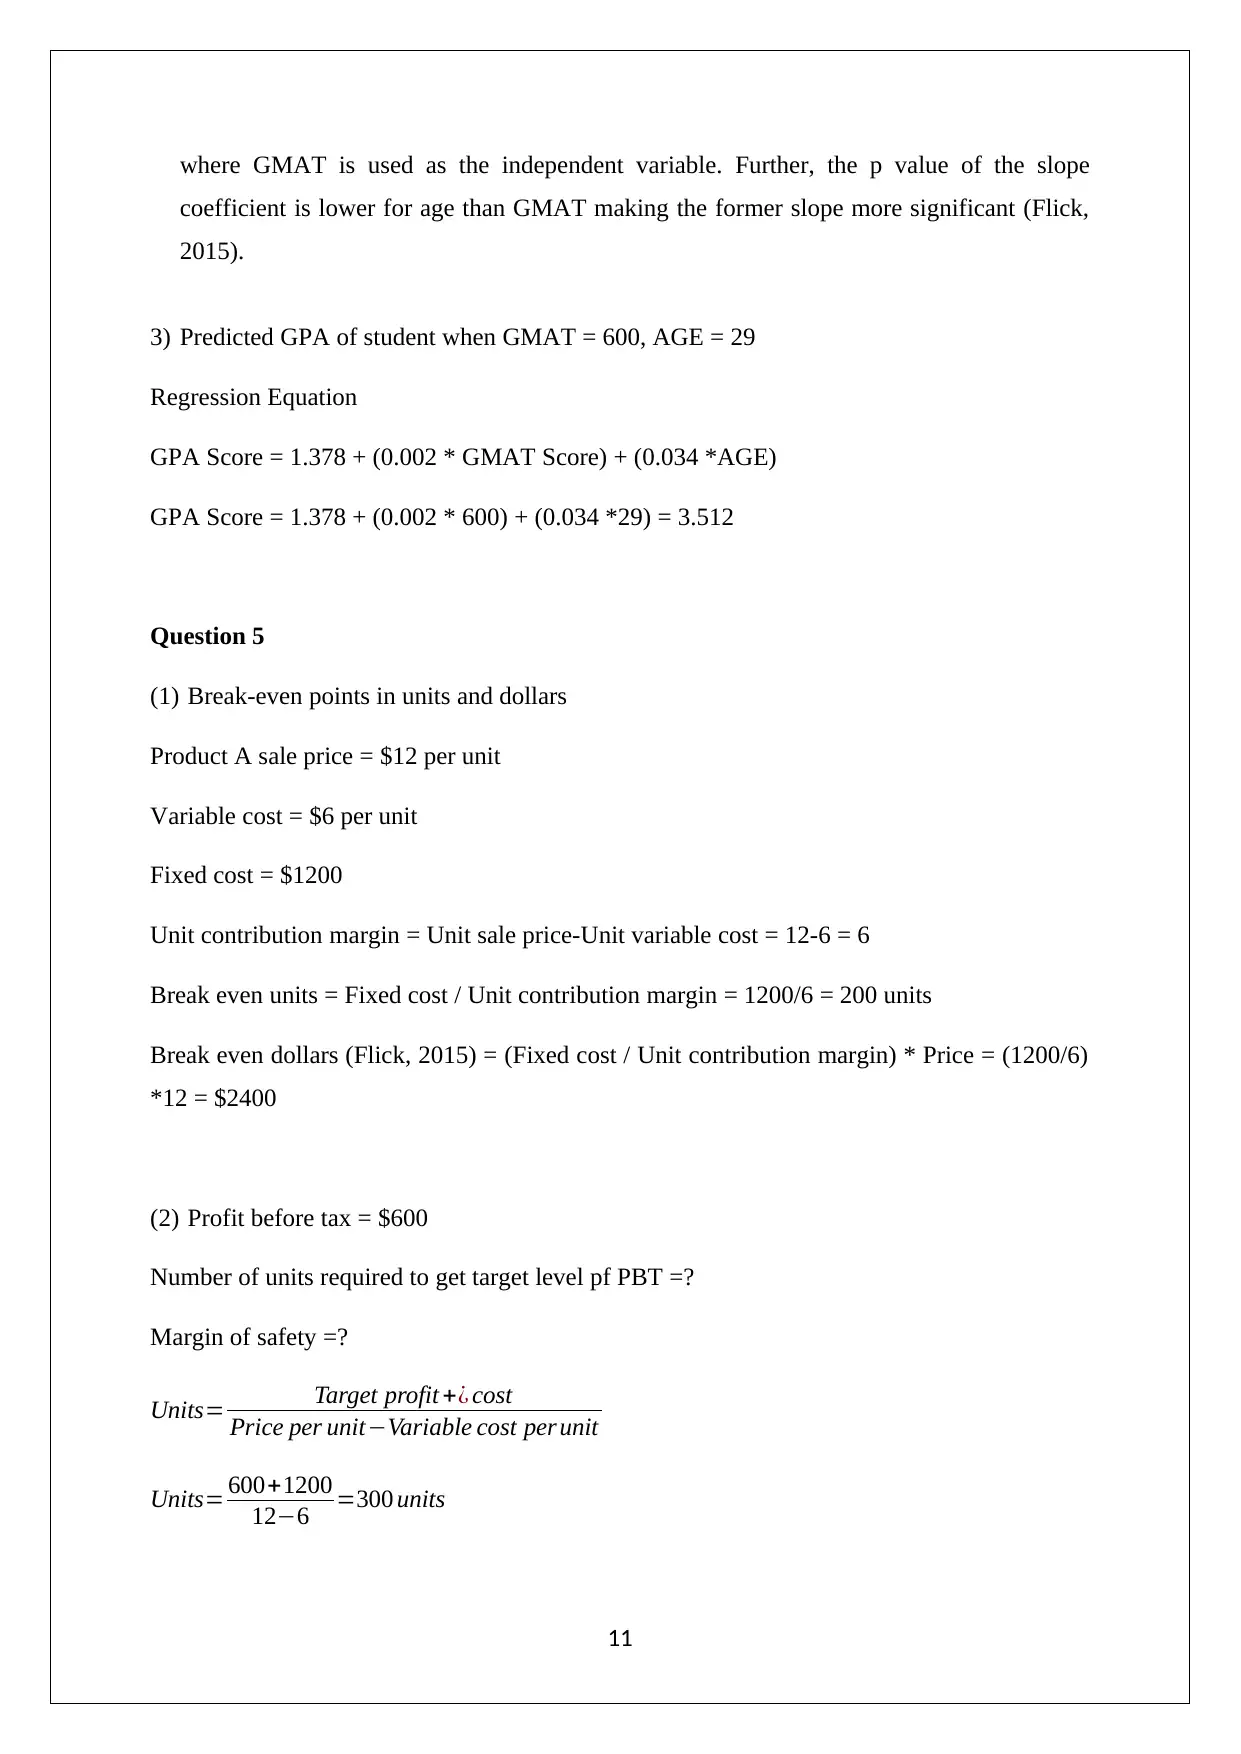
3) Predicted GPA of student when GMAT = 600, AGE = 29
Regression Equation
GPA Score = 1.378 + (0.002 * GMAT Score) + (0.034 *AGE)
GPA Score = 1.378 + (0.002 * 600) + (0.034 *29) = 3.512
Question 5
(1) Break-even points in units and dollars
Product A sale price = $12 per unit
Variable cost = $6 per unit
Fixed cost = $1200
Unit contribution margin = Unit sale price-Unit variable cost = 12-6 = 6
Break even units = Fixed cost / Unit contribution margin = 1200/6 = 200 units
Break even dollars (Flick, 2015) = (Fixed cost / Unit contribution margin) * Price = (1200/6)
*12 = $2400
(2) Profit before tax = $600
Number of units required to get target level pf PBT =?
Margin of safety =?
Units= Target profit +¿ cost
Price per unit−Variable cost per unit
Units= 600+1200
12−6 =300 units
11
coefficient is lower for age than GMAT making the former slope more significant (Flick,
2015).
3) Predicted GPA of student when GMAT = 600, AGE = 29
Regression Equation
GPA Score = 1.378 + (0.002 * GMAT Score) + (0.034 *AGE)
GPA Score = 1.378 + (0.002 * 600) + (0.034 *29) = 3.512
Question 5
(1) Break-even points in units and dollars
Product A sale price = $12 per unit
Variable cost = $6 per unit
Fixed cost = $1200
Unit contribution margin = Unit sale price-Unit variable cost = 12-6 = 6
Break even units = Fixed cost / Unit contribution margin = 1200/6 = 200 units
Break even dollars (Flick, 2015) = (Fixed cost / Unit contribution margin) * Price = (1200/6)
*12 = $2400
(2) Profit before tax = $600
Number of units required to get target level pf PBT =?
Margin of safety =?
Units= Target profit +¿ cost
Price per unit−Variable cost per unit
Units= 600+1200
12−6 =300 units
11
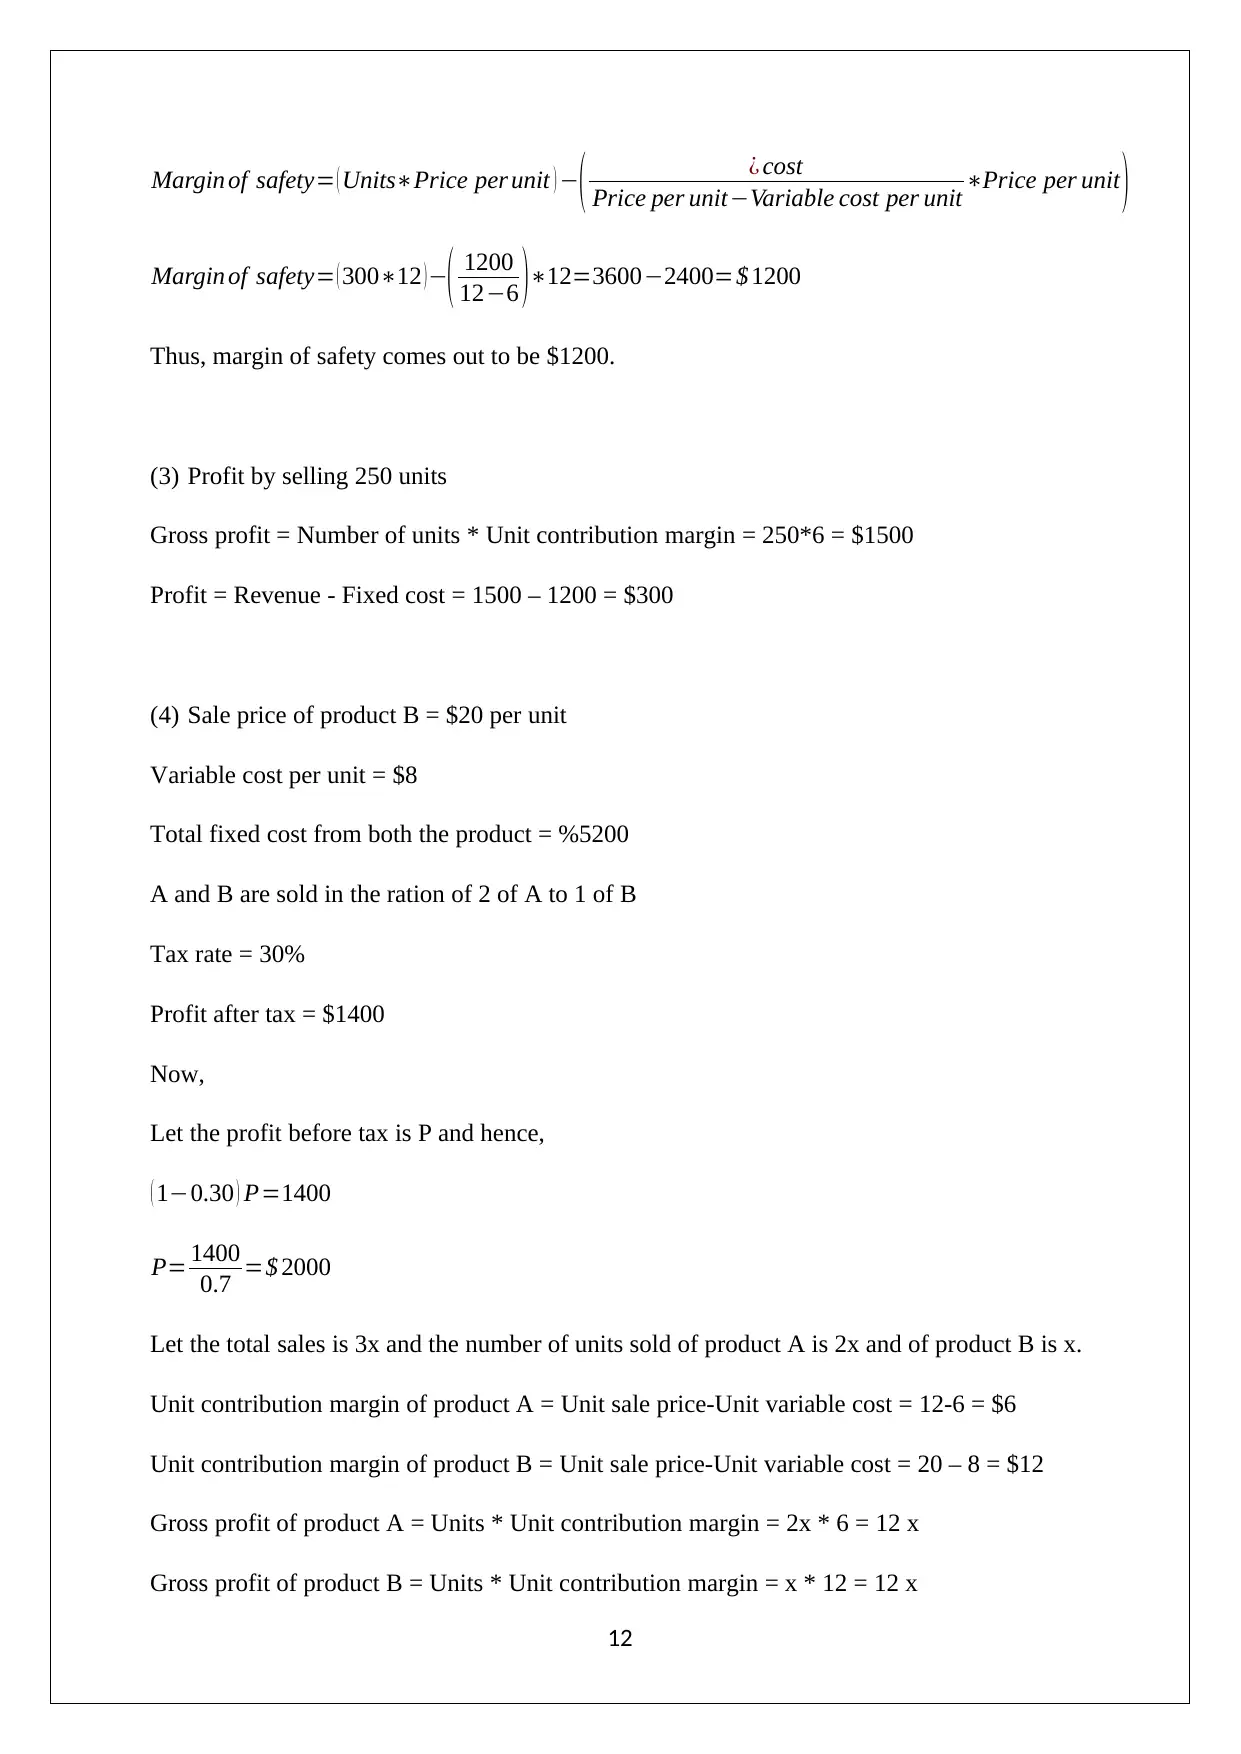
Margin of safety= ( Units∗Price per unit ) −( ¿ cost
Price per unit−Variable cost per unit ∗Price per unit )
Margin of safety= ( 300∗12 )−( 1200
12−6 )∗12=3600−2400=$ 1200
Thus, margin of safety comes out to be $1200.
(3) Profit by selling 250 units
Gross profit = Number of units * Unit contribution margin = 250*6 = $1500
Profit = Revenue - Fixed cost = 1500 – 1200 = $300
(4) Sale price of product B = $20 per unit
Variable cost per unit = $8
Total fixed cost from both the product = %5200
A and B are sold in the ration of 2 of A to 1 of B
Tax rate = 30%
Profit after tax = $1400
Now,
Let the profit before tax is P and hence,
( 1−0.30 ) P=1400
P= 1400
0.7 =$ 2000
Let the total sales is 3x and the number of units sold of product A is 2x and of product B is x.
Unit contribution margin of product A = Unit sale price-Unit variable cost = 12-6 = $6
Unit contribution margin of product B = Unit sale price-Unit variable cost = 20 – 8 = $12
Gross profit of product A = Units * Unit contribution margin = 2x * 6 = 12 x
Gross profit of product B = Units * Unit contribution margin = x * 12 = 12 x
12
⊘ This is a preview!⊘
Do you want full access?
Subscribe today to unlock all pages.
Trusted by 1+ million students worldwide
1 out of 14
Related Documents


Your All-in-One AI-Powered Toolkit for Academic Success.
+13062052269
info@desklib.com
Available 24*7 on WhatsApp / Email
![[object Object]](/_next/static/media/star-bottom.7253800d.svg)
Unlock your academic potential
Copyright © 2020–2026 A2Z Services. All Rights Reserved. Developed and managed by ZUCOL.