Defining and Collecting Data Analysis
Added on 2022-09-09
11 Pages1156 Words18 Views
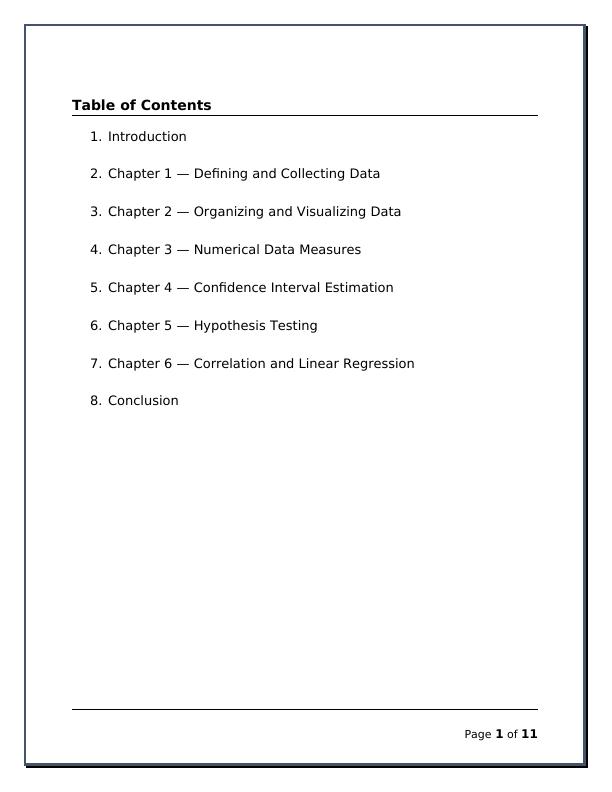
Table of Contents
1. Introduction
2. Chapter 1 — Defining and Collecting Data
3. Chapter 2 — Organizing and Visualizing Data
4. Chapter 3 — Numerical Data Measures
5. Chapter 4 — Confidence Interval Estimation
6. Chapter 5 — Hypothesis Testing
7. Chapter 6 — Correlation and Linear Regression
8. Conclusion
Page 1 of 11
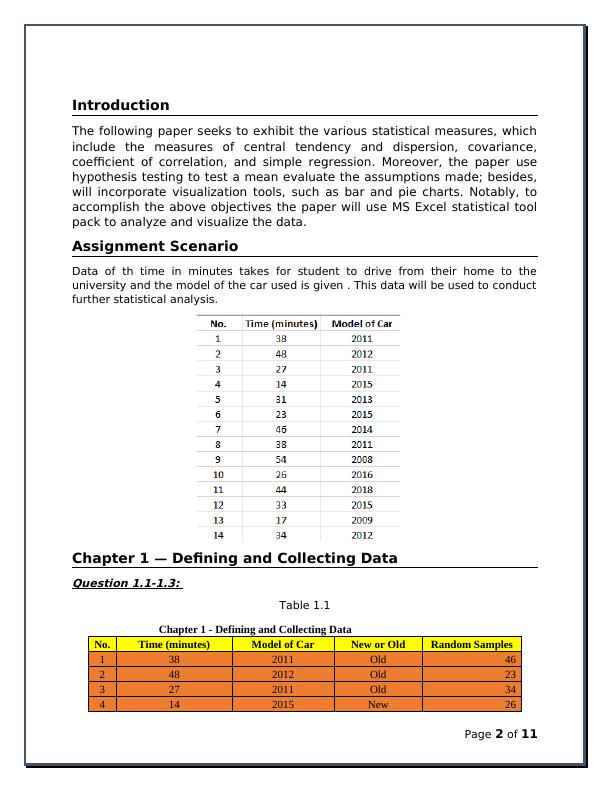
Introduction
The following paper seeks to exhibit the various statistical measures, which
include the measures of central tendency and dispersion, covariance,
coefficient of correlation, and simple regression. Moreover, the paper use
hypothesis testing to test a mean evaluate the assumptions made; besides,
will incorporate visualization tools, such as bar and pie charts. Notably, to
accomplish the above objectives the paper will use MS Excel statistical tool
pack to analyze and visualize the data.
Assignment Scenario
Data of th time in minutes takes for student to drive from their home to the
university and the model of the car used is given . This data will be used to conduct
further statistical analysis.
Chapter 1 — Defining and Collecting DataQuestion 1.1-1.3:
Table 1.1
Chapter 1 - Defining and Collecting Data
No. Time (minutes) Model of Car New or Old Random Samples
1 38 2011 Old 46
2 48 2012 Old 23
3 27 2011 Old 34
4 14 2015 New 26
Page 2 of 11
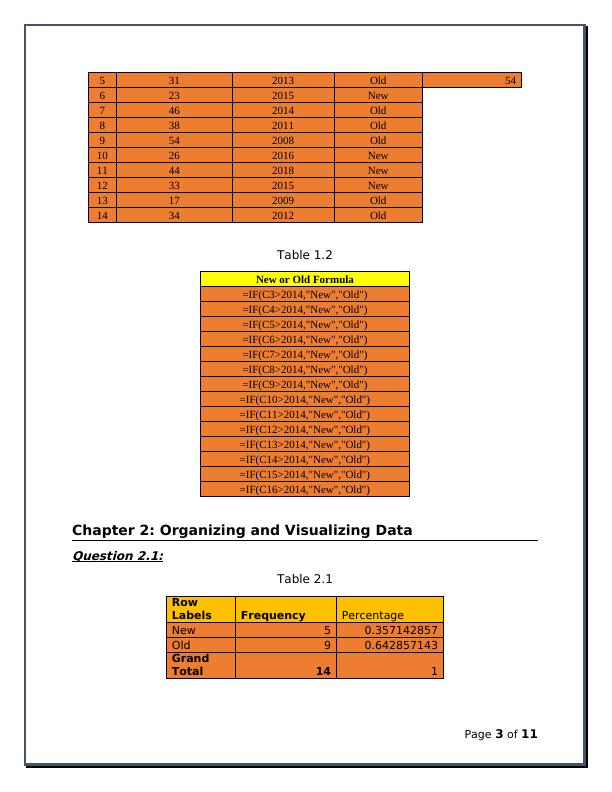
5 31 2013 Old 54
6 23 2015 New
7 46 2014 Old
8 38 2011 Old
9 54 2008 Old
10 26 2016 New
11 44 2018 New
12 33 2015 New
13 17 2009 Old
14 34 2012 Old
Table 1.2
New or Old Formula
=IF(C3>2014,"New","Old")
=IF(C4>2014,"New","Old")
=IF(C5>2014,"New","Old")
=IF(C6>2014,"New","Old")
=IF(C7>2014,"New","Old")
=IF(C8>2014,"New","Old")
=IF(C9>2014,"New","Old")
=IF(C10>2014,"New","Old")
=IF(C11>2014,"New","Old")
=IF(C12>2014,"New","Old")
=IF(C13>2014,"New","Old")
=IF(C14>2014,"New","Old")
=IF(C15>2014,"New","Old")
=IF(C16>2014,"New","Old")
Chapter 2: Organizing and Visualizing DataQuestion 2.1:
Table 2.1
Row
Labels Frequency Percentage
New 5 0.357142857
Old 9 0.642857143
Grand
Total 14 1
Page 3 of 11
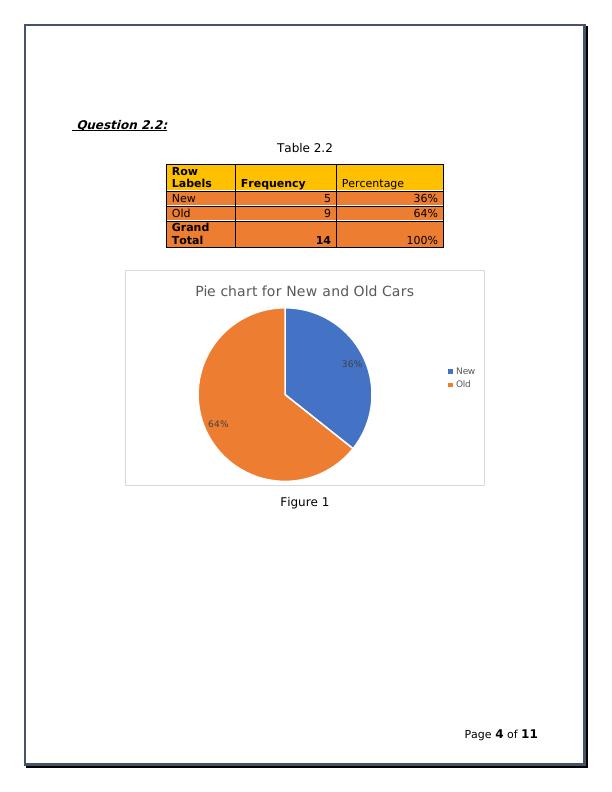
Question 2.2:
Table 2.2
Row
Labels Frequency Percentage
New 5 36%
Old 9 64%
Grand
Total 14 100%
36%
64%
Pie chart for New and Old Cars
New
Old
Figure 1
Page 4 of 11
Table 2.2
Row
Labels Frequency Percentage
New 5 36%
Old 9 64%
Grand
Total 14 100%
36%
64%
Pie chart for New and Old Cars
New
Old
Figure 1
Page 4 of 11
End of preview
Want to access all the pages? Upload your documents or become a member.