Comprehensive Demographic Analysis of East Asia and Pacific Countries
VerifiedAdded on 2020/05/04
|19
|4001
|64
Report
AI Summary
This report provides a comprehensive demographic analysis of East Asia and Pacific countries using World Bank data from 2001 to 2015. It examines various socio-economic and health-related factors, including adolescent fertility rates, life expectancy, unemployment, and health expenditures. The analysis includes exploratory data analysis, one-variable and two-variable analyses, and advanced techniques such as K-means cluster analysis and linear regression. The report presents findings through scatter diagrams, box plots, and matrix plots, offering insights into the relationships between different demographic variables. Furthermore, the report discusses the results of clustering and linear regression analyses, drawing conclusions about the health and population trends in the region. The student's reflections and an annotated bibliography are also included.

Running head: DEMOGRAPHIC ANALYSIS OF EAST ASIA AND PACIFIC COUNTRIES
Demographic Analysis of East Asia and Pacific Countries
Name of the Student:
Name of the University:
Author’s Note:
Demographic Analysis of East Asia and Pacific Countries
Name of the Student:
Name of the University:
Author’s Note:
Paraphrase This Document
Need a fresh take? Get an instant paraphrase of this document with our AI Paraphraser
DEMOGRAPHIC ANALYSIS OF EAST ASIA AND PACIFIC COUNTRIES
Executive Summary
The World Bank dataset on health and population data gives the different socio-economic factors of the countries of East Asia and pacific
region. The report elaborates the different aspects health infrastructure, socio-economic condition and demographic situation of that
particular country. Report helps to analyze data, decide a conclusion and perform many statistical or mathematical calculations with various
statistical packages. The report is the mirror of demographic overview of East Asian and Pacific counties from 2001 to 2015. More of it, the
report provides the views, thoughts of report writer and Analyst. We provided the theoretical discussions on linear regression and k-means
cluster analysis for clarification of the result. More of all, necessary tables, plots and calculations were supplied for the data interpretation and
conclusions.
DEMOGRAPHIC ANALYSIS OF EAST ASIA AND PACIFIC COUNTRIES
Table of Contents
Introduction:............................................................................................................................................................................................................. 3
Data Setup:................................................................................................................................................................................................................ 3
Exploratory Data Analysis:........................................................................................................................................................................................ 3
One Variable Analysis:........................................................................................................................................................................................... 3
1. Adolescent fertility rate (births per 1,000 women ages 15-19).....................................................................................................................3
2. Life expectancy at birth, total (years):........................................................................................................................................................... 4
3. Unemployment, total (% of total labor force):.............................................................................................................................................. 5
Two Variable Analyses:......................................................................................................................................................................................... 7
1. Health expenditure, private (% of GDP) vs. Health expenditure, public (% of GDP):-...................................................................................7
2. Crude Birth Rate (per 1000 people) and Crude Death Rate (per 1000 people):-...........................................................................................8
Advanced Analysis:.................................................................................................................................................................................................. 10
Cluster Analysis of K-means:............................................................................................................................................................................... 10
Discussion:....................................................................................................................................................................................................... 10
Result of Clustering:........................................................................................................................................................................................ 10
Linear Regression:............................................................................................................................................................................................... 11
Discussion:....................................................................................................................................................................................................... 11
Results of Linear Regression Analysis:............................................................................................................................................................. 12
Conclusion:.............................................................................................................................................................................................................. 14
Reflections:............................................................................................................................................................................................................. 15
R codes for box plot and clustering method:-..................................................................................................................................................... 15
Annotated Bibliography:......................................................................................................................................................................................... 16
⊘ This is a preview!⊘
Do you want full access?
Subscribe today to unlock all pages.
Trusted by 1+ million students worldwide
DEMOGRAPHIC ANALYSIS OF EAST ASIA AND PACIFIC COUNTRIES
Introduction:
Health and Population study is a crucial issue with respect to a country’s behavior, epidemiological aspects, standard of living of the
people and future prediction of coming years. Different kinds of factors as Crude Birth Rate, Fertility rate, Death Rate, Mortality rate, Death
due to injury, give the clear view of that country’s heath situation. Heath expenditures in various sectors describe the infrastructural
orientation of health service of a country. The countries that are facing eco-social problems in their day-to-day life could get help from the
overview of the data and attempt to resolve the situation. The betterment of economic condition, population oriented and infrastructure of
health service can make a country better. Demographic status is the proper indicator of improvement of a country.
The analysis of health and population data collected from World Bank of health study organization elaborates the health situation of
several countries with respect to occupation, gender, education and health infrastructure of East Asian and pacific countries from 2001 to
2015. In a few variables, 2015 data is missing; therefore, we only take 2001-2014 in these attributes.
This report develops an idea about how problems in heath sector increases for high rates of some factors and low rates of some factors
in following segments. It also tells about country wise distribution of various factors. The report provides the necessary graphs and calculations
as per needed.
Data Setup:
The data is loaded in excel as preference to analyst. Analyst sorted the huge collection of data from 1960 to 2016 to a level of 2001-
2015. He used the software package R and MS excel to analyze the dataset of corresponding countries.
Analyst installed ‘MASS’, ‘Rcmdr’ and ‘cluster’ packages in R software to fit box plots and cluster analysis. Besides, we used the Minitab
and MS excel to analyze the data.
Each parameter of the datasets is dependent upon Income rate of that country. The demographic indicators of the sorted data have
come from the same region but different countries. We mainly took seven variables and they are – Crude death rate (per 1000 people), Crude
birth rate (per 1000 people), Public healthcare expenses (% of total gdp), Private healthcare expenses (% of total gdp), Adolescent fertility rate
(births per 1,000 women ages 15-19), Life expectancy at birth, total (years), Unemployment, total (% of total labor force).
Paraphrase This Document
Need a fresh take? Get an instant paraphrase of this document with our AI Paraphraser
DEMOGRAPHIC ANALYSIS OF EAST ASIA AND PACIFIC COUNTRIES
Exploratory Data Analysis:
One Variable Analysis:
1. Adolescent fertility rate (births per 1,000 women ages 15-19)
0 5 10 15 20 25 30
0
10
20
30
40
50
60
70
80
90
Year-2001
Year-2002
Year-2003
Year-2004
Year-2005
Year-2006
Year-2007
Year-2008
Year-2009
Year-2010
Year-2011
Year-2012
Year-2013
Year-2014
Year-2015
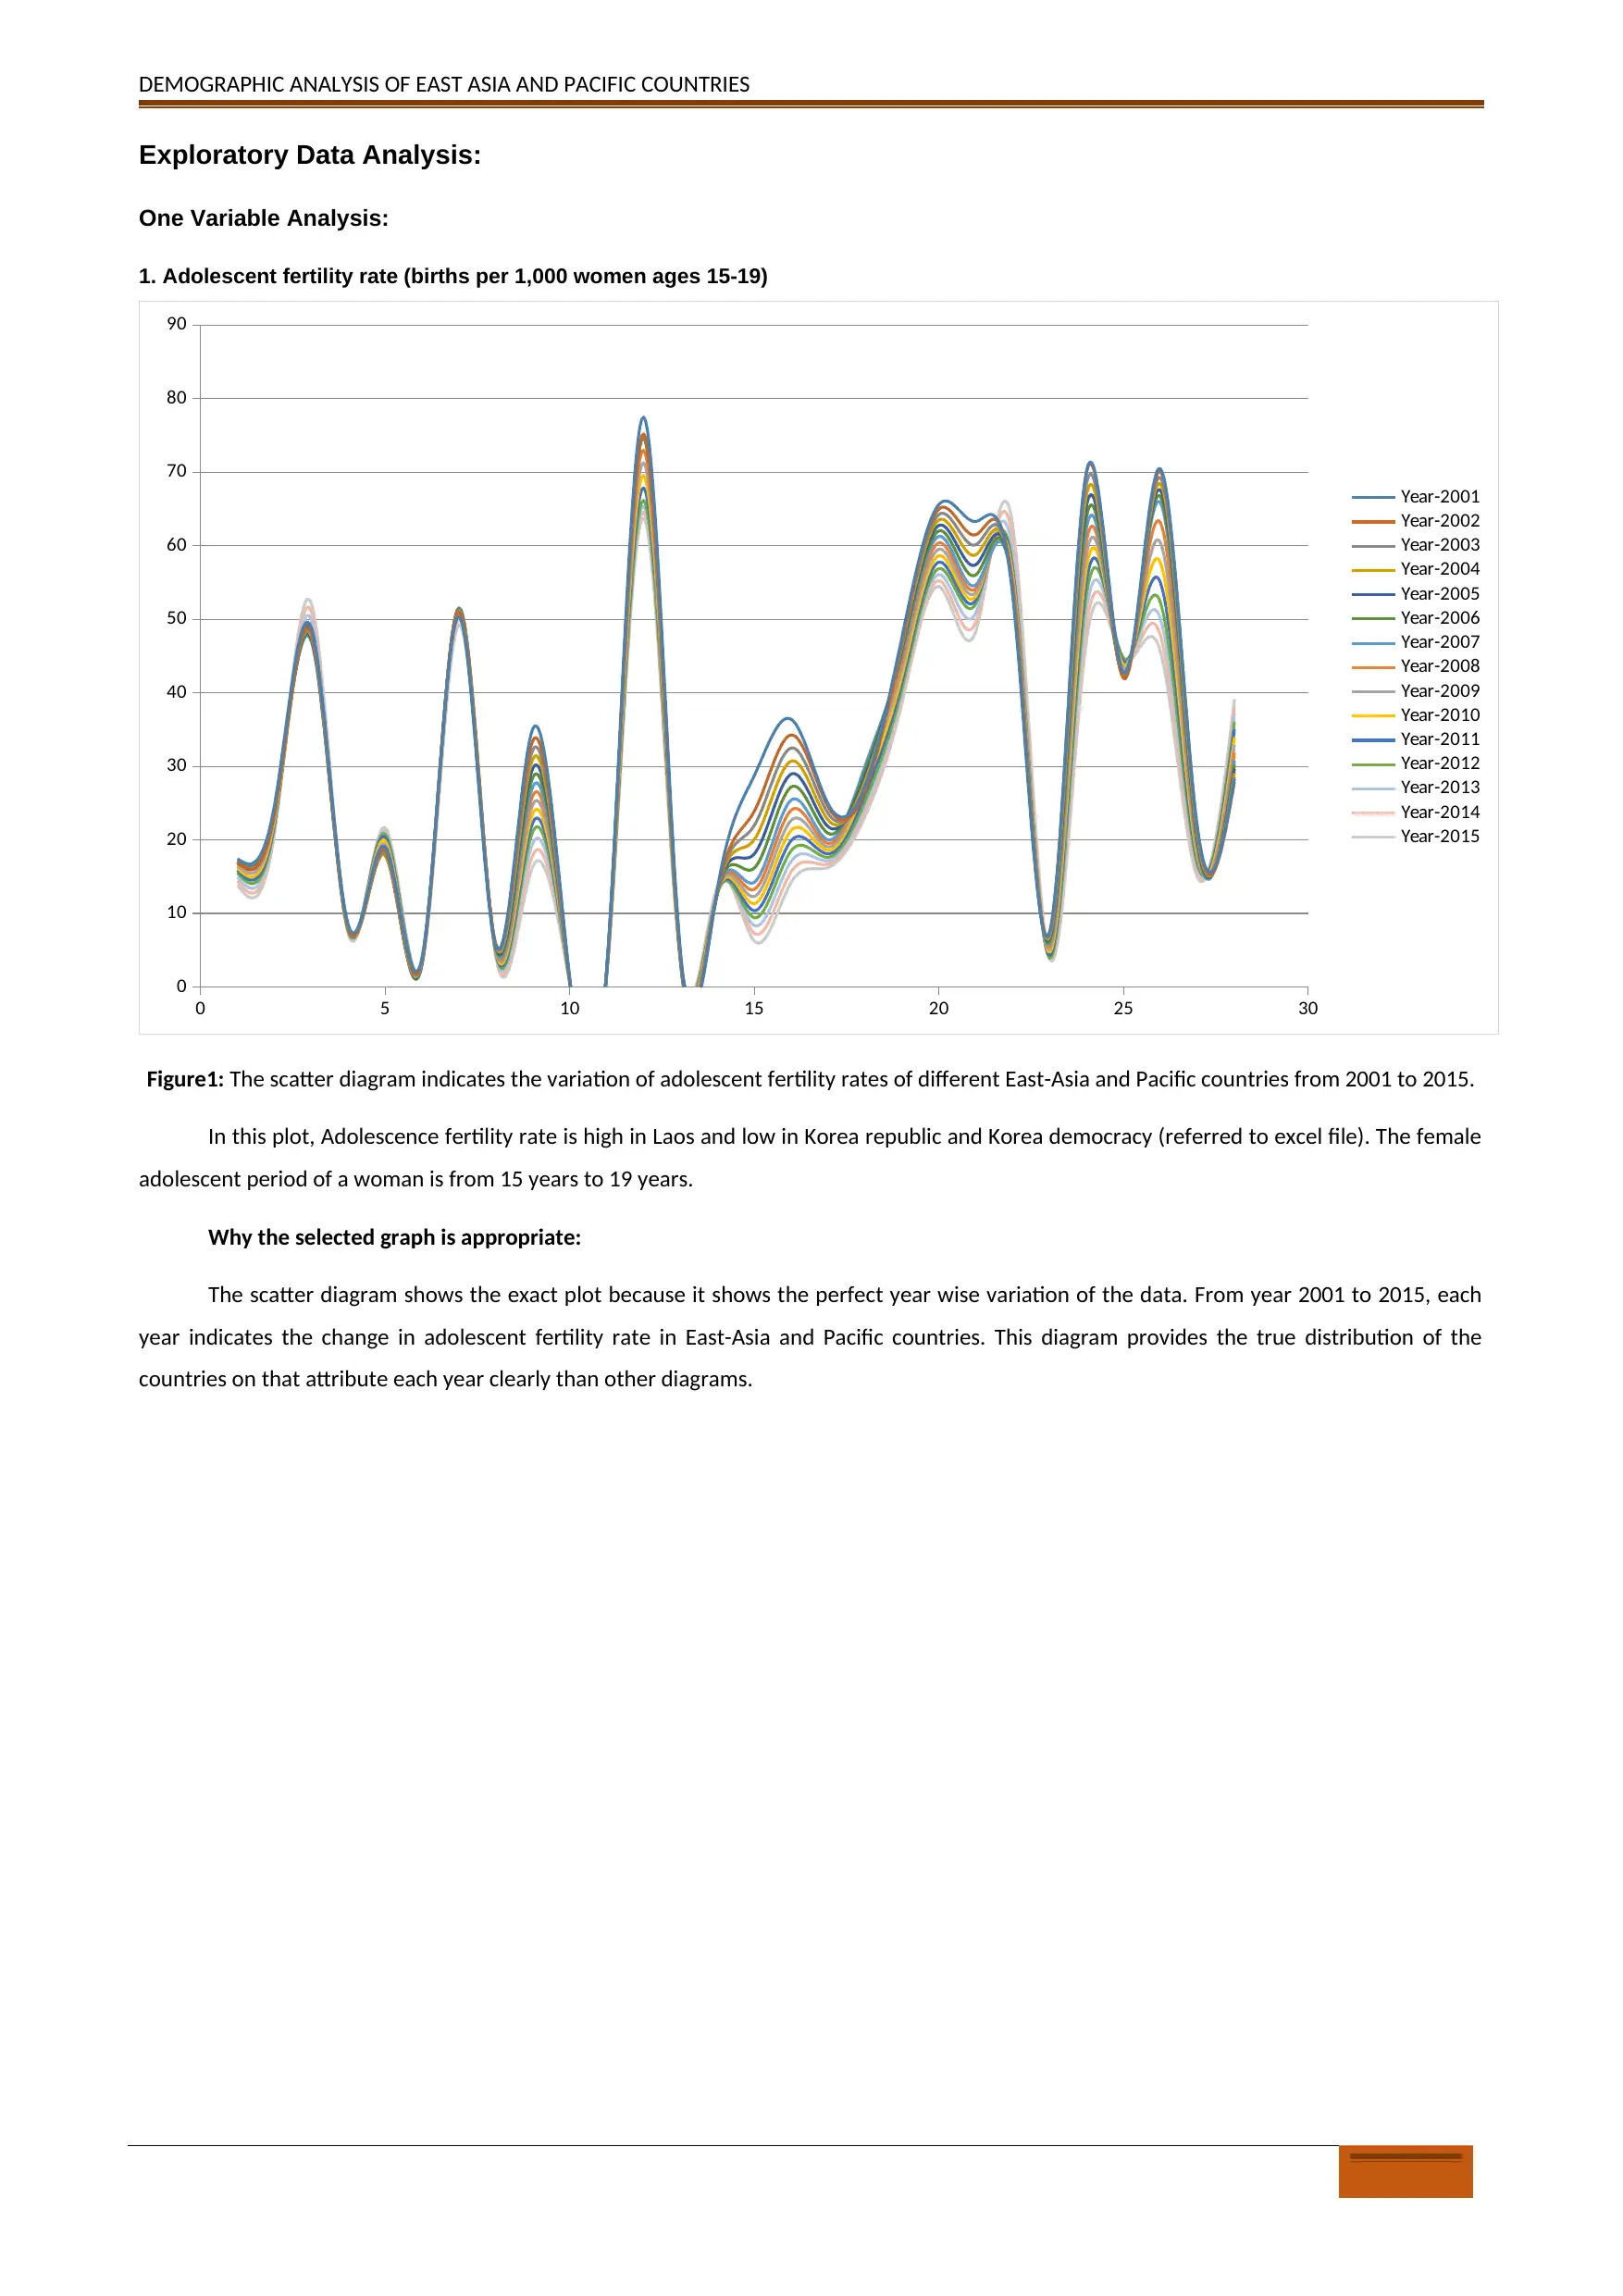
Figure1: The scatter diagram indicates the variation of adolescent fertility rates of different East-Asia and Pacific countries from 2001 to 2015.
In this plot, Adolescence fertility rate is high in Laos and low in Korea republic and Korea democracy (referred to excel file). The female
adolescent period of a woman is from 15 years to 19 years.
Why the selected graph is appropriate:
The scatter diagram shows the exact plot because it shows the perfect year wise variation of the data. From year 2001 to 2015, each
year indicates the change in adolescent fertility rate in East-Asia and Pacific countries. This diagram provides the true distribution of the
countries on that attribute each year clearly than other diagrams.
Exploratory Data Analysis:
One Variable Analysis:
1. Adolescent fertility rate (births per 1,000 women ages 15-19)
0 5 10 15 20 25 30
0
10
20
30
40
50
60
70
80
90
Year-2001
Year-2002
Year-2003
Year-2004
Year-2005
Year-2006
Year-2007
Year-2008
Year-2009
Year-2010
Year-2011
Year-2012
Year-2013
Year-2014
Year-2015
Figure1: The scatter diagram indicates the variation of adolescent fertility rates of different East-Asia and Pacific countries from 2001 to 2015.
In this plot, Adolescence fertility rate is high in Laos and low in Korea republic and Korea democracy (referred to excel file). The female
adolescent period of a woman is from 15 years to 19 years.
Why the selected graph is appropriate:
The scatter diagram shows the exact plot because it shows the perfect year wise variation of the data. From year 2001 to 2015, each
year indicates the change in adolescent fertility rate in East-Asia and Pacific countries. This diagram provides the true distribution of the
countries on that attribute each year clearly than other diagrams.
DEMOGRAPHIC ANALYSIS OF EAST ASIA AND PACIFIC COUNTRIES
2. Life expectancy at birth, total (years):
6 0 6 5 7 0 7 5 8 0 8 5
Box plot of yearwise life
expectancy of many countries
Years from 2001 to 2015
E x p e c te d l i fe s p a n
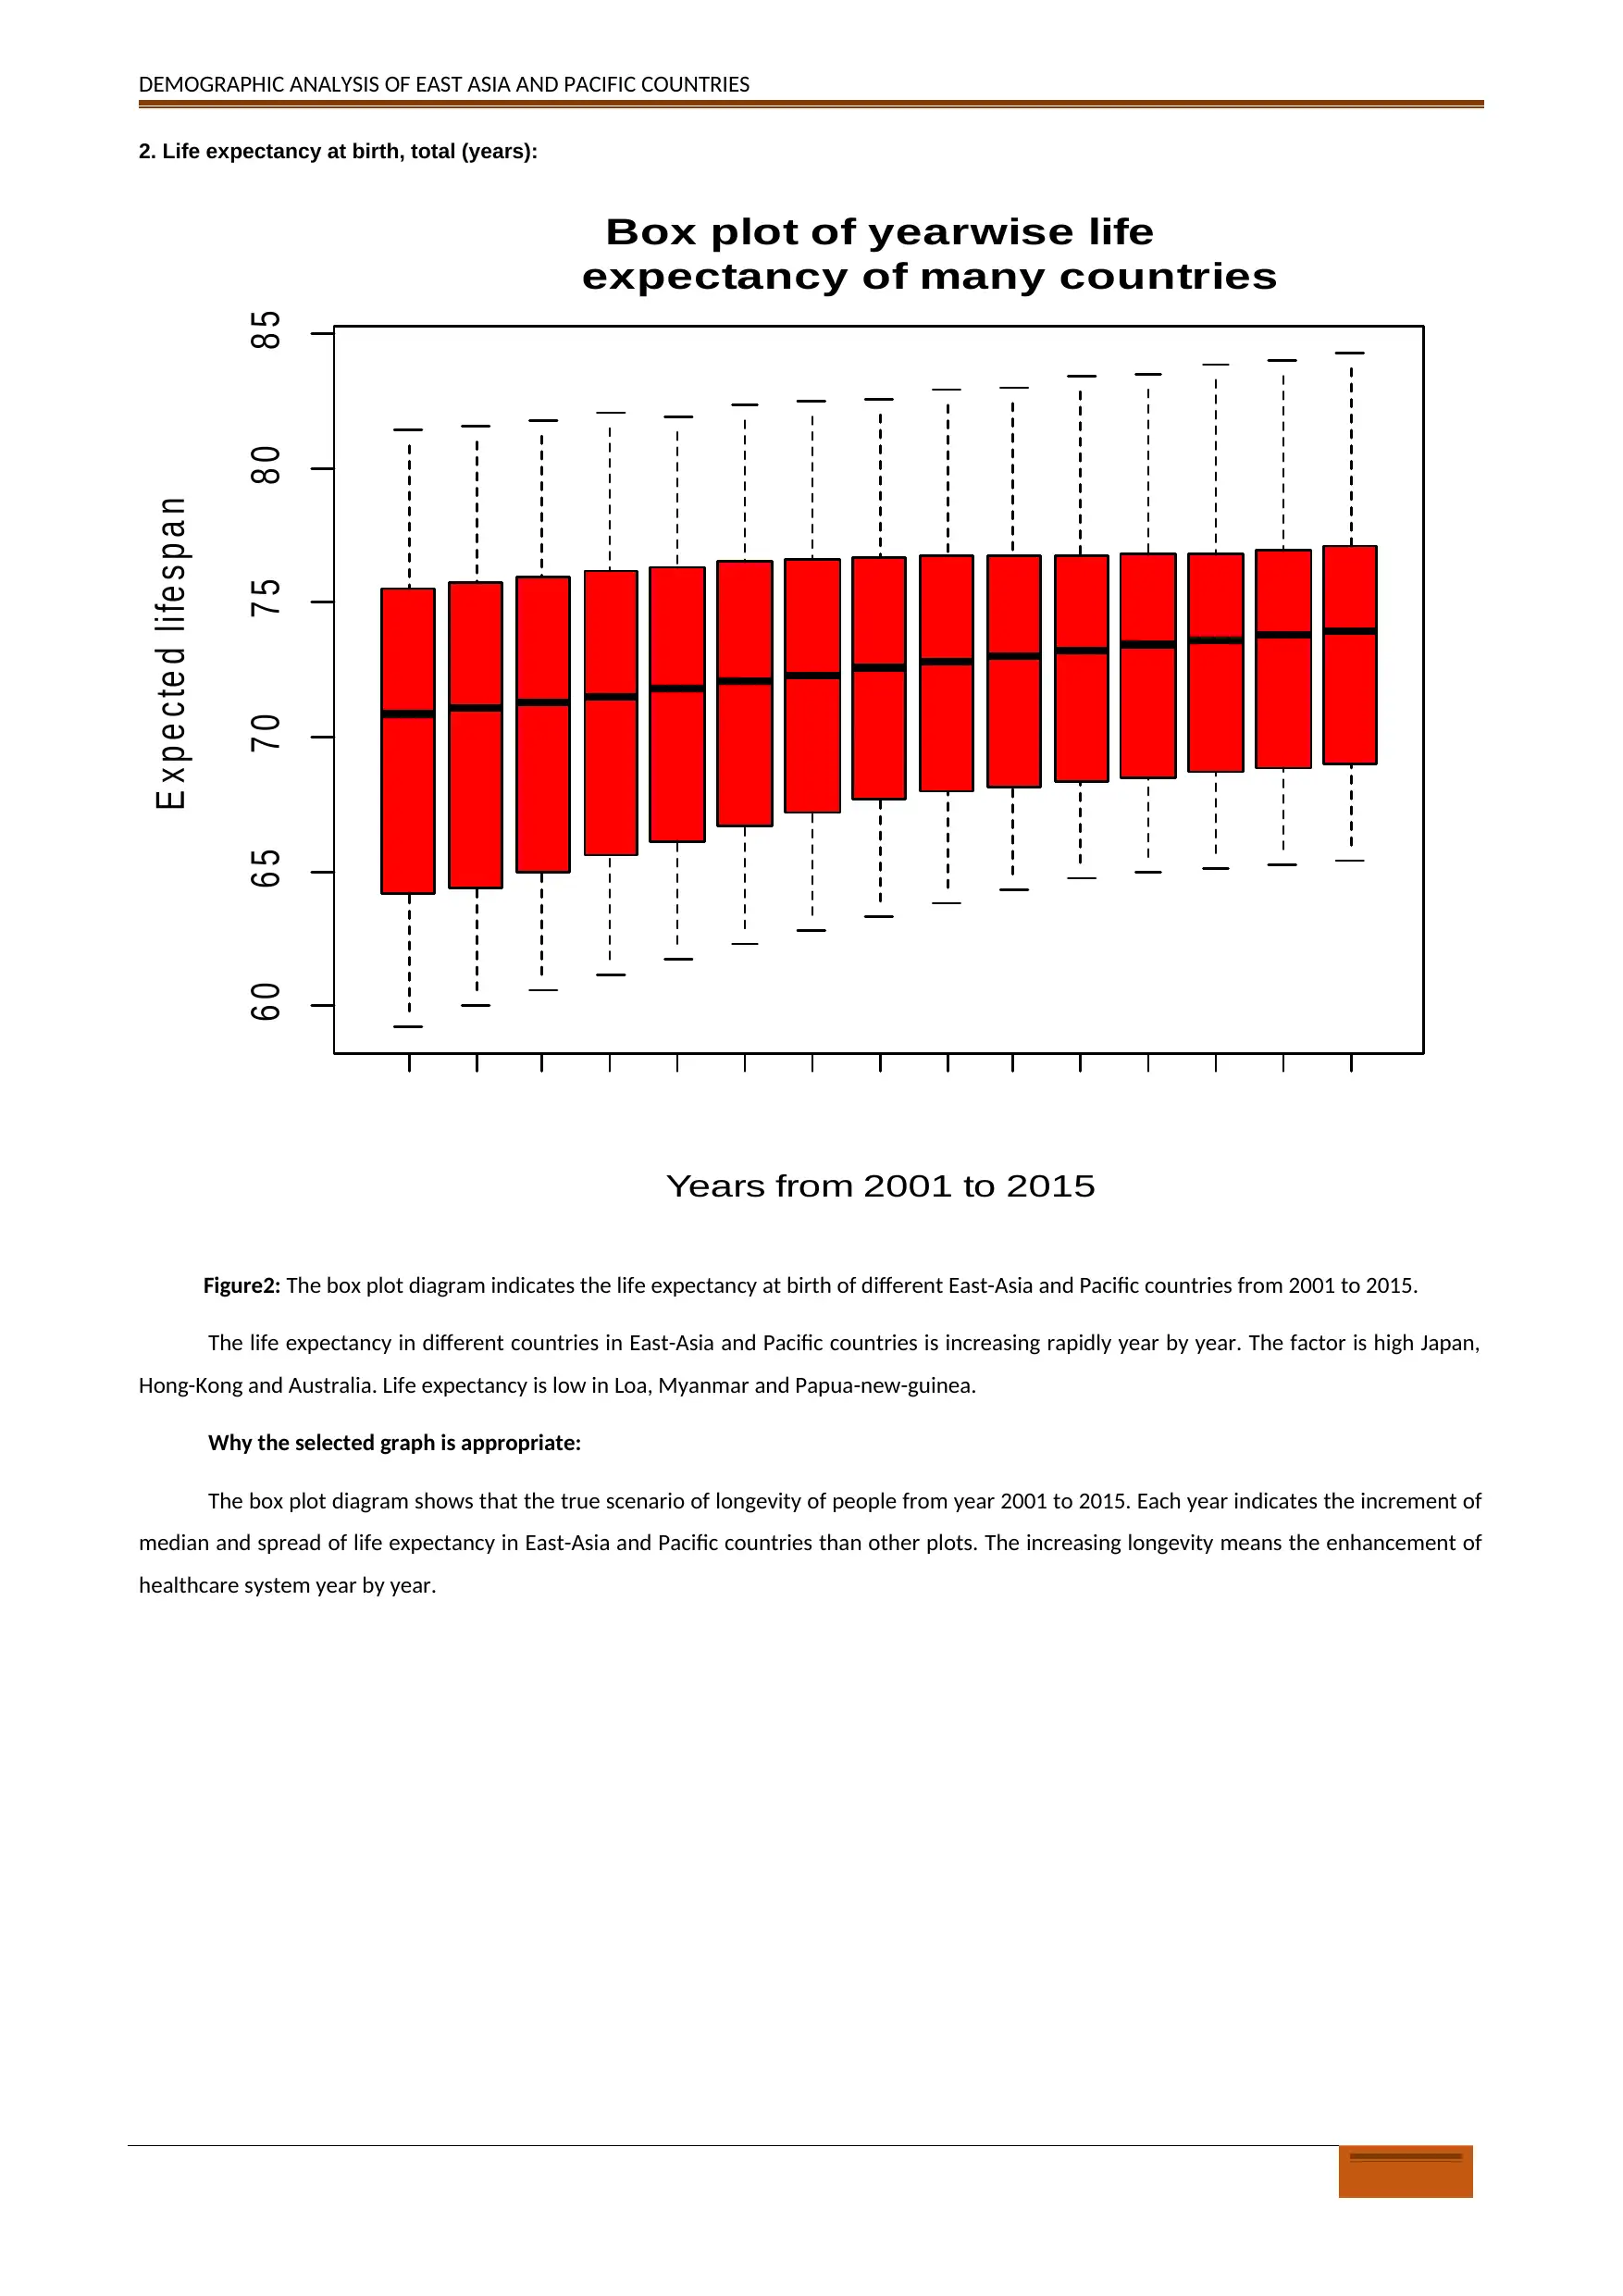
Figure2: The box plot diagram indicates the life expectancy at birth of different East-Asia and Pacific countries from 2001 to 2015.
The life expectancy in different countries in East-Asia and Pacific countries is increasing rapidly year by year. The factor is high Japan,
Hong-Kong and Australia. Life expectancy is low in Loa, Myanmar and Papua-new-guinea.
Why the selected graph is appropriate:
The box plot diagram shows that the true scenario of longevity of people from year 2001 to 2015. Each year indicates the increment of
median and spread of life expectancy in East-Asia and Pacific countries than other plots. The increasing longevity means the enhancement of
healthcare system year by year.
2. Life expectancy at birth, total (years):
6 0 6 5 7 0 7 5 8 0 8 5
Box plot of yearwise life
expectancy of many countries
Years from 2001 to 2015
E x p e c te d l i fe s p a n
Figure2: The box plot diagram indicates the life expectancy at birth of different East-Asia and Pacific countries from 2001 to 2015.
The life expectancy in different countries in East-Asia and Pacific countries is increasing rapidly year by year. The factor is high Japan,
Hong-Kong and Australia. Life expectancy is low in Loa, Myanmar and Papua-new-guinea.
Why the selected graph is appropriate:
The box plot diagram shows that the true scenario of longevity of people from year 2001 to 2015. Each year indicates the increment of
median and spread of life expectancy in East-Asia and Pacific countries than other plots. The increasing longevity means the enhancement of
healthcare system year by year.
⊘ This is a preview!⊘
Do you want full access?
Subscribe today to unlock all pages.
Trusted by 1+ million students worldwide
DEMOGRAPHIC ANALYSIS OF EAST ASIA AND PACIFIC COUNTRIES
3. Unemployment, total (% of total labor force):
0 5 10 15 20 25
0 5 10 15 20 25 30
Mean Unemployment rate of
labour for all years
List wise Countries
mean unemployment percentage
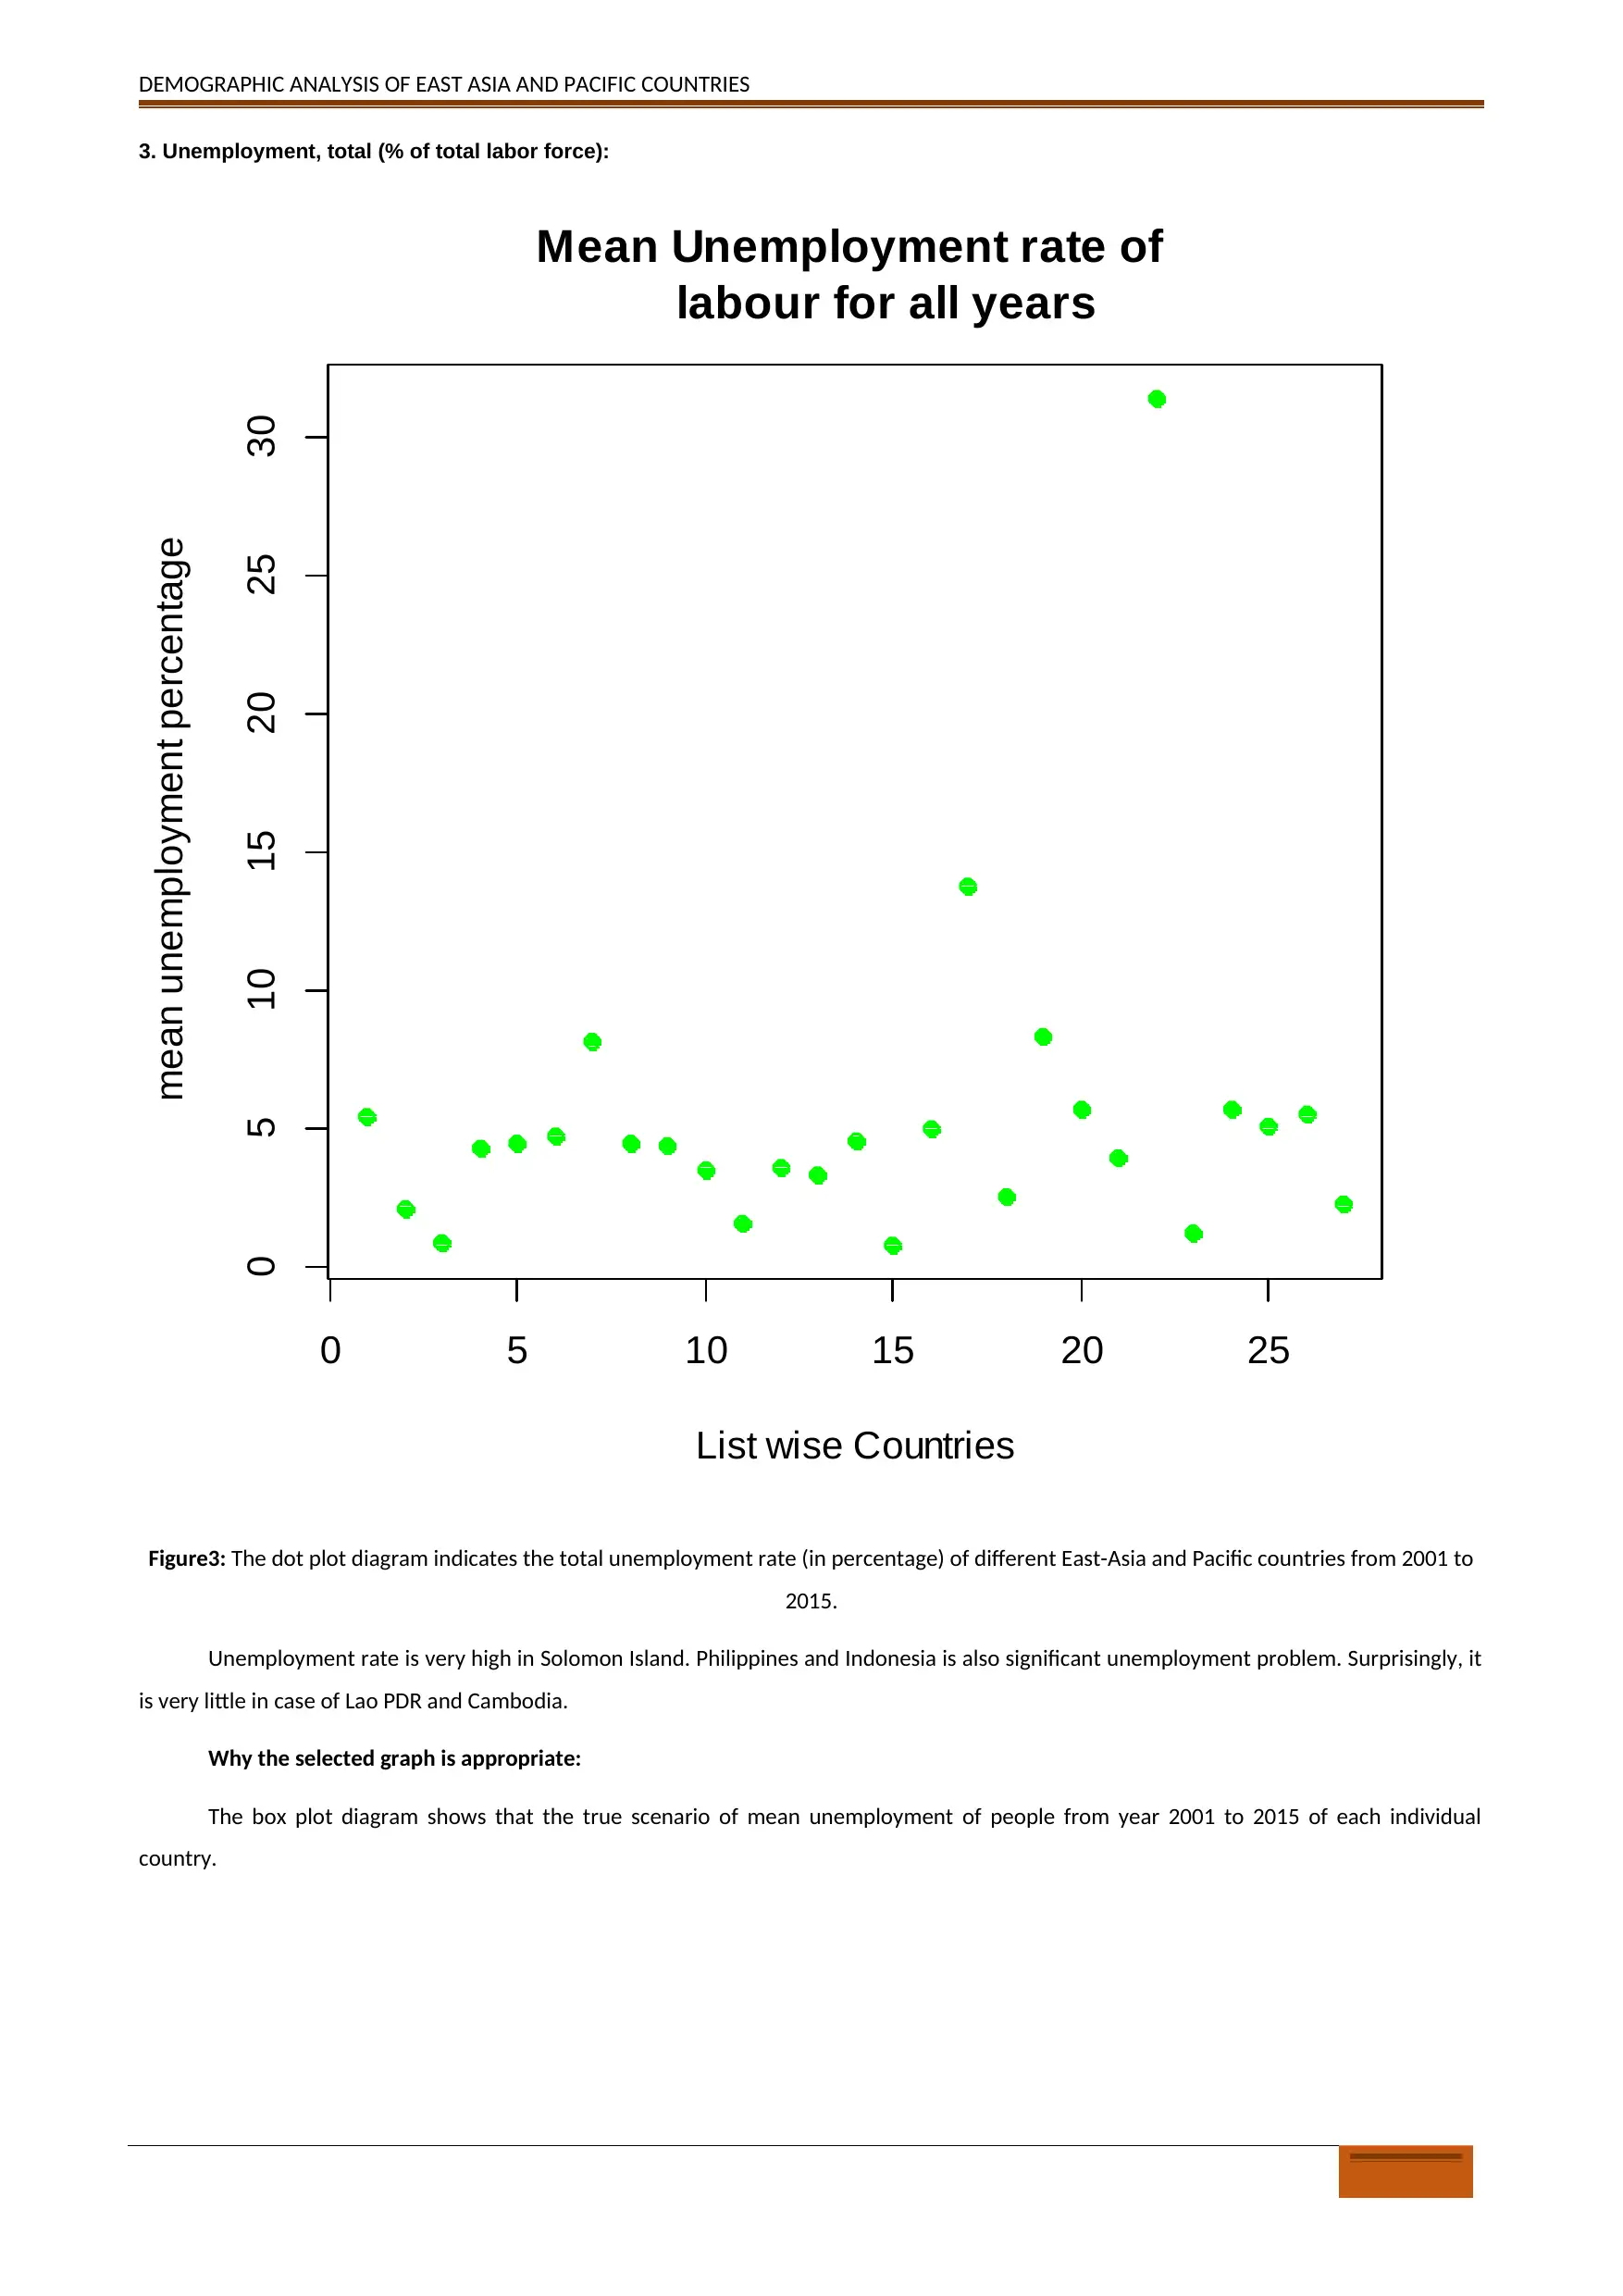
Figure3: The dot plot diagram indicates the total unemployment rate (in percentage) of different East-Asia and Pacific countries from 2001 to
2015.
Unemployment rate is very high in Solomon Island. Philippines and Indonesia is also significant unemployment problem. Surprisingly, it
is very little in case of Lao PDR and Cambodia.
Why the selected graph is appropriate:
The box plot diagram shows that the true scenario of mean unemployment of people from year 2001 to 2015 of each individual
country.
3. Unemployment, total (% of total labor force):
0 5 10 15 20 25
0 5 10 15 20 25 30
Mean Unemployment rate of
labour for all years
List wise Countries
mean unemployment percentage
Figure3: The dot plot diagram indicates the total unemployment rate (in percentage) of different East-Asia and Pacific countries from 2001 to
2015.
Unemployment rate is very high in Solomon Island. Philippines and Indonesia is also significant unemployment problem. Surprisingly, it
is very little in case of Lao PDR and Cambodia.
Why the selected graph is appropriate:
The box plot diagram shows that the true scenario of mean unemployment of people from year 2001 to 2015 of each individual
country.
Paraphrase This Document
Need a fresh take? Get an instant paraphrase of this document with our AI Paraphraser
DEMOGRAPHIC ANALYSIS OF EAST ASIA AND PACIFIC COUNTRIES
30150 30150 30150 30150 30150 30150 30150 30150
30
15
0
30
15
0 30
15
030
15
0 30
15
0
30
15
0 30
15
0
30
15
0 30
15
0
30
15
0 30
15
0
30
15
0 30
15
0
30
15
0 30
15
0
30150
30
15
0
30150 30150 30150 30150 30150 30150 30150
Year-2001
Year-2002
Year-2003
Year-2004
Year-2005
Year-2006
Year-2007
Year-2008
Year-2009
Year-2010
Year-2011
Year-2012
Year-2013
Year-2014
Year-2015
Mean
Matrix Plot of Year-2001, Year-2002, Year-2003, Year-2004, ...
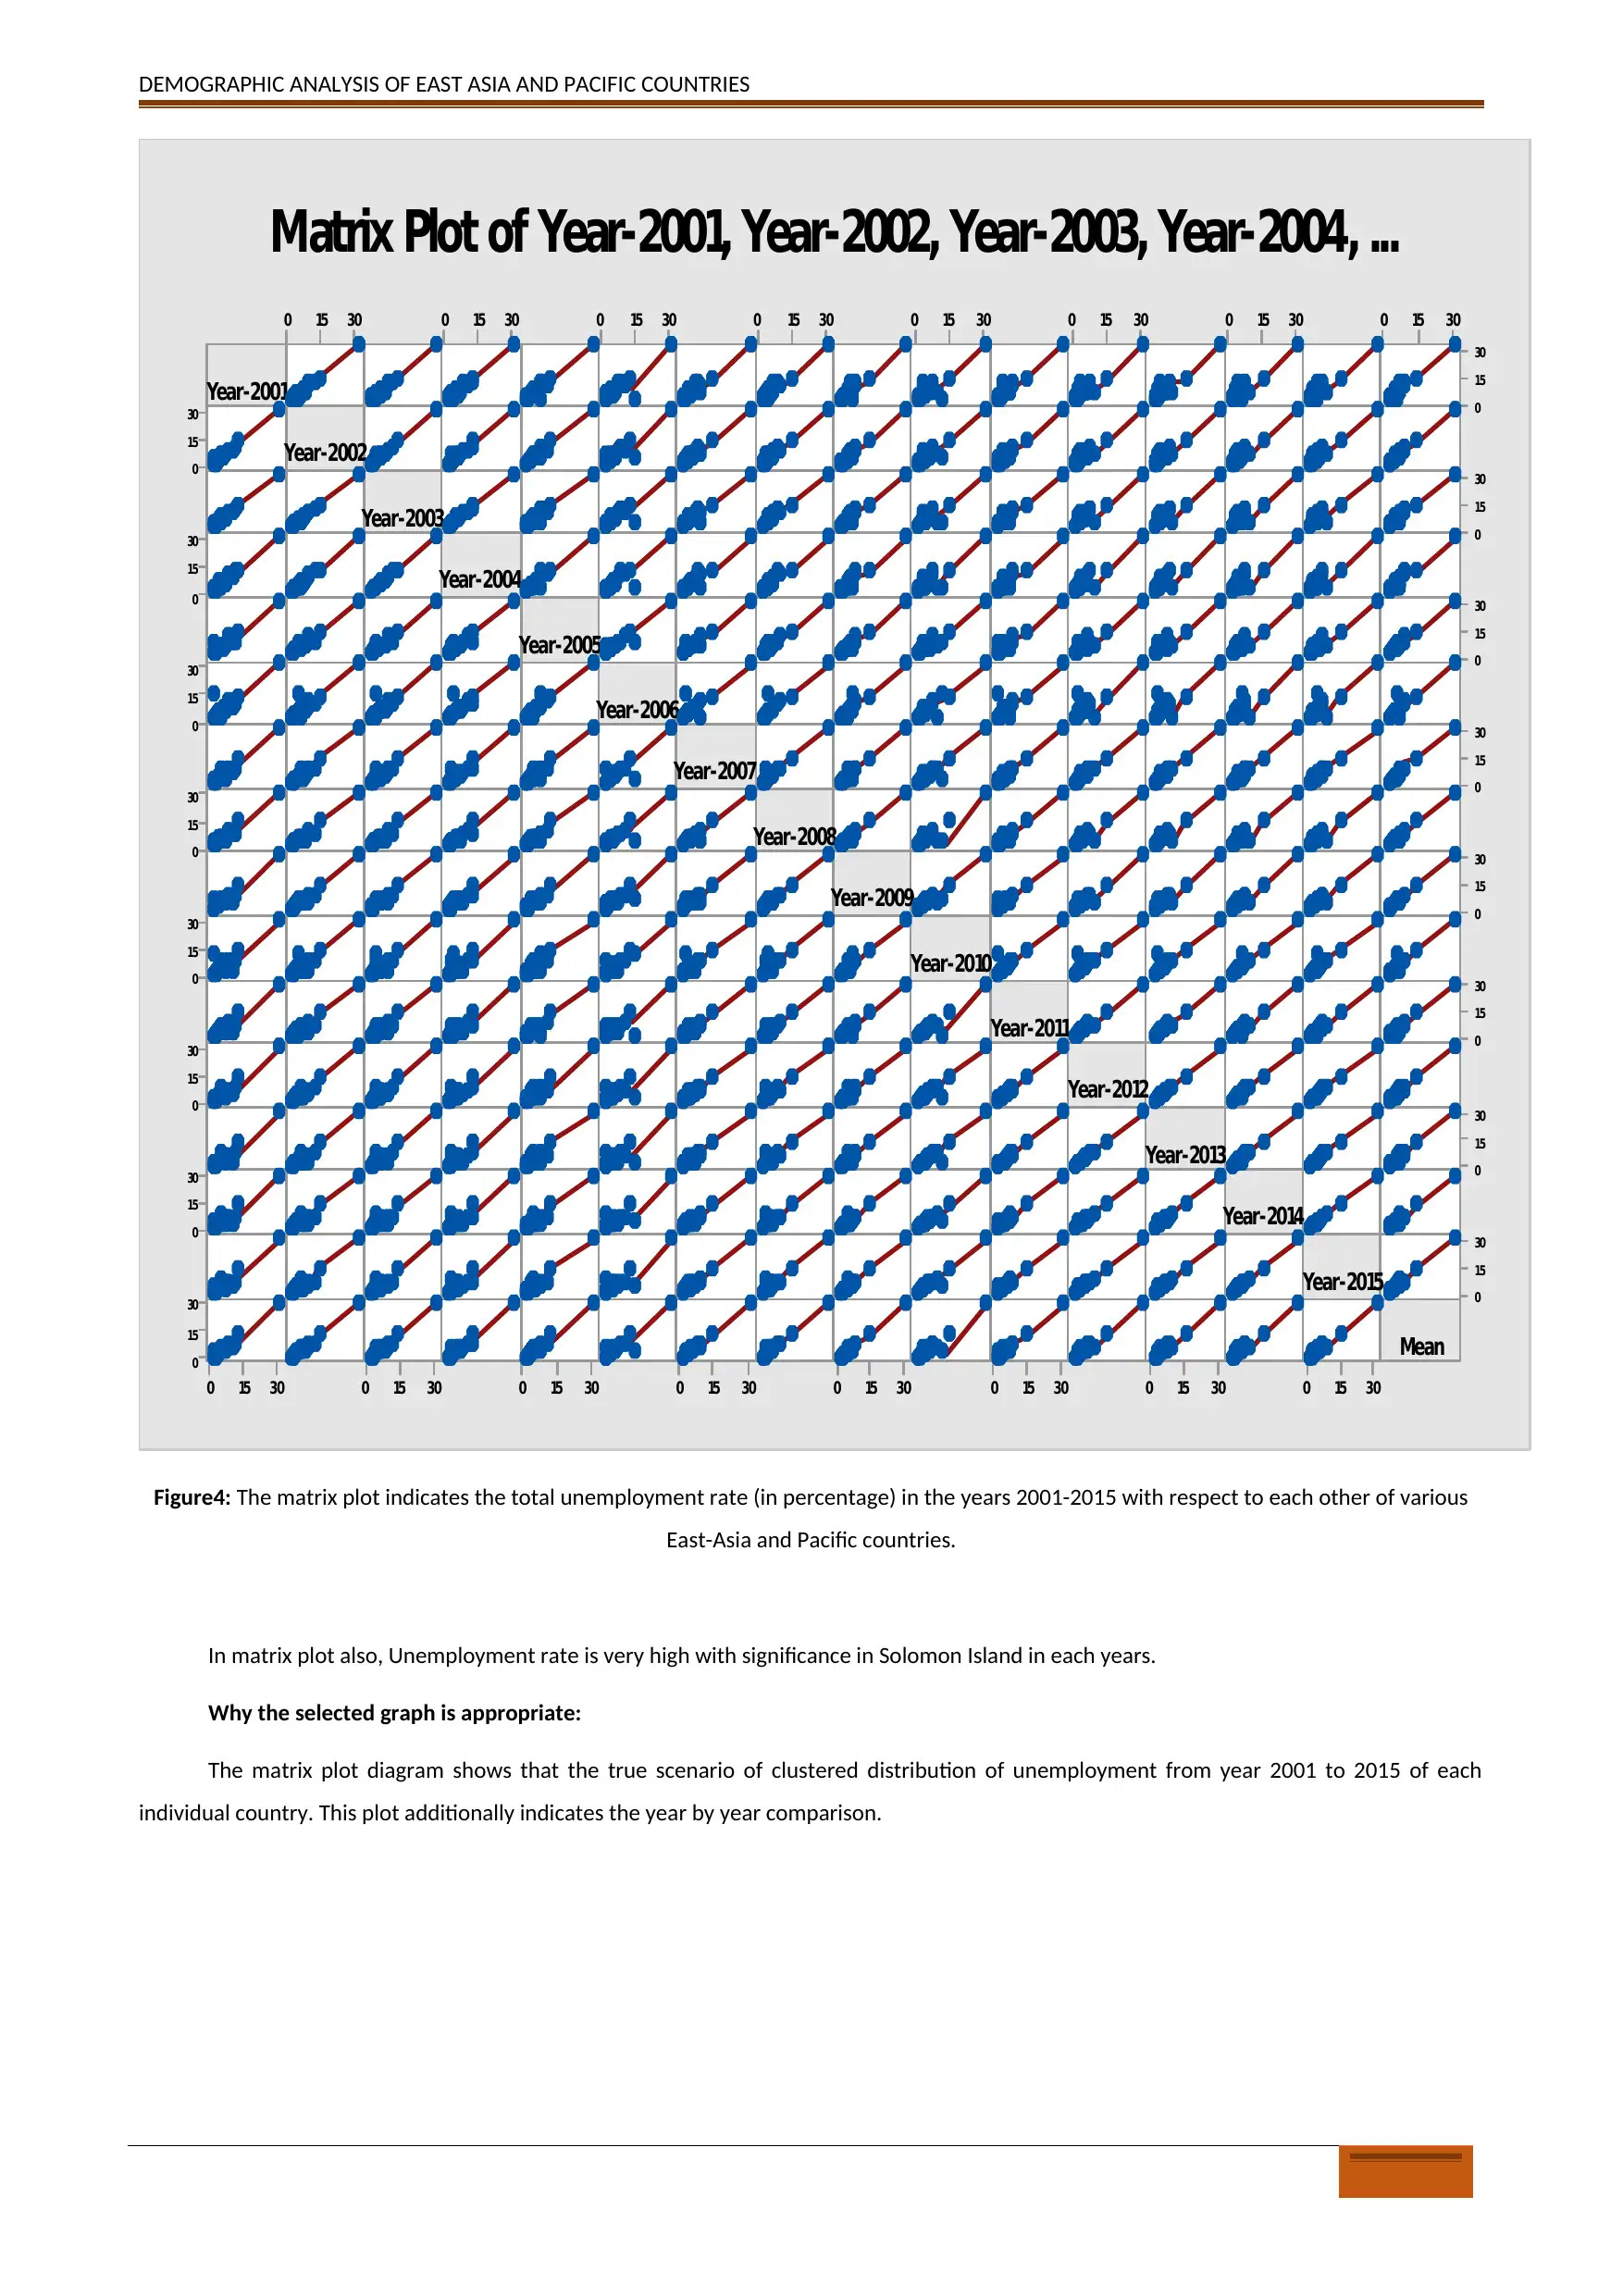
Figure4: The matrix plot indicates the total unemployment rate (in percentage) in the years 2001-2015 with respect to each other of various
East-Asia and Pacific countries.
In matrix plot also, Unemployment rate is very high with significance in Solomon Island in each years.
Why the selected graph is appropriate:
The matrix plot diagram shows that the true scenario of clustered distribution of unemployment from year 2001 to 2015 of each
individual country. This plot additionally indicates the year by year comparison.
30150 30150 30150 30150 30150 30150 30150 30150
30
15
0
30
15
0 30
15
030
15
0 30
15
0
30
15
0 30
15
0
30
15
0 30
15
0
30
15
0 30
15
0
30
15
0 30
15
0
30
15
0 30
15
0
30150
30
15
0
30150 30150 30150 30150 30150 30150 30150
Year-2001
Year-2002
Year-2003
Year-2004
Year-2005
Year-2006
Year-2007
Year-2008
Year-2009
Year-2010
Year-2011
Year-2012
Year-2013
Year-2014
Year-2015
Mean
Matrix Plot of Year-2001, Year-2002, Year-2003, Year-2004, ...
Figure4: The matrix plot indicates the total unemployment rate (in percentage) in the years 2001-2015 with respect to each other of various
East-Asia and Pacific countries.
In matrix plot also, Unemployment rate is very high with significance in Solomon Island in each years.
Why the selected graph is appropriate:
The matrix plot diagram shows that the true scenario of clustered distribution of unemployment from year 2001 to 2015 of each
individual country. This plot additionally indicates the year by year comparison.
DEMOGRAPHIC ANALYSIS OF EAST ASIA AND PACIFIC COUNTRIES
Two Variable Analyses:
1. Health expenditure, private (% of GDP) vs. Health expenditure, public (% of GDP):-
PriAvgPubAvg
18
16
14
12
10
8
6
4
2
0
Data
Boxplot of PubAvg, PriAvg
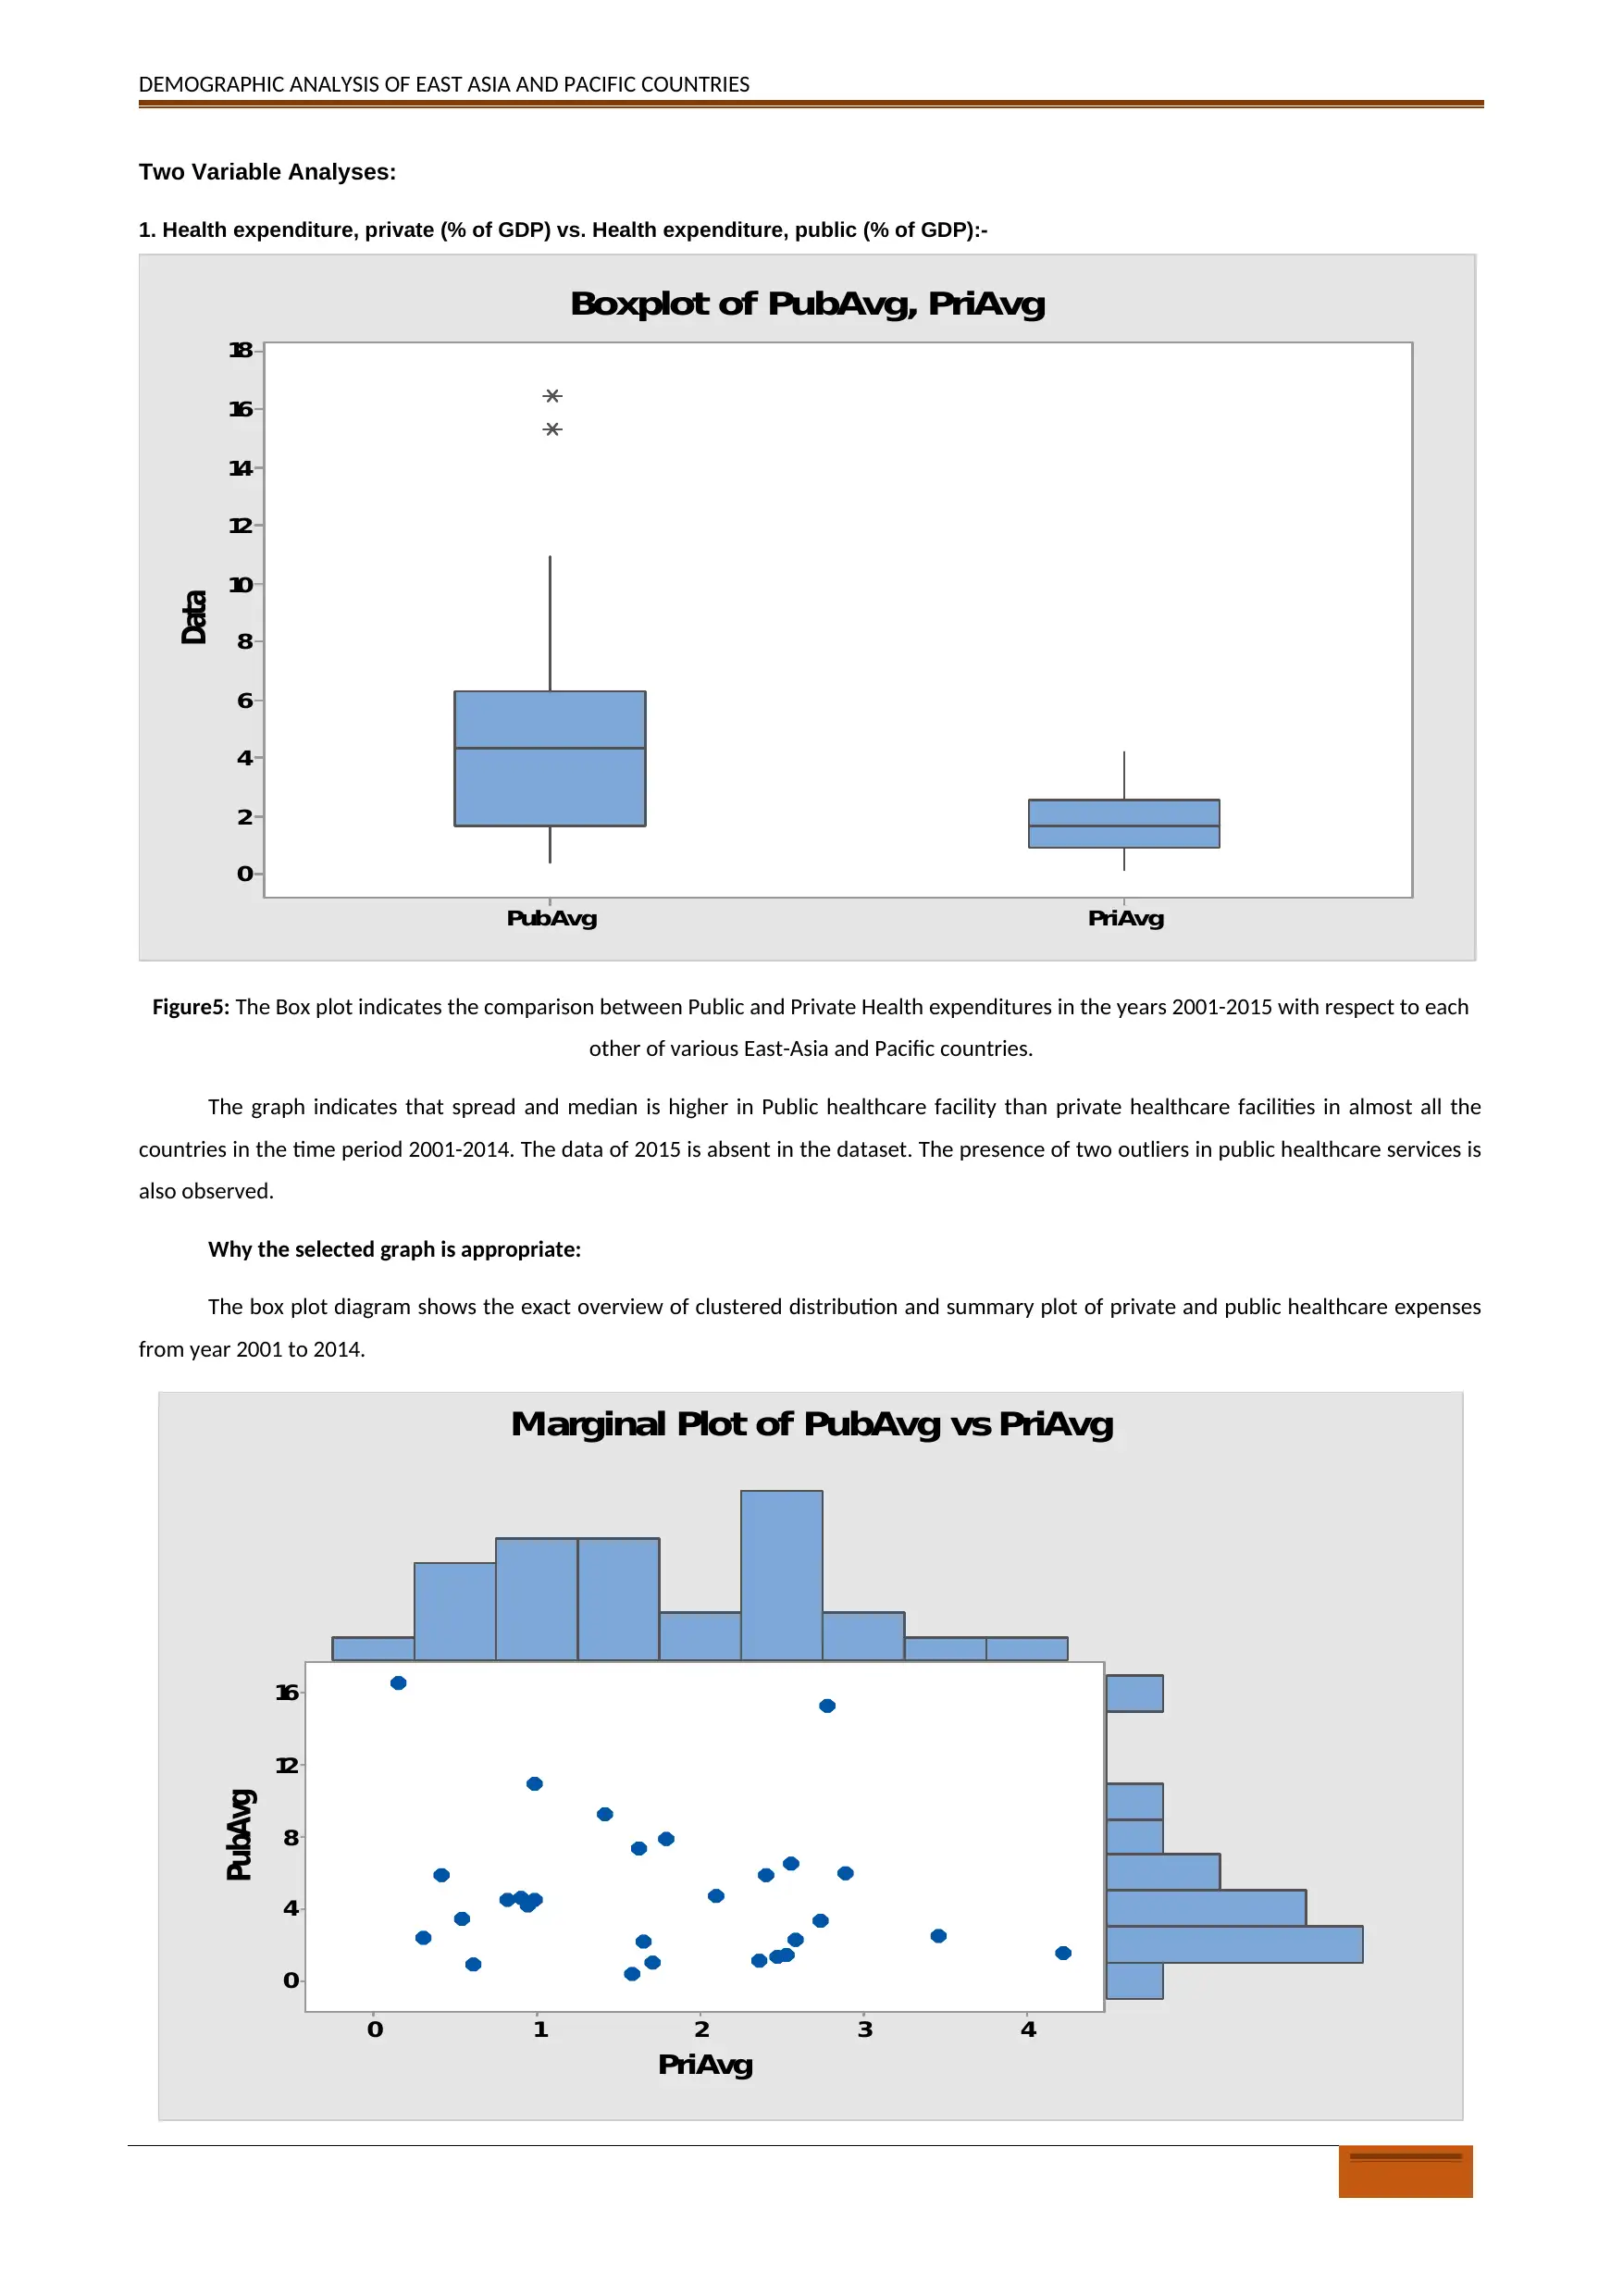
Figure5: The Box plot indicates the comparison between Public and Private Health expenditures in the years 2001-2015 with respect to each
other of various East-Asia and Pacific countries.
The graph indicates that spread and median is higher in Public healthcare facility than private healthcare facilities in almost all the
countries in the time period 2001-2014. The data of 2015 is absent in the dataset. The presence of two outliers in public healthcare services is
also observed.
Why the selected graph is appropriate:
The box plot diagram shows the exact overview of clustered distribution and summary plot of private and public healthcare expenses
from year 2001 to 2014.
43210
16
12
8
4
0
PriAvg
PubAvg
Marginal Plot of PubAvg vs PriAvg
Two Variable Analyses:
1. Health expenditure, private (% of GDP) vs. Health expenditure, public (% of GDP):-
PriAvgPubAvg
18
16
14
12
10
8
6
4
2
0
Data
Boxplot of PubAvg, PriAvg
Figure5: The Box plot indicates the comparison between Public and Private Health expenditures in the years 2001-2015 with respect to each
other of various East-Asia and Pacific countries.
The graph indicates that spread and median is higher in Public healthcare facility than private healthcare facilities in almost all the
countries in the time period 2001-2014. The data of 2015 is absent in the dataset. The presence of two outliers in public healthcare services is
also observed.
Why the selected graph is appropriate:
The box plot diagram shows the exact overview of clustered distribution and summary plot of private and public healthcare expenses
from year 2001 to 2014.
43210
16
12
8
4
0
PriAvg
PubAvg
Marginal Plot of PubAvg vs PriAvg
⊘ This is a preview!⊘
Do you want full access?
Subscribe today to unlock all pages.
Trusted by 1+ million students worldwide
DEMOGRAPHIC ANALYSIS OF EAST ASIA AND PACIFIC COUNTRIES
Figure6: The Marginal Plot indicates the comparison between Public and Private Health expenditures in the years 2001-2015 with respect to
each other of various East-Asia and Pacific countries.
The given graph about comparison between public health services and private health services indicates that Tuvalu has provided the
maximum percentage of Health service cost throughout the period of 14 years (data of 2015 is not given in the dataset). Similarly, this country
provides the lowest percentage of private healthcare facility. Marshal Island, Micronesia and New-Zealand also supplies huge percentages of
their countries’ g.d.p for public healthcare facilities. Public healthcare facility is pretty good in these countries. Myanmar, Lao and Indonesia
allocate the lowest percentages of their countries’ g.d.p for public healthcare facilities.
Tuvalu, Brunei Darussalam, Timor-Leste and Solomon Island have the low private healthcare facility. Comparatively, Cambodia and
Vietnam has allocated the highest percentages of their g.d.p for private healthcare facility. Cambodia and Vietnam does not have good public
healthcare facility. Therefore, they concentrate on comparatively better private healthcare facility.
Correlation: Public average healthcare expenditure and Private average healthcare expenditure.
Correlations
Pearson correlation -0.207
P-value 0.291
The weak negative Pearson’s correlation coefficient (-0.207) indicates that there is a weak link between the increasing Private
healthcare expenditure and decreasing Public healthcare expenditure and vice versa.
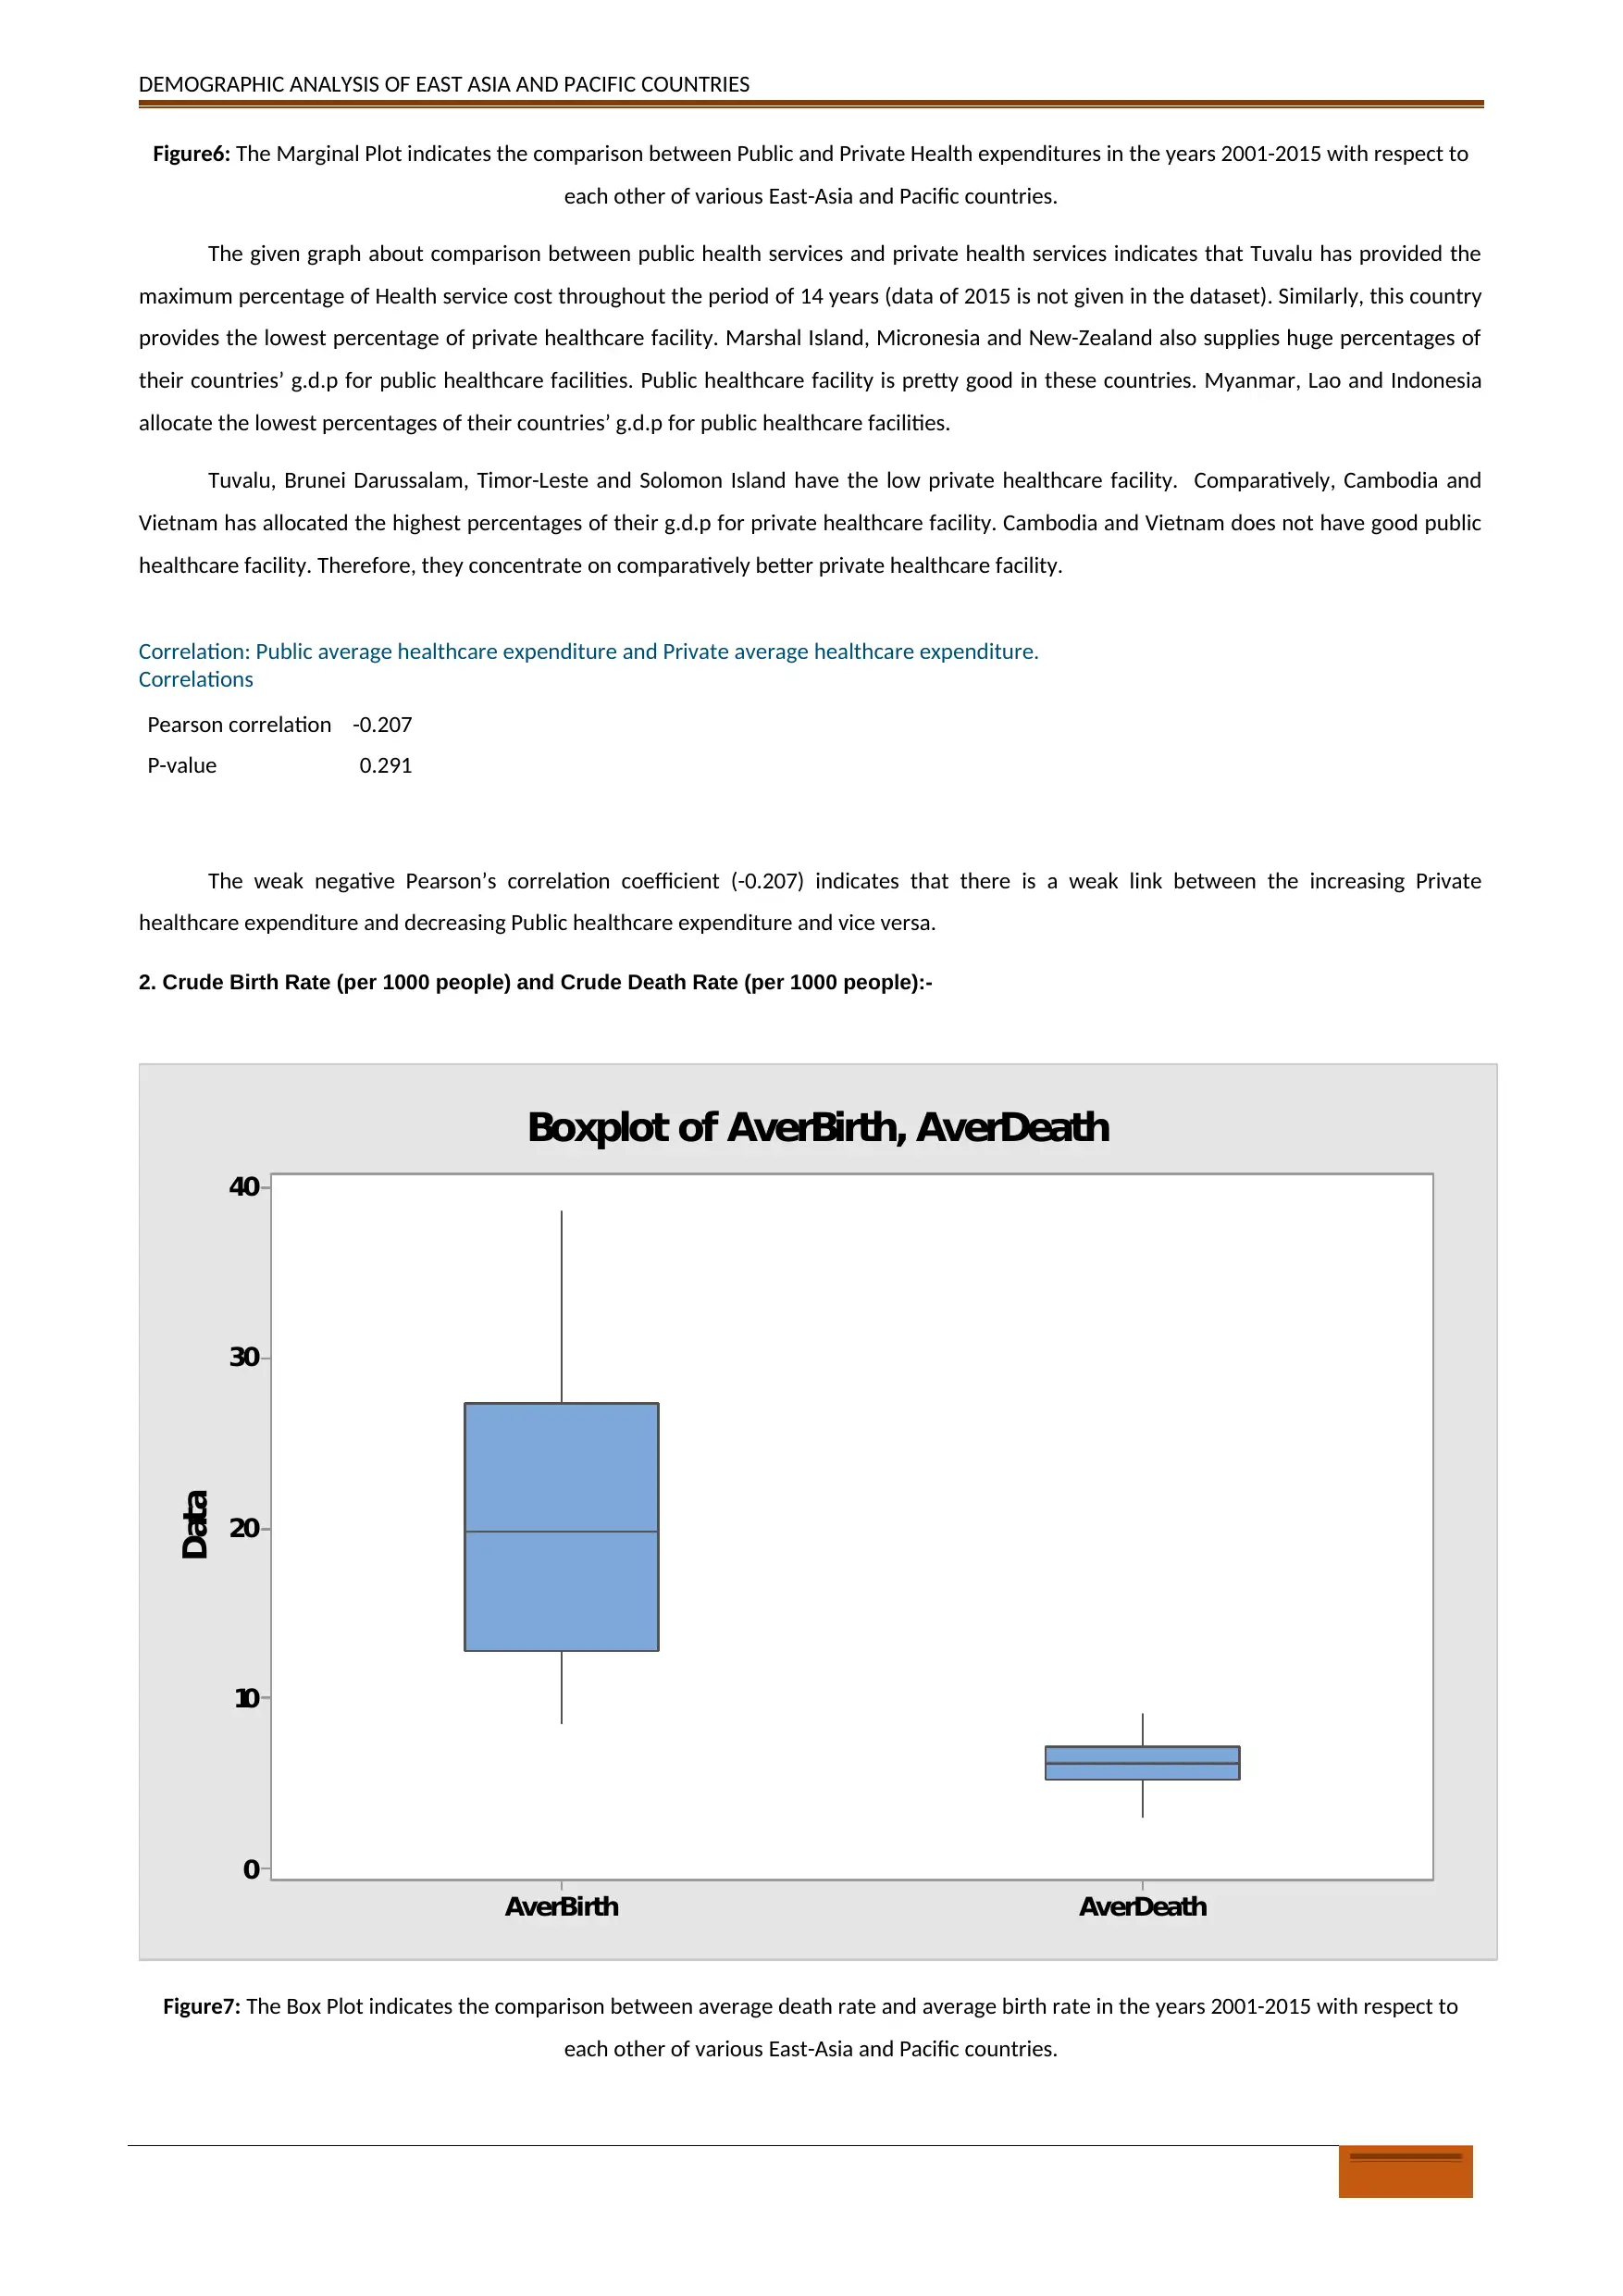
2. Crude Birth Rate (per 1000 people) and Crude Death Rate (per 1000 people):-
AverDeathAverBirth
40
30
20
10
0
Data
Boxplot of AverBirth, AverDeath
Figure7: The Box Plot indicates the comparison between average death rate and average birth rate in the years 2001-2015 with respect to
each other of various East-Asia and Pacific countries.
Figure6: The Marginal Plot indicates the comparison between Public and Private Health expenditures in the years 2001-2015 with respect to
each other of various East-Asia and Pacific countries.
The given graph about comparison between public health services and private health services indicates that Tuvalu has provided the
maximum percentage of Health service cost throughout the period of 14 years (data of 2015 is not given in the dataset). Similarly, this country
provides the lowest percentage of private healthcare facility. Marshal Island, Micronesia and New-Zealand also supplies huge percentages of
their countries’ g.d.p for public healthcare facilities. Public healthcare facility is pretty good in these countries. Myanmar, Lao and Indonesia
allocate the lowest percentages of their countries’ g.d.p for public healthcare facilities.
Tuvalu, Brunei Darussalam, Timor-Leste and Solomon Island have the low private healthcare facility. Comparatively, Cambodia and
Vietnam has allocated the highest percentages of their g.d.p for private healthcare facility. Cambodia and Vietnam does not have good public
healthcare facility. Therefore, they concentrate on comparatively better private healthcare facility.
Correlation: Public average healthcare expenditure and Private average healthcare expenditure.
Correlations
Pearson correlation -0.207
P-value 0.291
The weak negative Pearson’s correlation coefficient (-0.207) indicates that there is a weak link between the increasing Private
healthcare expenditure and decreasing Public healthcare expenditure and vice versa.
2. Crude Birth Rate (per 1000 people) and Crude Death Rate (per 1000 people):-
AverDeathAverBirth
40
30
20
10
0
Data
Boxplot of AverBirth, AverDeath
Figure7: The Box Plot indicates the comparison between average death rate and average birth rate in the years 2001-2015 with respect to
each other of various East-Asia and Pacific countries.
Paraphrase This Document
Need a fresh take? Get an instant paraphrase of this document with our AI Paraphraser
DEMOGRAPHIC ANALYSIS OF EAST ASIA AND PACIFIC COUNTRIES
The graph indicates that spread and median is higher in Average Birth rate of the countries than Average Death rate in almost all the
countries in the time period 2001-2015. There are no outliers in the box plot. The population is gradually increasing in East-Asia and Pacific
region – it is the interpretation from the data.
Why the selected graph is appropriate:
The box plot diagram shows the exact overview of clustered distribution and summary plot of Average Death rate and Average Birth
rate from year 2001 to 2015.
9876543
40
30
20
10
AverDeath
AverBirth
Marginal Plot of AverBirth vs AverDeath
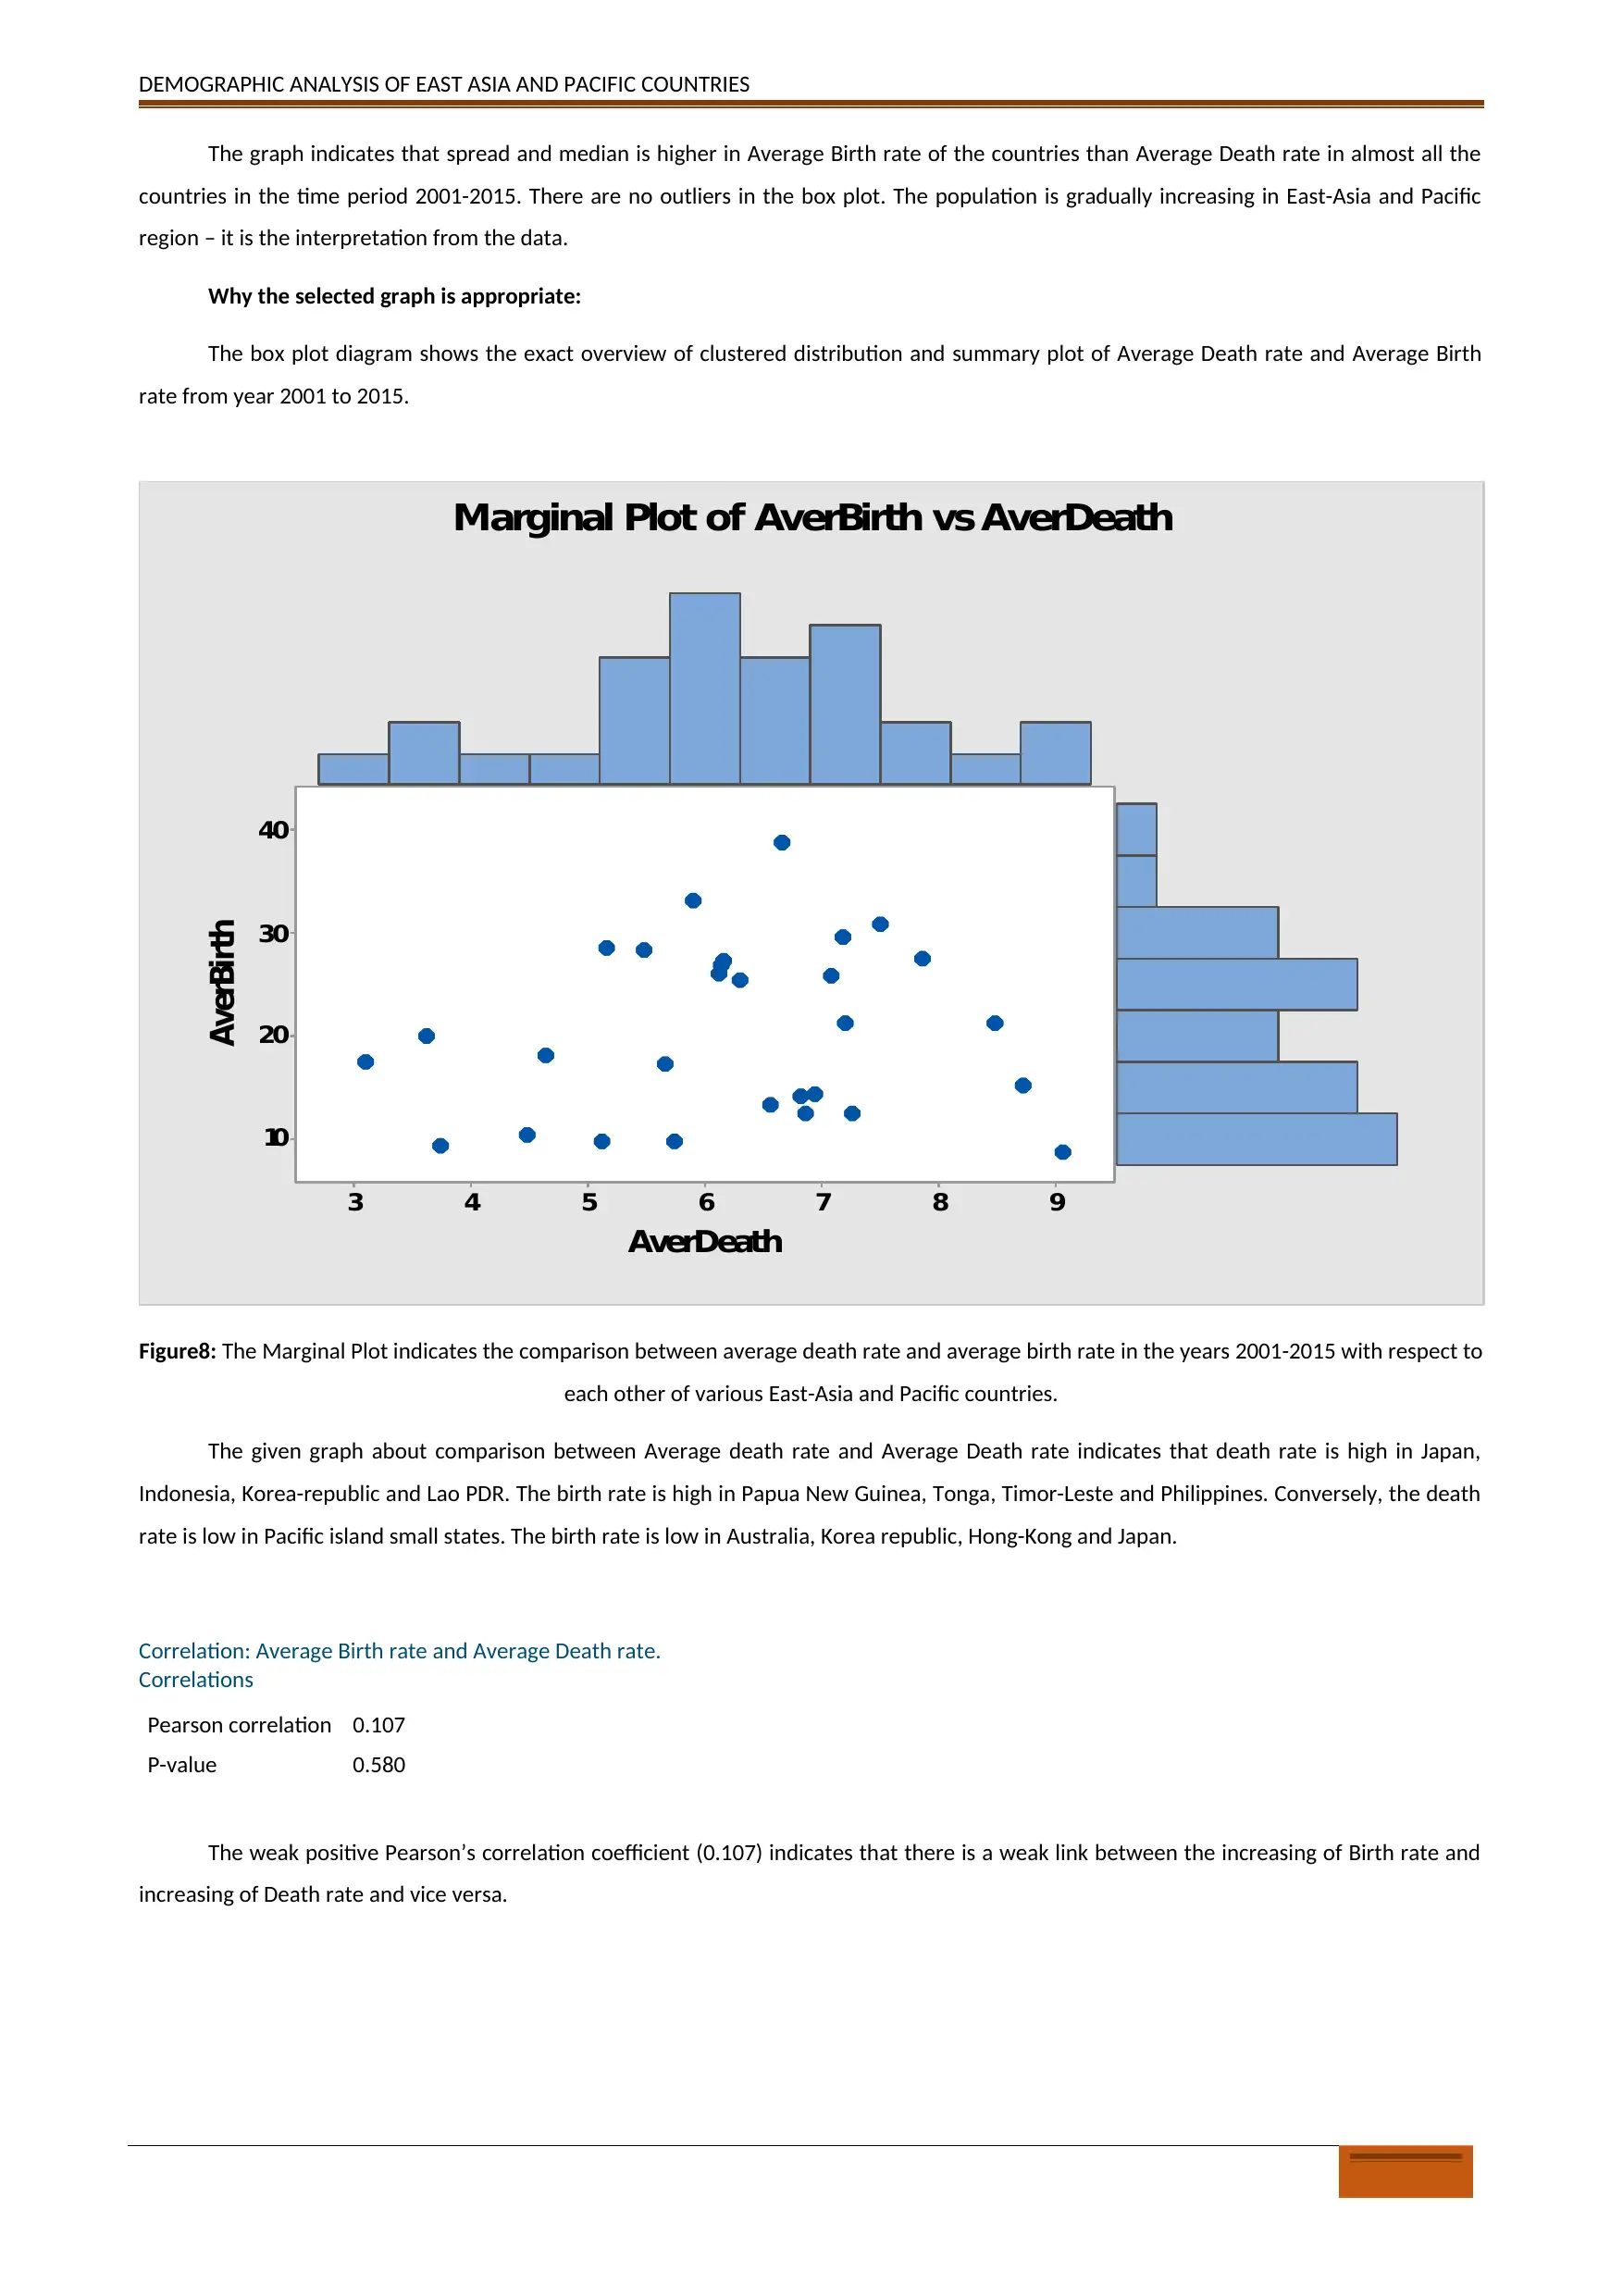
Figure8: The Marginal Plot indicates the comparison between average death rate and average birth rate in the years 2001-2015 with respect to
each other of various East-Asia and Pacific countries.
The given graph about comparison between Average death rate and Average Death rate indicates that death rate is high in Japan,
Indonesia, Korea-republic and Lao PDR. The birth rate is high in Papua New Guinea, Tonga, Timor-Leste and Philippines. Conversely, the death
rate is low in Pacific island small states. The birth rate is low in Australia, Korea republic, Hong-Kong and Japan.
Correlation: Average Birth rate and Average Death rate.
Correlations
Pearson correlation 0.107
P-value 0.580
The weak positive Pearson’s correlation coefficient (0.107) indicates that there is a weak link between the increasing of Birth rate and
increasing of Death rate and vice versa.
The graph indicates that spread and median is higher in Average Birth rate of the countries than Average Death rate in almost all the
countries in the time period 2001-2015. There are no outliers in the box plot. The population is gradually increasing in East-Asia and Pacific
region – it is the interpretation from the data.
Why the selected graph is appropriate:
The box plot diagram shows the exact overview of clustered distribution and summary plot of Average Death rate and Average Birth
rate from year 2001 to 2015.
9876543
40
30
20
10
AverDeath
AverBirth
Marginal Plot of AverBirth vs AverDeath
Figure8: The Marginal Plot indicates the comparison between average death rate and average birth rate in the years 2001-2015 with respect to
each other of various East-Asia and Pacific countries.
The given graph about comparison between Average death rate and Average Death rate indicates that death rate is high in Japan,
Indonesia, Korea-republic and Lao PDR. The birth rate is high in Papua New Guinea, Tonga, Timor-Leste and Philippines. Conversely, the death
rate is low in Pacific island small states. The birth rate is low in Australia, Korea republic, Hong-Kong and Japan.
Correlation: Average Birth rate and Average Death rate.
Correlations
Pearson correlation 0.107
P-value 0.580
The weak positive Pearson’s correlation coefficient (0.107) indicates that there is a weak link between the increasing of Birth rate and
increasing of Death rate and vice versa.
DEMOGRAPHIC ANALYSIS OF EAST ASIA AND PACIFIC COUNTRIES
Advanced Analysis:
Cluster Analysis of K-means:
Discussion:
From n number of samples of datasets if anyone selects k (k<n) number of data for each sample and makes a cluster of p (n/k=p)
numbers, then clustering of multivariate analysis occurs. The centroids of each cluster (of no. k) become the new means. Analysts use
clustering analysis vastly in real life statistical problems and this process implements some algorithms. This k-mean cluster analysis is a relaxed
solution of principal component analysis, Gaussian mixed model and independent component analysis (Saracalli, dogan, dogan 2013).
Cluster analysis helps to take better conclusions on selection of appropriate cluster methods by using variable numbers, subgroup
means, subgroup sizes and variances (Anderberg 2015).
Report maker performed cluster analyses on GNI per capita, Life Expectancy at birth of total population and crude birth rate.
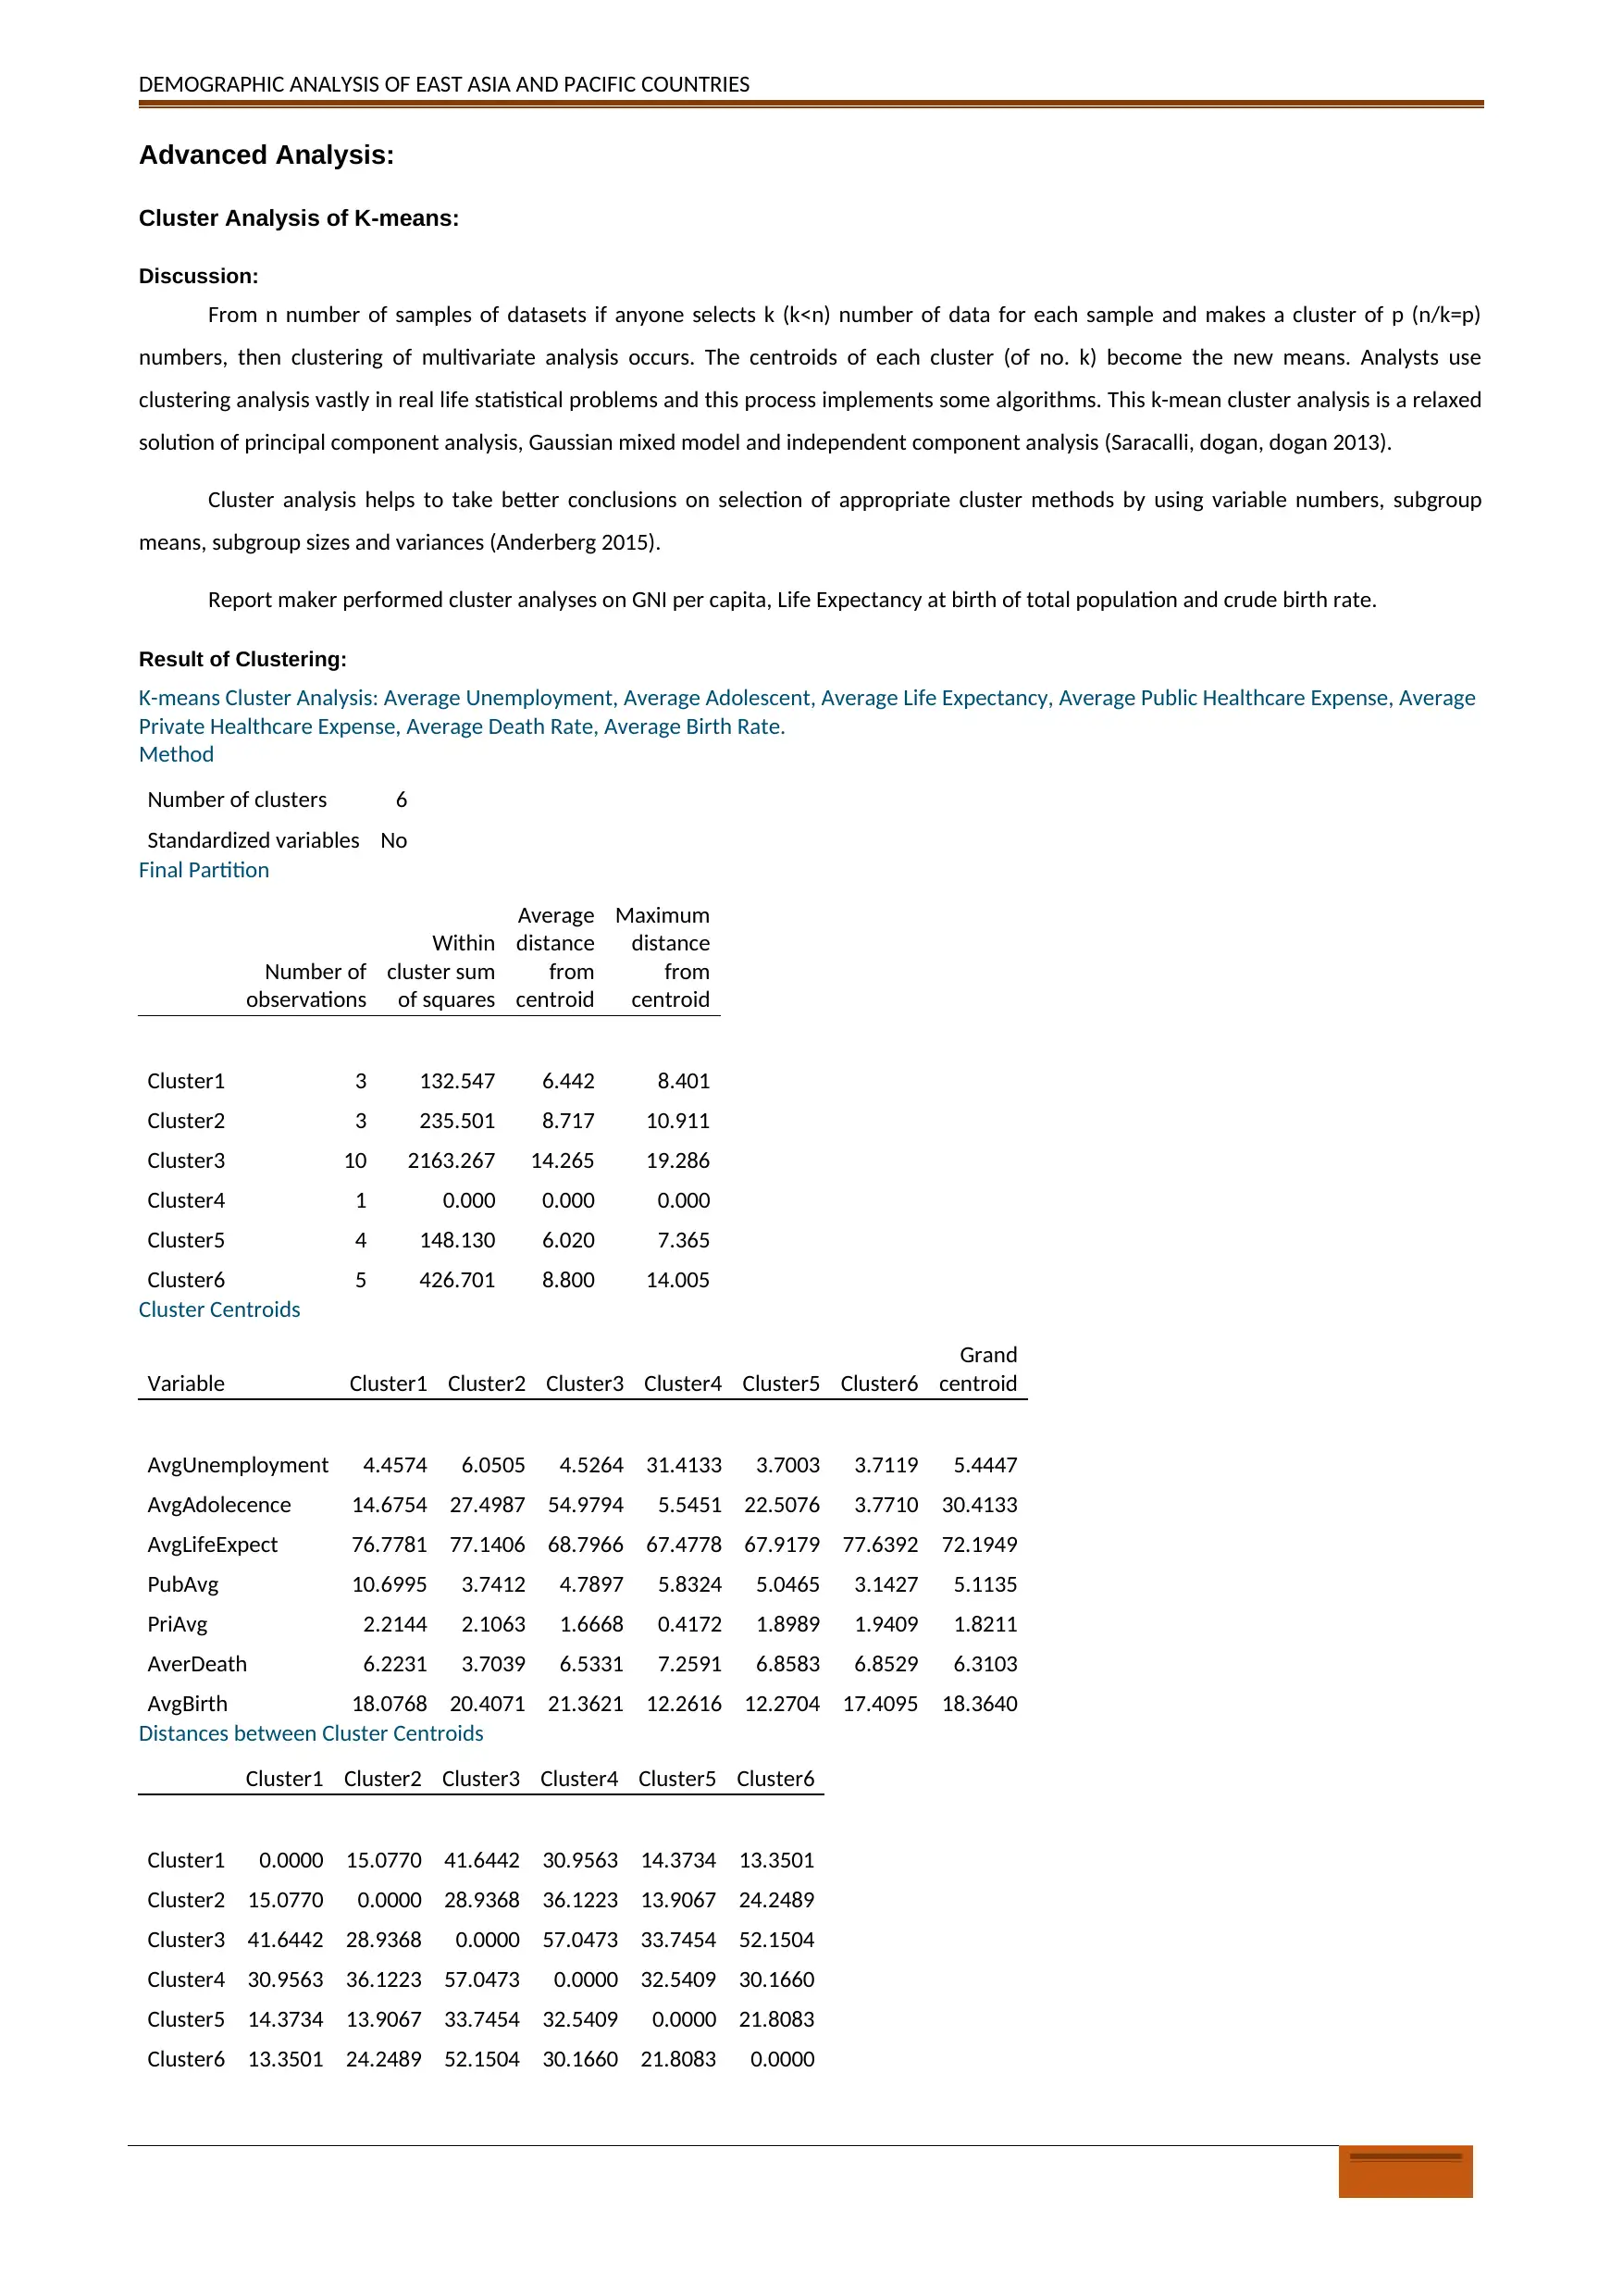
Result of Clustering:
K-means Cluster Analysis: Average Unemployment, Average Adolescent, Average Life Expectancy, Average Public Healthcare Expense, Average
Private Healthcare Expense, Average Death Rate, Average Birth Rate.
Method
Number of clusters 6
Standardized variables No
Final Partition
Number of
observations
Within
cluster sum
of squares
Average
distance
from
centroid
Maximum
distance
from
centroid
Cluster1 3 132.547 6.442 8.401
Cluster2 3 235.501 8.717 10.911
Cluster3 10 2163.267 14.265 19.286
Cluster4 1 0.000 0.000 0.000
Cluster5 4 148.130 6.020 7.365
Cluster6 5 426.701 8.800 14.005
Cluster Centroids
Variable Cluster1 Cluster2 Cluster3 Cluster4 Cluster5 Cluster6
Grand
centroid
AvgUnemployment 4.4574 6.0505 4.5264 31.4133 3.7003 3.7119 5.4447
AvgAdolecence 14.6754 27.4987 54.9794 5.5451 22.5076 3.7710 30.4133
AvgLifeExpect 76.7781 77.1406 68.7966 67.4778 67.9179 77.6392 72.1949
PubAvg 10.6995 3.7412 4.7897 5.8324 5.0465 3.1427 5.1135
PriAvg 2.2144 2.1063 1.6668 0.4172 1.8989 1.9409 1.8211
AverDeath 6.2231 3.7039 6.5331 7.2591 6.8583 6.8529 6.3103
AvgBirth 18.0768 20.4071 21.3621 12.2616 12.2704 17.4095 18.3640
Distances between Cluster Centroids
Cluster1 Cluster2 Cluster3 Cluster4 Cluster5 Cluster6
Cluster1 0.0000 15.0770 41.6442 30.9563 14.3734 13.3501
Cluster2 15.0770 0.0000 28.9368 36.1223 13.9067 24.2489
Cluster3 41.6442 28.9368 0.0000 57.0473 33.7454 52.1504
Cluster4 30.9563 36.1223 57.0473 0.0000 32.5409 30.1660
Cluster5 14.3734 13.9067 33.7454 32.5409 0.0000 21.8083
Cluster6 13.3501 24.2489 52.1504 30.1660 21.8083 0.0000
Advanced Analysis:
Cluster Analysis of K-means:
Discussion:
From n number of samples of datasets if anyone selects k (k<n) number of data for each sample and makes a cluster of p (n/k=p)
numbers, then clustering of multivariate analysis occurs. The centroids of each cluster (of no. k) become the new means. Analysts use
clustering analysis vastly in real life statistical problems and this process implements some algorithms. This k-mean cluster analysis is a relaxed
solution of principal component analysis, Gaussian mixed model and independent component analysis (Saracalli, dogan, dogan 2013).
Cluster analysis helps to take better conclusions on selection of appropriate cluster methods by using variable numbers, subgroup
means, subgroup sizes and variances (Anderberg 2015).
Report maker performed cluster analyses on GNI per capita, Life Expectancy at birth of total population and crude birth rate.
Result of Clustering:
K-means Cluster Analysis: Average Unemployment, Average Adolescent, Average Life Expectancy, Average Public Healthcare Expense, Average
Private Healthcare Expense, Average Death Rate, Average Birth Rate.
Method
Number of clusters 6
Standardized variables No
Final Partition
Number of
observations
Within
cluster sum
of squares
Average
distance
from
centroid
Maximum
distance
from
centroid
Cluster1 3 132.547 6.442 8.401
Cluster2 3 235.501 8.717 10.911
Cluster3 10 2163.267 14.265 19.286
Cluster4 1 0.000 0.000 0.000
Cluster5 4 148.130 6.020 7.365
Cluster6 5 426.701 8.800 14.005
Cluster Centroids
Variable Cluster1 Cluster2 Cluster3 Cluster4 Cluster5 Cluster6
Grand
centroid
AvgUnemployment 4.4574 6.0505 4.5264 31.4133 3.7003 3.7119 5.4447
AvgAdolecence 14.6754 27.4987 54.9794 5.5451 22.5076 3.7710 30.4133
AvgLifeExpect 76.7781 77.1406 68.7966 67.4778 67.9179 77.6392 72.1949
PubAvg 10.6995 3.7412 4.7897 5.8324 5.0465 3.1427 5.1135
PriAvg 2.2144 2.1063 1.6668 0.4172 1.8989 1.9409 1.8211
AverDeath 6.2231 3.7039 6.5331 7.2591 6.8583 6.8529 6.3103
AvgBirth 18.0768 20.4071 21.3621 12.2616 12.2704 17.4095 18.3640
Distances between Cluster Centroids
Cluster1 Cluster2 Cluster3 Cluster4 Cluster5 Cluster6
Cluster1 0.0000 15.0770 41.6442 30.9563 14.3734 13.3501
Cluster2 15.0770 0.0000 28.9368 36.1223 13.9067 24.2489
Cluster3 41.6442 28.9368 0.0000 57.0473 33.7454 52.1504
Cluster4 30.9563 36.1223 57.0473 0.0000 32.5409 30.1660
Cluster5 14.3734 13.9067 33.7454 32.5409 0.0000 21.8083
Cluster6 13.3501 24.2489 52.1504 30.1660 21.8083 0.0000
⊘ This is a preview!⊘
Do you want full access?
Subscribe today to unlock all pages.
Trusted by 1+ million students worldwide
1 out of 19
Related Documents


Your All-in-One AI-Powered Toolkit for Academic Success.
+13062052269
info@desklib.com
Available 24*7 on WhatsApp / Email
![[object Object]](/_next/static/media/star-bottom.7253800d.svg)
Unlock your academic potential
Copyright © 2020–2026 A2Z Services. All Rights Reserved. Developed and managed by ZUCOL.