logo

Analysis of Demographic Data and Anthropometric Measurements of Female Students in Different Programs

The assignment involves analyzing the age distribution and anthropometric measurements of students in different programs, including Doctor of Chiropractic, nutrition, and non-health related majors.

16 Pages2025 Words153 Views
   

Added on  2023-04-25

About This Document

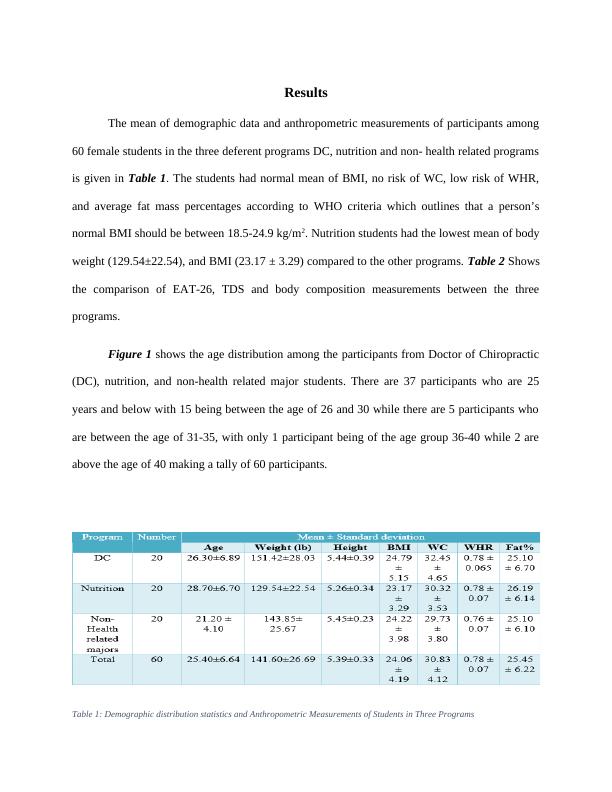
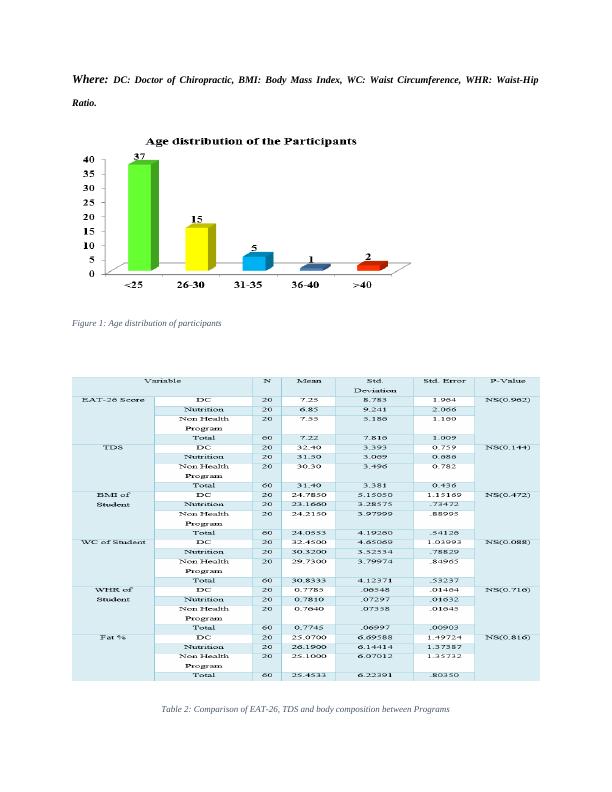
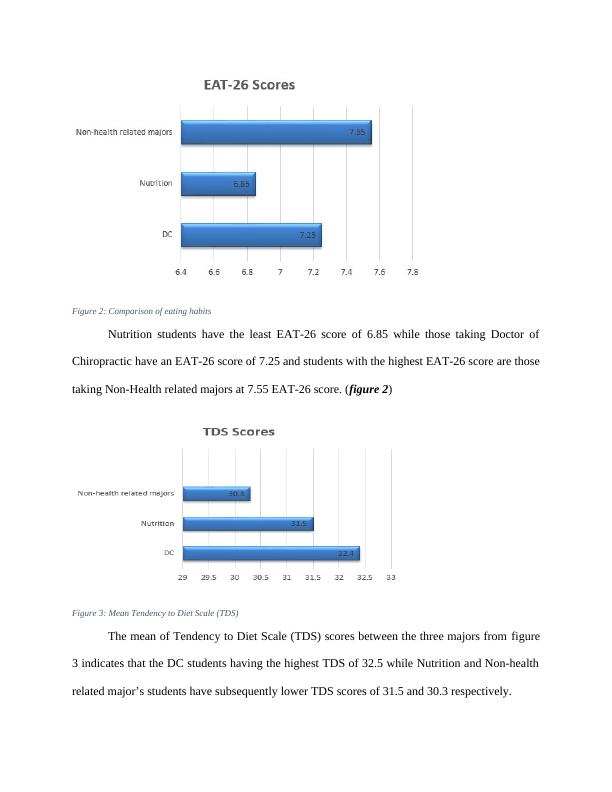
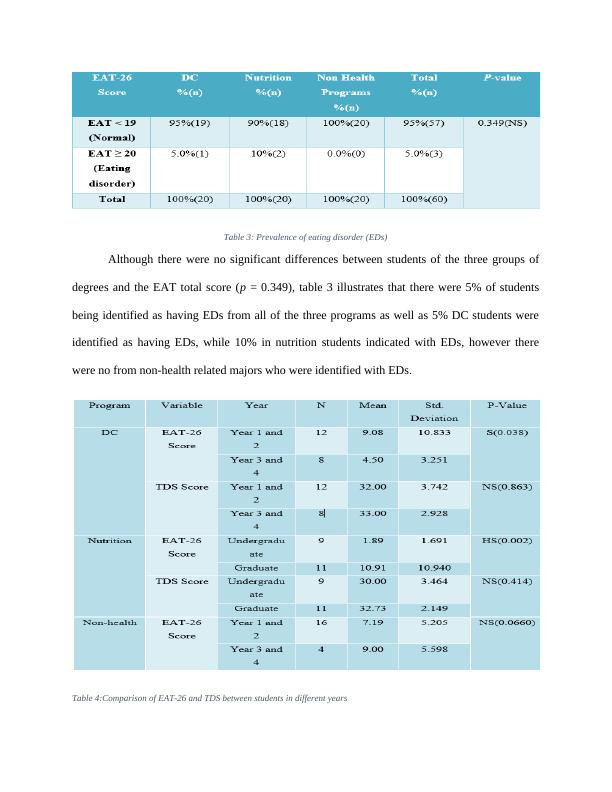
This study analyzes the demographic data and anthropometric measurements of female students in different programs. It includes tables and figures that show the mean of BMI, EAT-26, TDS, and body composition measurements between the three programs. The study also examines the prevalence of eating disorders and the correlation between body composition measurements, EAT-26, and TDS scores.

Analysis of Demographic Data and Anthropometric Measurements of Female Students in Different Programs

The assignment involves analyzing the age distribution and anthropometric measurements of students in different programs, including Doctor of Chiropractic, nutrition, and non-health related majors.

   Added on 2023-04-25

ShareRelated Documents
Results
The mean of demographic data and anthropometric measurements of participants among
60 female students in the three deferent programs DC, nutrition and non- health related programs
is given in Table 1. The students had normal mean of BMI, no risk of WC, low risk of WHR,
and average fat mass percentages according to WHO criteria which outlines that a person’s
normal BMI should be between 18.5-24.9 kg/m2. Nutrition students had the lowest mean of body
weight (129.54±22.54), and BMI (23.17 ± 3.29) compared to the other programs. Table 2 Shows
the comparison of EAT-26, TDS and body composition measurements between the three
programs.
Figure 1 shows the age distribution among the participants from Doctor of Chiropractic
(DC), nutrition, and non-health related major students. There are 37 participants who are 25
years and below with 15 being between the age of 26 and 30 while there are 5 participants who
are between the age of 31-35, with only 1 participant being of the age group 36-40 while 2 are
above the age of 40 making a tally of 60 participants.
Table 1: Demographic distribution statistics and Anthropometric Measurements of Students in Three Programs
Analysis of Demographic Data and Anthropometric Measurements of Female Students in Different Programs_1
Where: DC: Doctor of Chiropractic, BMI: Body Mass Index, WC: Waist Circumference, WHR: Waist-Hip
Ratio.
Figure 1: Age distribution of participants
Table 2: Comparison of EAT-26, TDS and body composition between Programs
Analysis of Demographic Data and Anthropometric Measurements of Female Students in Different Programs_2
Figure 2: Comparison of eating habits
Nutrition students have the least EAT-26 score of 6.85 while those taking Doctor of
Chiropractic have an EAT-26 score of 7.25 and students with the highest EAT-26 score are those
taking Non-Health related majors at 7.55 EAT-26 score. (figure 2)
Figure 3: Mean Tendency to Diet Scale (TDS)
The mean of Tendency to Diet Scale (TDS) scores between the three majors from figure
3 indicates that the DC students having the highest TDS of 32.5 while Nutrition and Non-health
related major’s students have subsequently lower TDS scores of 31.5 and 30.3 respectively.
Analysis of Demographic Data and Anthropometric Measurements of Female Students in Different Programs_3
Table 3: Prevalence of eating disorder (EDs)
Although there were no significant differences between students of the three groups of
degrees and the EAT total score (p = 0.349), table 3 illustrates that there were 5% of students
being identified as having EDs from all of the three programs as well as 5% DC students were
identified as having EDs, while 10% in nutrition students indicated with EDs, however there
were no from non-health related majors who were identified with EDs.
Table 4:Comparison of EAT-26 and TDS between students in different years
Analysis of Demographic Data and Anthropometric Measurements of Female Students in Different Programs_4

End of preview

Want to access all the pages? Upload your documents or become a member.

Related Documents
Comparison of Low and High-Carbohydrate Diets for Type 2 Diabetes Management: A Randomized Trial
|15
|3814
|199