Deakin University MIS771 Descriptive Analytics Assignment Report
VerifiedAdded on 2022/09/21
|12
|1725
|16
Report
AI Summary
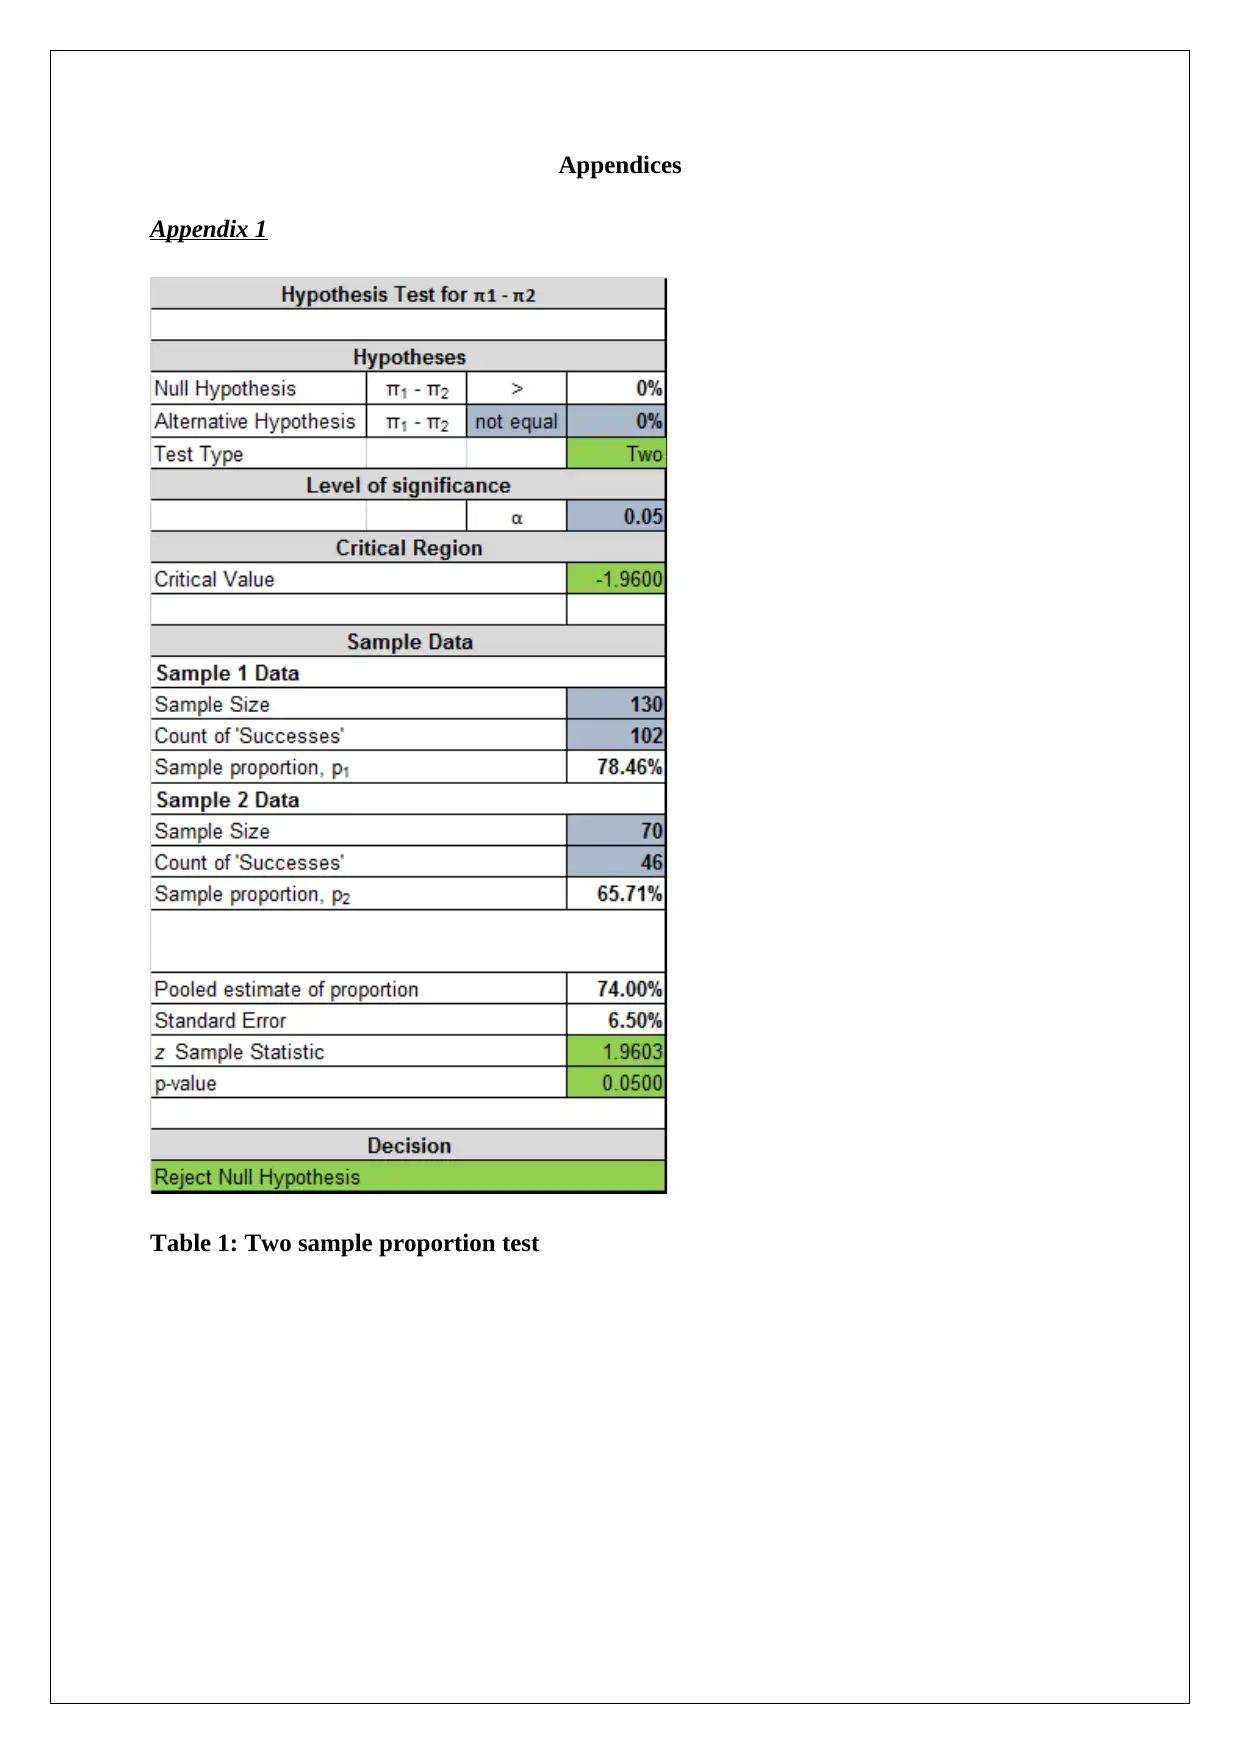
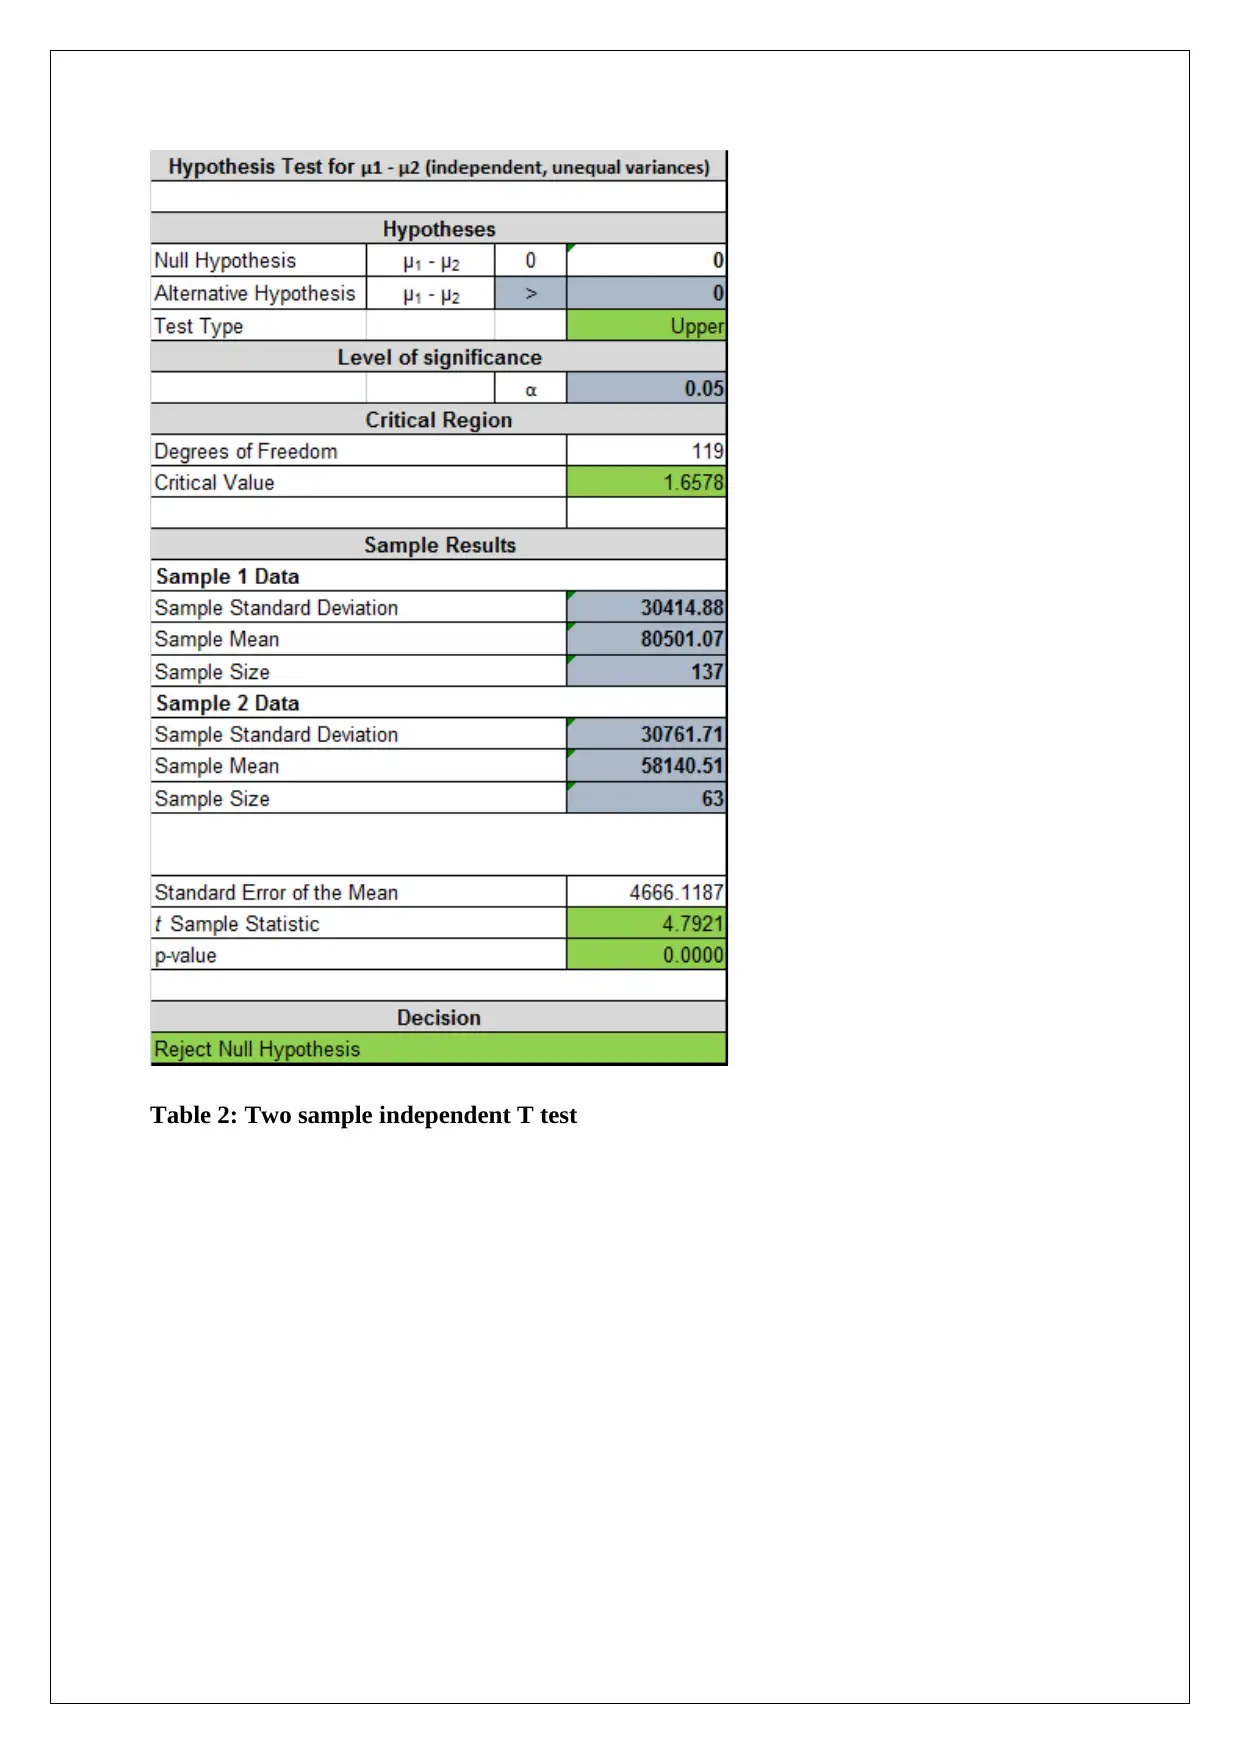
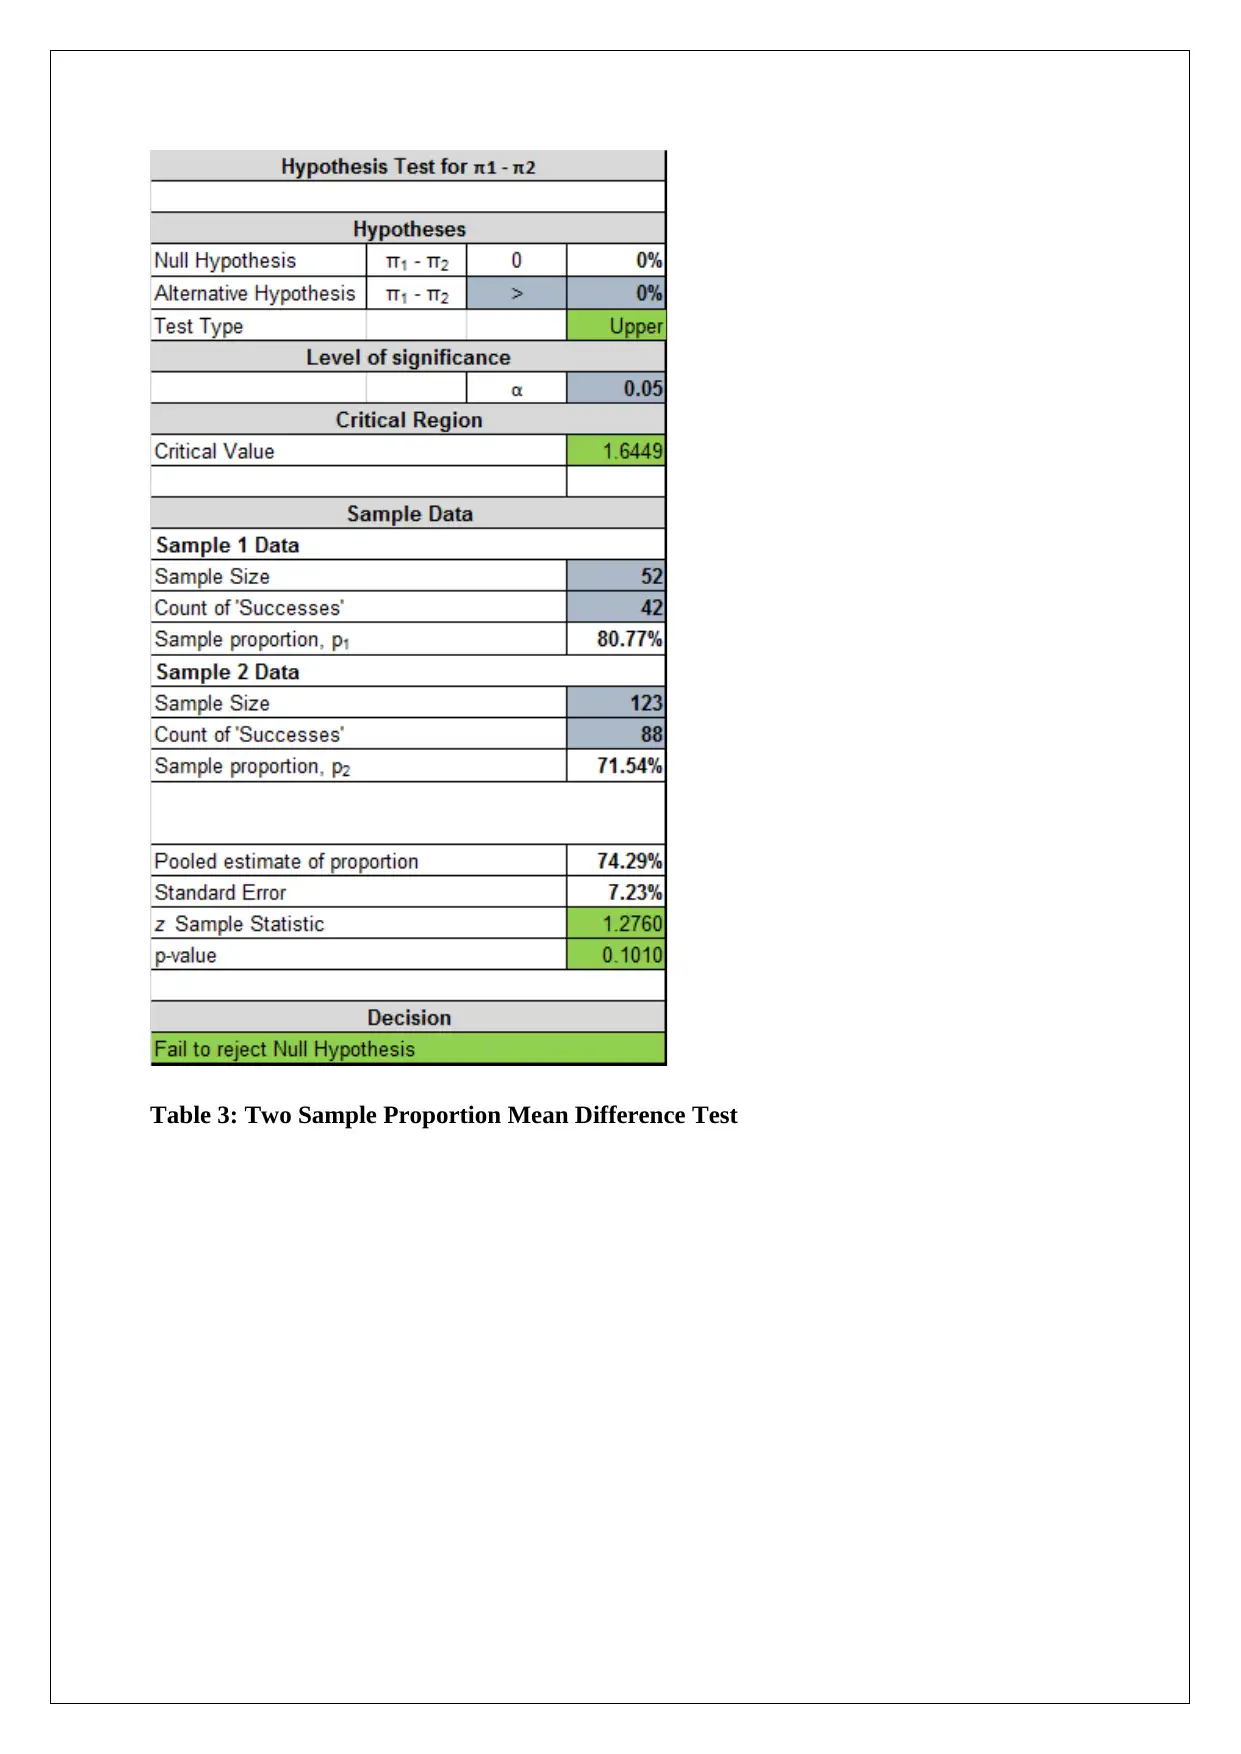
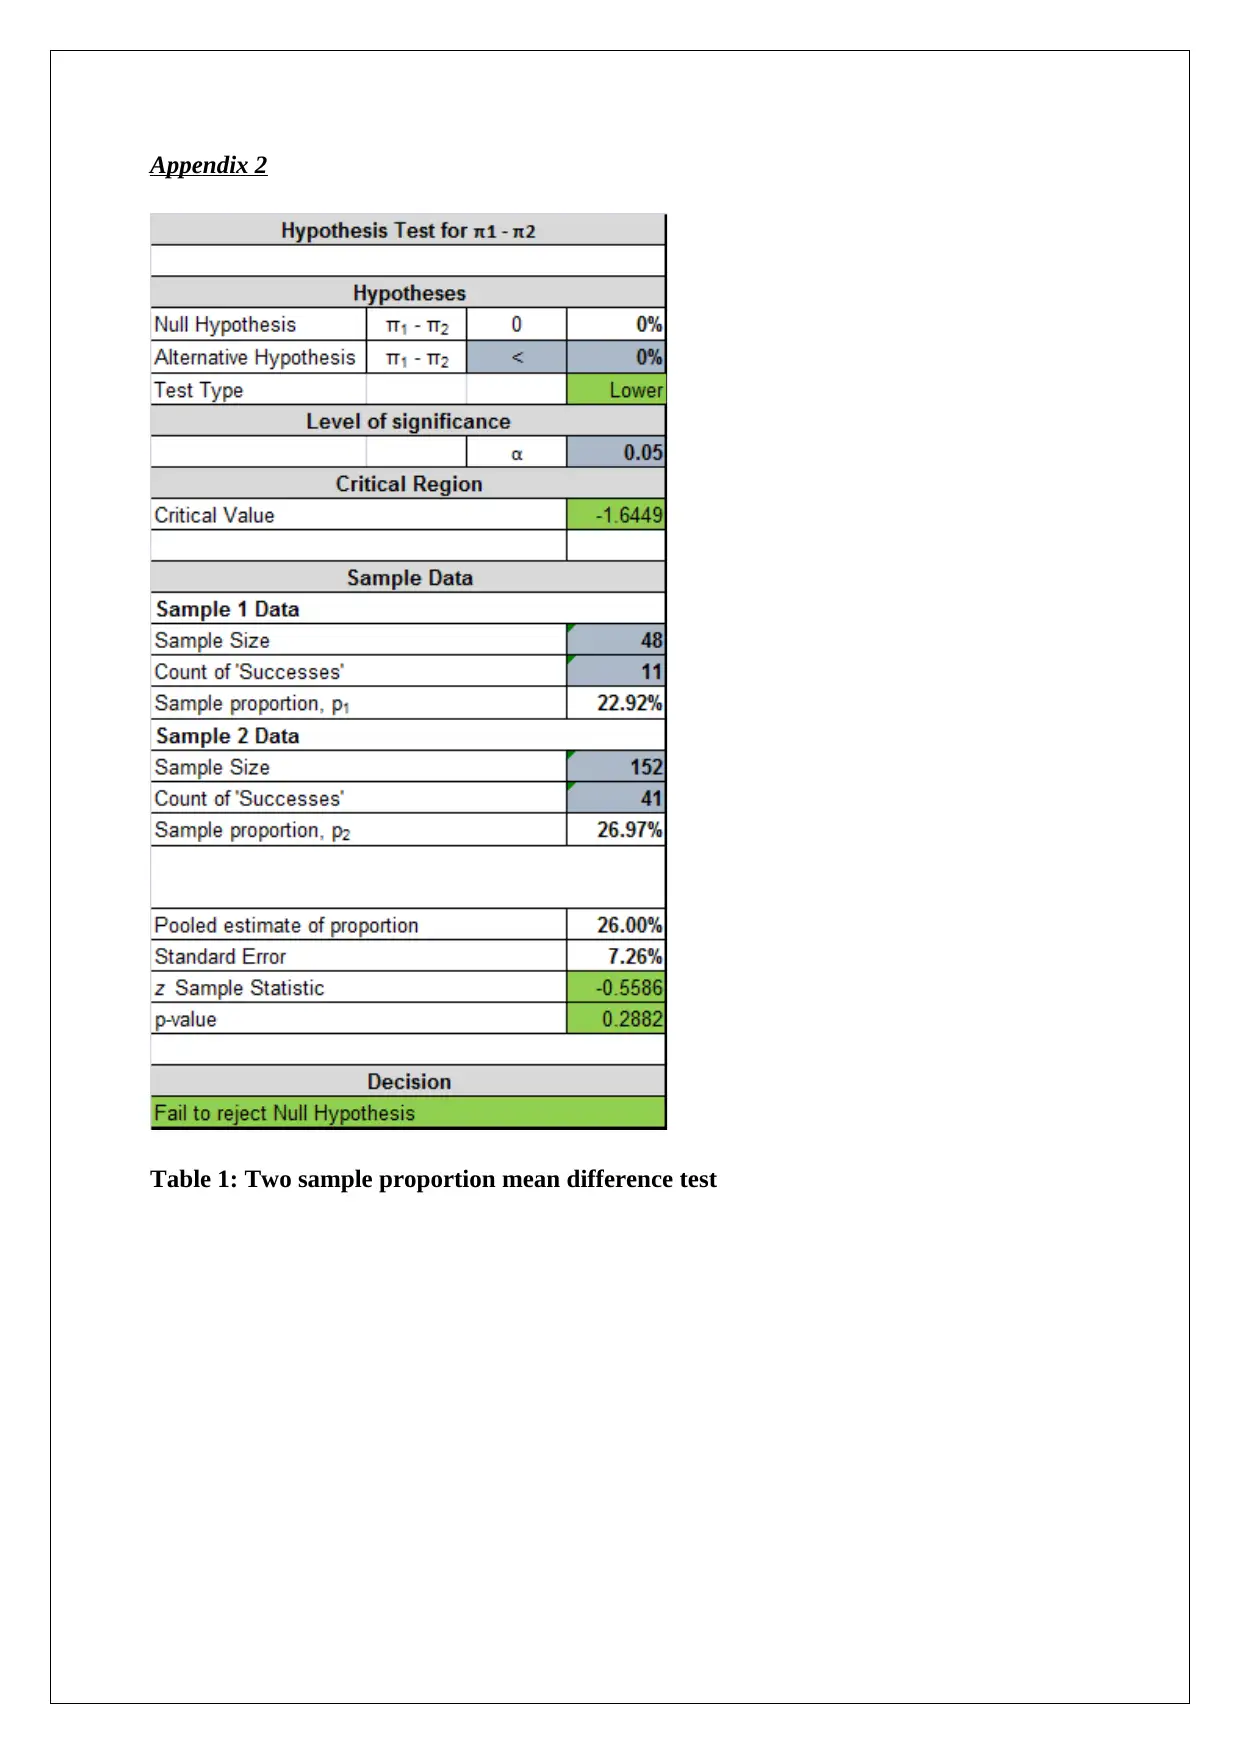
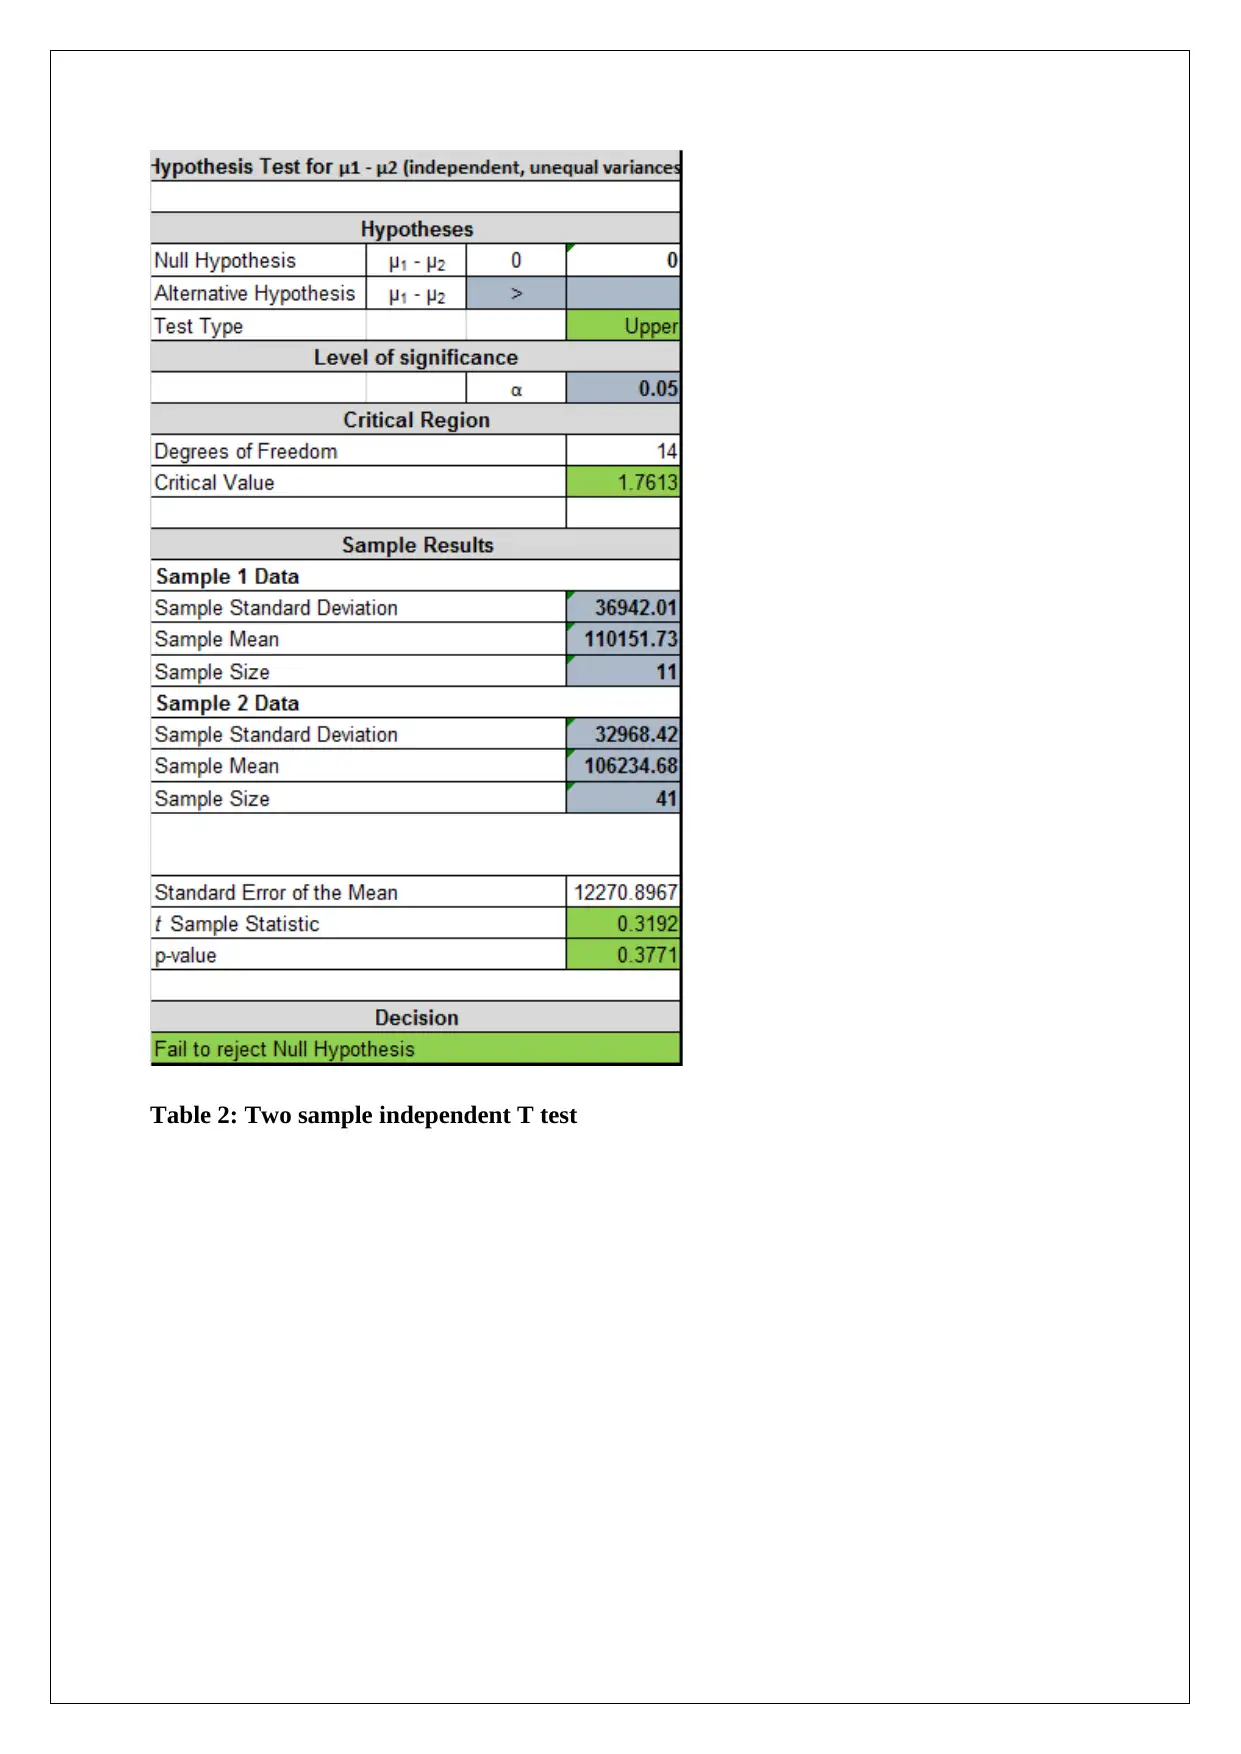
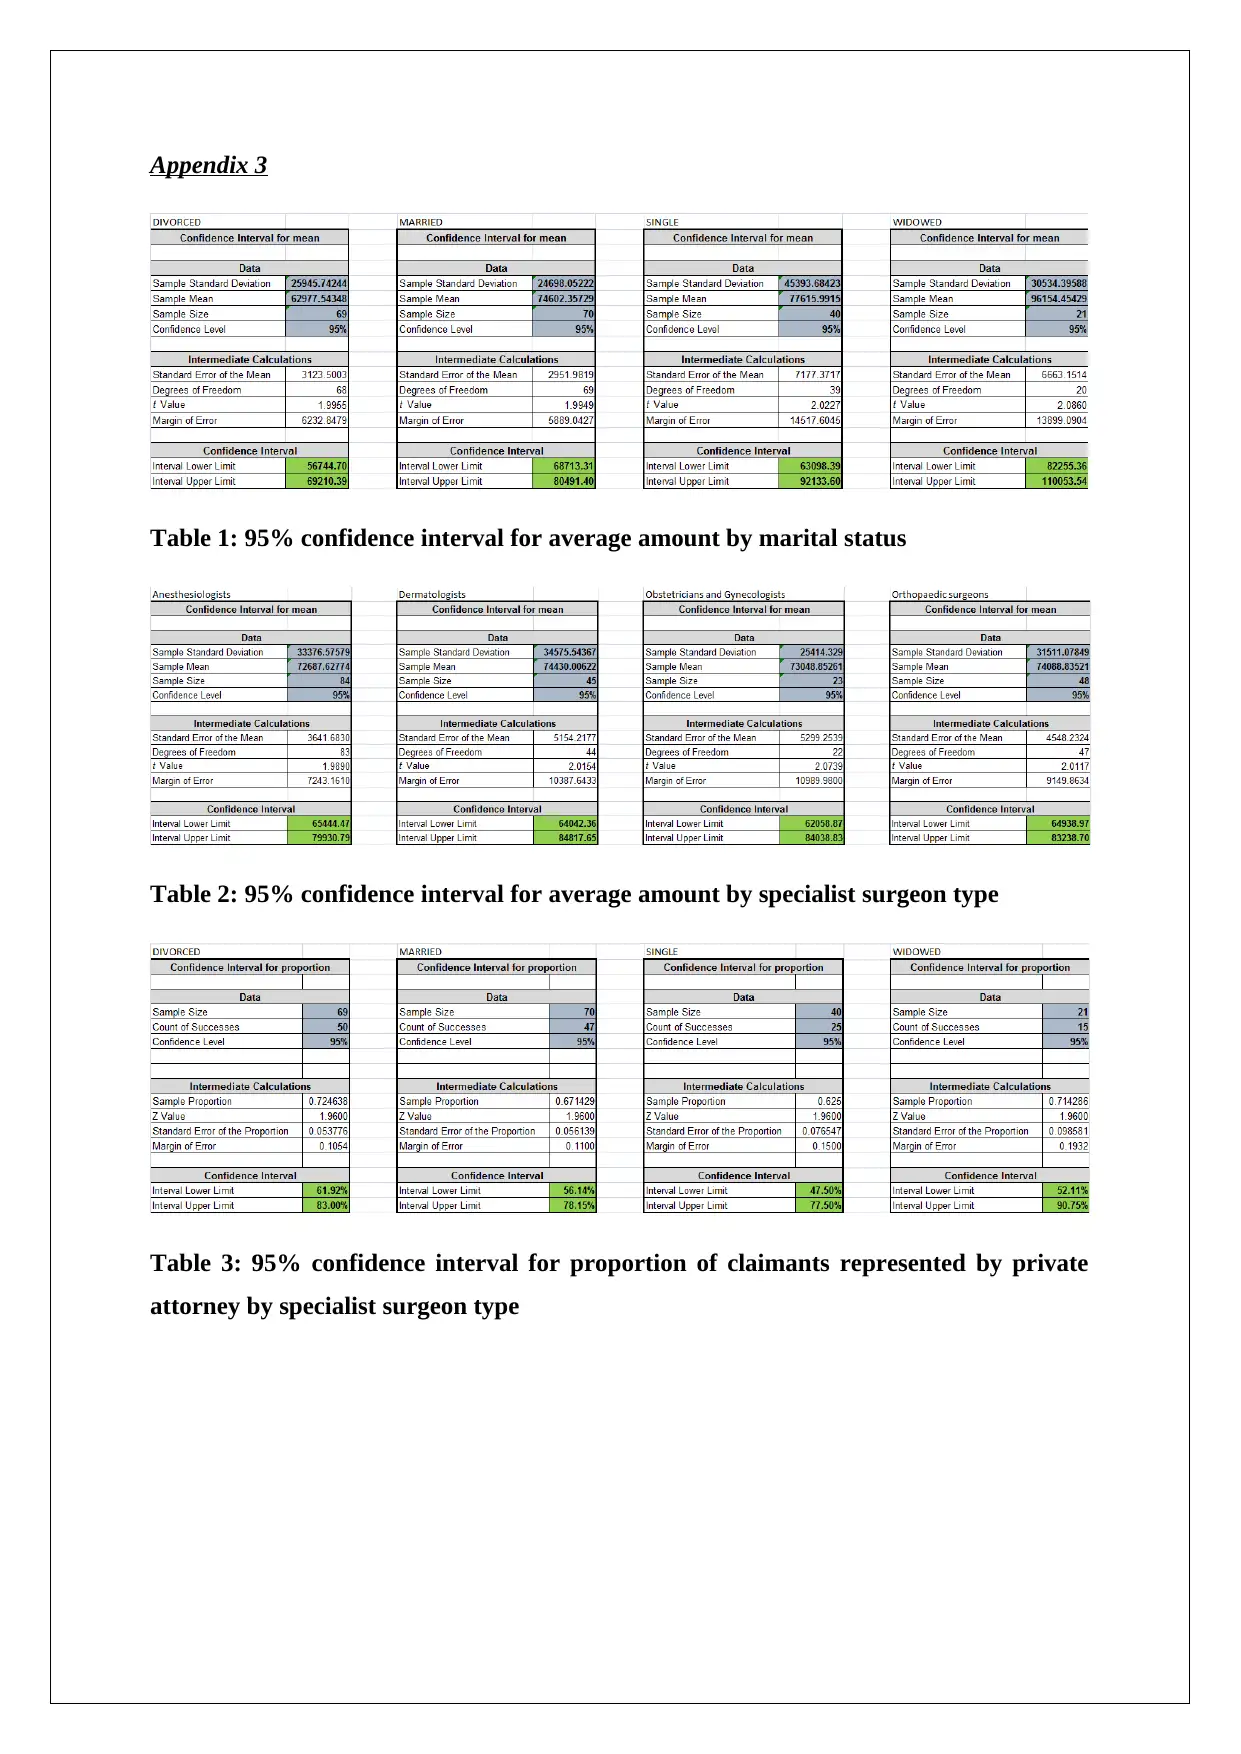
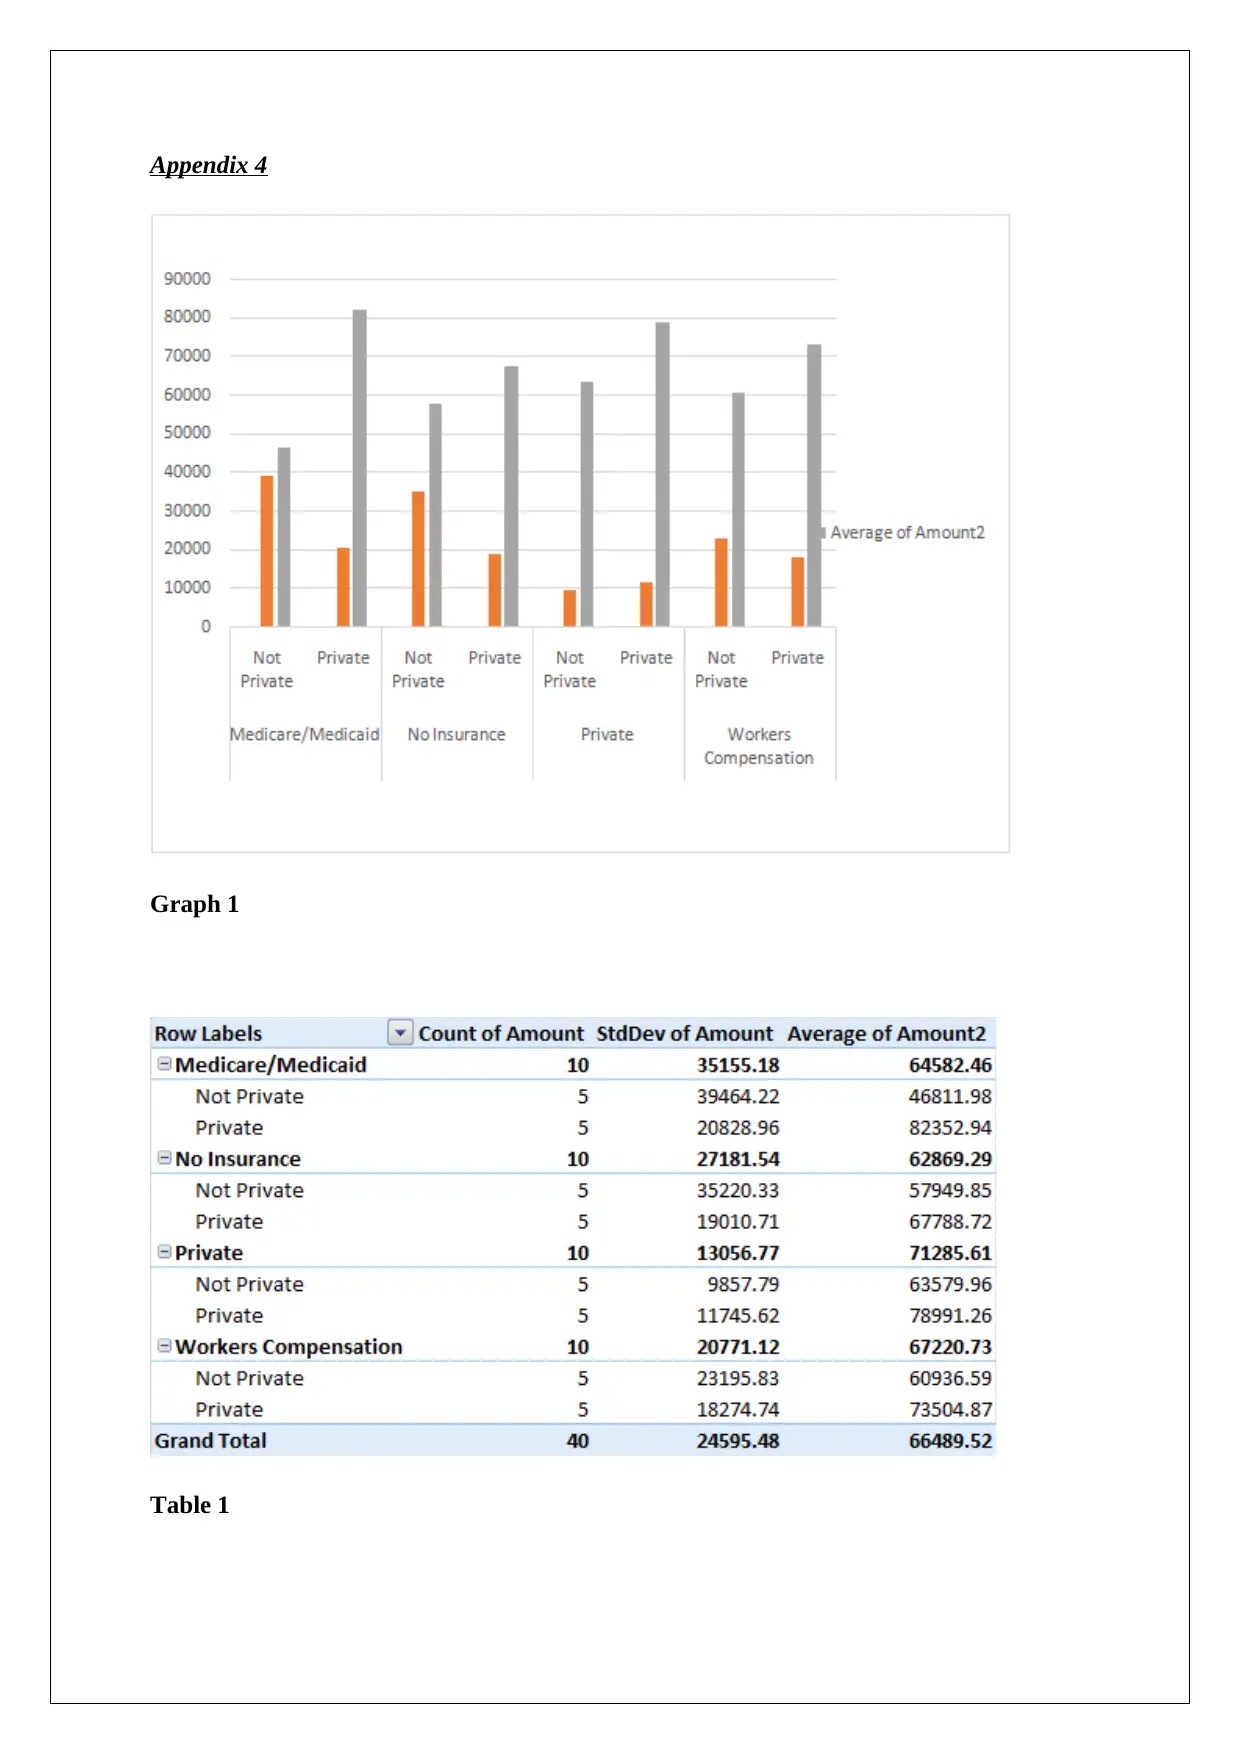
This report presents the findings of a descriptive analytics assignment, analyzing a sample dataset of 200 individuals to address questions related to insurance claims. The analysis employs descriptive and inferential statistical tools, including two-sample proportion tests, two-sample independent t-tests, and confidence intervals, to derive conclusions about the population. The report investigates claims regarding gender differences in claim severity, the impact of private attorney representation on claim amounts, and the relationship between attorney representation and claim severity. It also examines the influence of surgeon specialization and marital status on claim amounts and attorney representation. The analysis includes the creation of pivot tables and graphs to visualize the data. The report concludes with a discussion of the findings, limitations, and the importance of timely data analysis, along with appendices containing supporting tables and graphs. The report aims to provide insights into the factors influencing claim amounts and attorney representation within the given dataset.
1 out of 12
Related Documents


Your All-in-One AI-Powered Toolkit for Academic Success.
+13062052269
info@desklib.com
Available 24*7 on WhatsApp / Email
![[object Object]](/_next/static/media/star-bottom.7253800d.svg)
Copyright © 2020–2026 A2Z Services. All Rights Reserved. Developed and managed by ZUCOL.