Ask a question from expert
Descriptive Analytics and Visualization : Assignment
21 Pages3008 Words296 Views
Added on 2020-11-12
Descriptive Analytics and Visualization : Assignment
Added on 2020-11-12
BookmarkShareRelated Documents
Descriptive Analytics and Visualization
TABLE OF CONTENTSINTRODUCTION...........................................................................................................................41...................................................................................................................................................42...................................................................................................................................................52.1 Sports.....................................................................................................................................52.2 Luxury....................................................................................................................................63. Descriptive statistics of savings ..............................................................................................64. .................................................................................................................................................75. .................................................................................................................................................76...................................................................................................................................................87...................................................................................................................................................8Urban population ........................................................................................................................98.................................................................................................................................................11APPENDIX....................................................................................................................................131.................................................................................................................................................132.................................................................................................................................................132.1..............................................................................................................................................143.................................................................................................................................................155.................................................................................................................................................167.a...............................................................................................................................................187.2..............................................................................................................................................20

INTRODUCTIONDescriptive analytic and visualization plays very efficient role for analyzing any specificdata set along with proper interpretation and conclusion. The present report would be conveyingits findings with proper understanding. It would be also articulating proper application ofquantitative reasoning skills for the purpose of solving various complex problems. In the sameseries, it would be also justifying various technologies for finding and disseminate information.Further it had articulated different solutions for problems which are authentic. It had alsoreflected understanding on data analysis which is contemporary and tools of visualization forrecognizing information of these tools. It would be using various tools from excel and SPSS withpreoper calculations.1.Assessment of insurance claims condition Row LabelsCount of Savingsworse off (<0)72No better off (0)25Better off (>1)303Grand Total400Proportions Row LabelsCount of Savingsworse off (<0)72 / 400 * 100 = 18%No better off (0)25 / 400 * 100 = 6%Better off (>1)303 / 400 * 100 = 76%Grand Total400 Quartile 112Quartile 3357inter-quartile range345Lower Fence -505.5
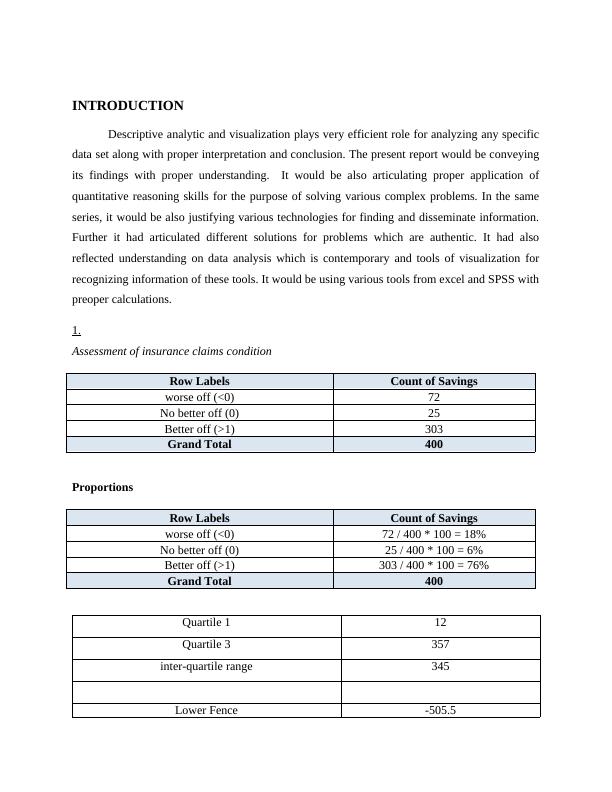
Upper Fence 874.5Interpretation: The above table is assessing the condition who had claimed insurance inworsen off aspect. There has been presentation of each proportion from sample of 400 in whichmajor quantity had been gained by better off then followed by worsen off and no better off. Inthe table one it had assessed appropriate count and in next table there is presentation ofcalculation of proportion of all three factors. Among 400, 72 people were not affected by carinsurance whose proportion is of 18%.In the same series it had reflected its descriptive statistics with various factors such asmean and all. Its average had been extracted as 229.64 with standard error of 16.03. It haddetermined from range of 2043 where minimum is -87 and maximum is 1956. Further, theimportant reflection is of standard deviation as 320.56 and its variance had been identified as102759.59. While, analyzing its inter-quartile range which had been justified from Q1 and Q3 as12 and 357 respectively. There is calculation of upper and lower fence for identifying its outlierswhich is directly linked to quartiles with context of specific data set.2.Sports vehicle type Interpretation: The above analysis is giving description about savings of customer whouse sports vehicles as it is indicating mean of sports vehicle among population of 49. There ispresence of minimum saving of $156.It had been estimated that average of $692 which had beensaved by various people.2.1 SportsIt has determined its accuracy of population who are using luxury vehicles with 60.76 asstandard error. It had elaborated its average as 692.75 with standard deviation of 425.32 which isvery close to its data set. There is presence of sample variance with 180902.11 with Kurtosis,Skewness and range of 1.27, 1.2735 and 1800 respectively. Its count is of 49 with Q1 as 373 andQ3 as 850. These quartile has helped in identifying lower and upper fence with tukey rule as -342.5 and 1565.5 respectively.
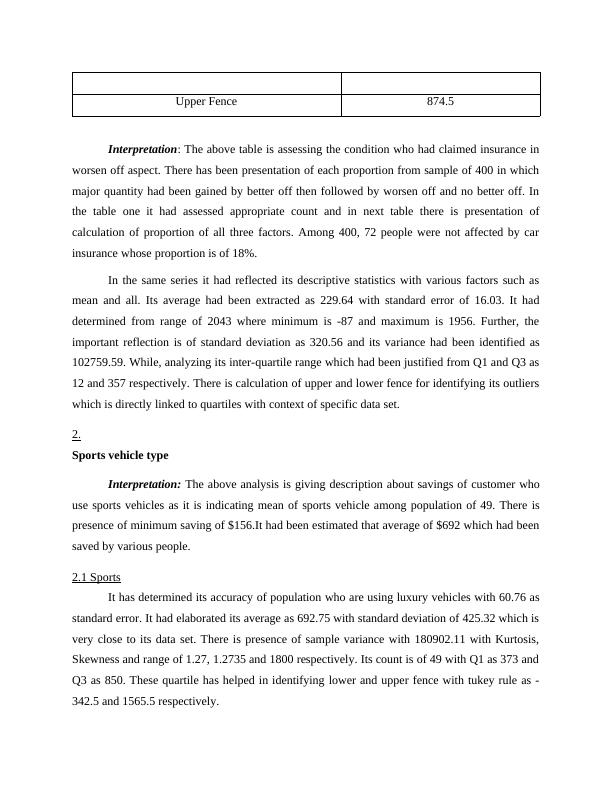
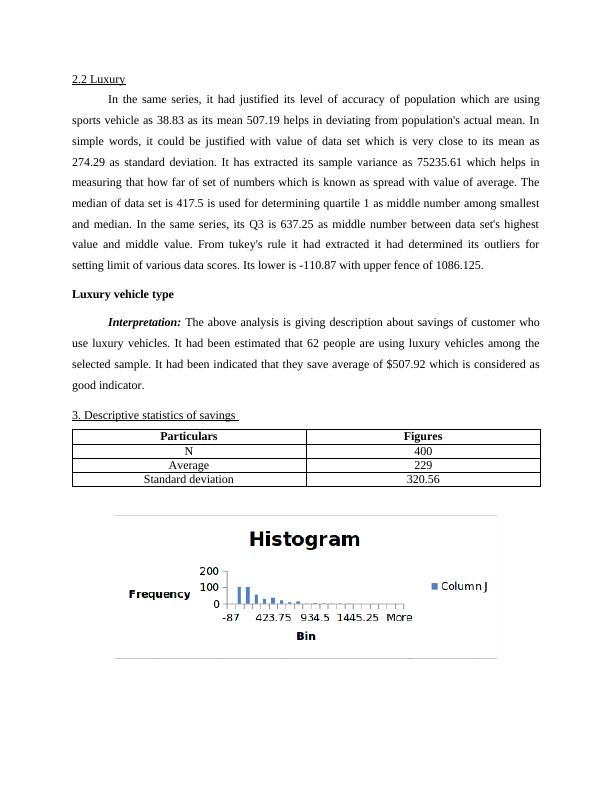
2.2 LuxuryIn the same series, it had justified its level of accuracy of population which are usingsports vehicle as 38.83 as its mean 507.19 helps in deviating from population's actual mean. Insimple words, it could be justified with value of data set which is very close to its mean as274.29 as standard deviation. It has extracted its sample variance as 75235.61 which helps inmeasuring that how far of set of numbers which is known as spread with value of average. Themedian of data set is 417.5 is used for determining quartile 1 as middle number among smallestand median. In the same series, its Q3 is 637.25 as middle number between data set's highestvalue and middle value. From tukey's rule it had extracted it had determined its outliers forsetting limit of various data scores. Its lower is -110.87 with upper fence of 1086.125.Luxury vehicle type Interpretation: The above analysis is giving description about savings of customer whouse luxury vehicles. It had been estimated that 62 people are using luxury vehicles among theselected sample. It had been indicated that they save average of $507.92 which is considered asgood indicator.3. Descriptive statistics of savings ParticularsFiguresN400Average229Standard deviation320.56
End of preview
Want to access all the pages? Upload your documents or become a member.
Related Documents
Descriptive Analytics and Visualizationlg...
|8
|987
|57