Descriptive Analytics and Visualization Report for Furphy Beer
VerifiedAdded on 2019/11/26
|16
|3327
|337
Report
AI Summary
This report presents a descriptive analytics and visualization analysis of Furphy Beer, a micro-brewery organization. The study, commissioned by Beautiful Data, examines customer attributes and repurchasing intentions based on a survey of 200 clients. The analysis, conducted using MS Excel, explores the influence of factors such as customer loyalty, distribution channels, product quality, and brand image on repurchasing intentions and recommendations. Regression analysis identifies significant variables, revealing that loyalty, distribution channel, product quality, and brand image strongly influence repurchasing decisions. The report also includes an ANOVA table and regression outputs to support the findings, predicting repurchasing intentions with 44% accuracy. Furthermore, the analysis explores the relationship between brand image, product quality, and recommendation likelihood, providing insights to Furphy for improving customer relationships and market strategies. The report concludes with recommendations based on these findings.
Running Head: DESCRIPTIVE ANALYTICS AND VISUALIZATION
MIS771
Descriptive Analytics and Visualization
Name of the Student
Name of the University
Author Note
MIS771
Descriptive Analytics and Visualization
Name of the Student
Name of the University
Author Note
Paraphrase This Document
Need a fresh take? Get an instant paraphrase of this document with our AI Paraphraser
1DESCRIPTIVE ANALYTICS AND VISUALIZATION
Table of Contents
1. Introduction..................................................................................................................................2
2. Collection of Data........................................................................................................................3
3. Description of the Data................................................................................................................3
4. Analysis of the Data.....................................................................................................................3
4.1 Dependent Variable Analysis................................................................................................3
4.2 Factors Influencing Repurchasing Intention..........................................................................5
4.2.1 Variable Identification....................................................................................................5
4.2.2 Prediction of Repurchasing Intention.............................................................................7
4.2.3 Different Analysis...........................................................................................................8
4.3 Furphy Recommendation.......................................................................................................9
4.4 Analysis based on Time Series............................................................................................11
5. Recommendations and Conclusion............................................................................................11
REFERENCES..............................................................................................................................13
APPENDICES...............................................................................................................................14
2DESCRIPTIVE ANALYTICS AND VISUALIZATION
1. Introduction
Furphy Beer is a micro-brewery organization which started in Australia. The organization
is a new organization with under 15 years of involvement in the brewing ale. The production and
sales of the organization is restricted in the city of Melbourne and reginal Victoria. The sales and
production is expanding quickly in the various parts of Australia. Over the most recent two years
critical development in the sales and production have been taken note. The demand of the
organization has been expanding such a great amount of that in the year 2016 they chose to build
the creation to 3 million liters for each year keeping in mind the end goal to adapt up to the
expanding interest of the item.
There are two market segments,which purchase the Furphy pale ale. One is pubs, bars
and restaurants and the other is bottleshops. The ale created by Furphy are sold in these two
markets either specifically or with the assistance of sales agents.
The organization has encountered gigantic accomplishment in their operations and money
related turnovers in the past two years. At that point additionally, the organization can detect an
adjustment in the business atmosphere in the up and coming five years. This can be the result of
the high popularity of craft beer and microbrewery culture in Victoria and its encompassing
locales. In this manner, with the expansion in the opposition, the organization has felt the need of
building a solid association with the clients. Accordingly, to comprehend and recognize the
components that are dependable to fabricate a solid client relationship the organization has
delegated a statistical surveying organization named Beautiful Data. The have been made a
request to lead a vast scale study of the customers of the organization to have a reasonable
comprehension of the customers attributes and their repurchasing expectations.
⊘ This is a preview!⊘
Do you want full access?
Subscribe today to unlock all pages.
Trusted by 1+ million students worldwide
3DESCRIPTIVE ANALYTICS AND VISUALIZATION
2. Collection of Data
To meet the criteria provided by Furphy, the market research company Beautiful Data
made contacts with Furphy’s clients and asked them to fill up an online survey. The survey
questionnaire contained various factors necessary for the calculation. The data on the past years
sales in the four quarters per year have been collected from the information stored and compiled
through Furphy’sdatamart.
3. Description of the Data
The data collected from 200 clients of the company has 9 different perceptions of the
customers or clients. These perceptions have been recorded in a scale of 1 – 10. Other variables
give qualitative information about the outcomes of the purchases by the clients and their business
relationship with the respective clients. The analysis has been done using the MS Excel software.
4. Analysis of the Data
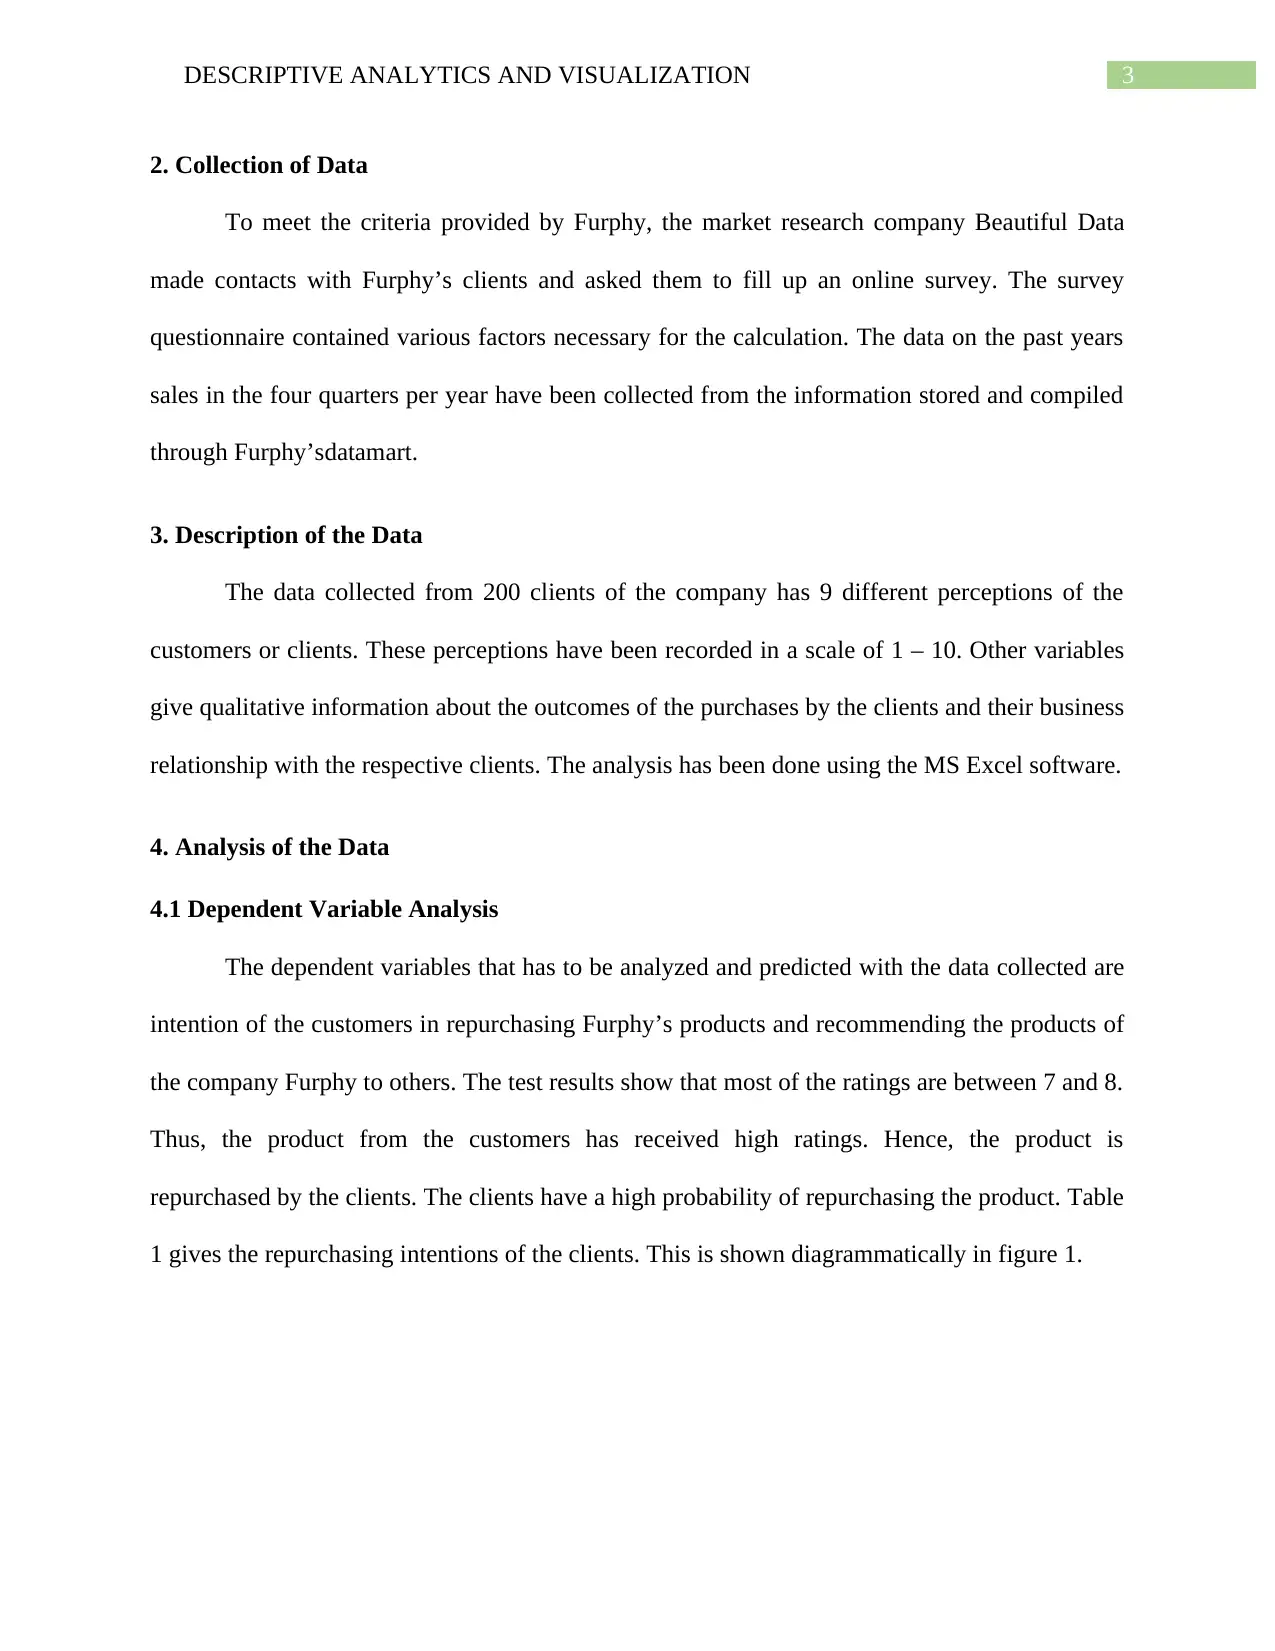
4.1 Dependent Variable Analysis
The dependent variables that has to be analyzed and predicted with the data collected are
intention of the customers in repurchasing Furphy’s products and recommending the products of
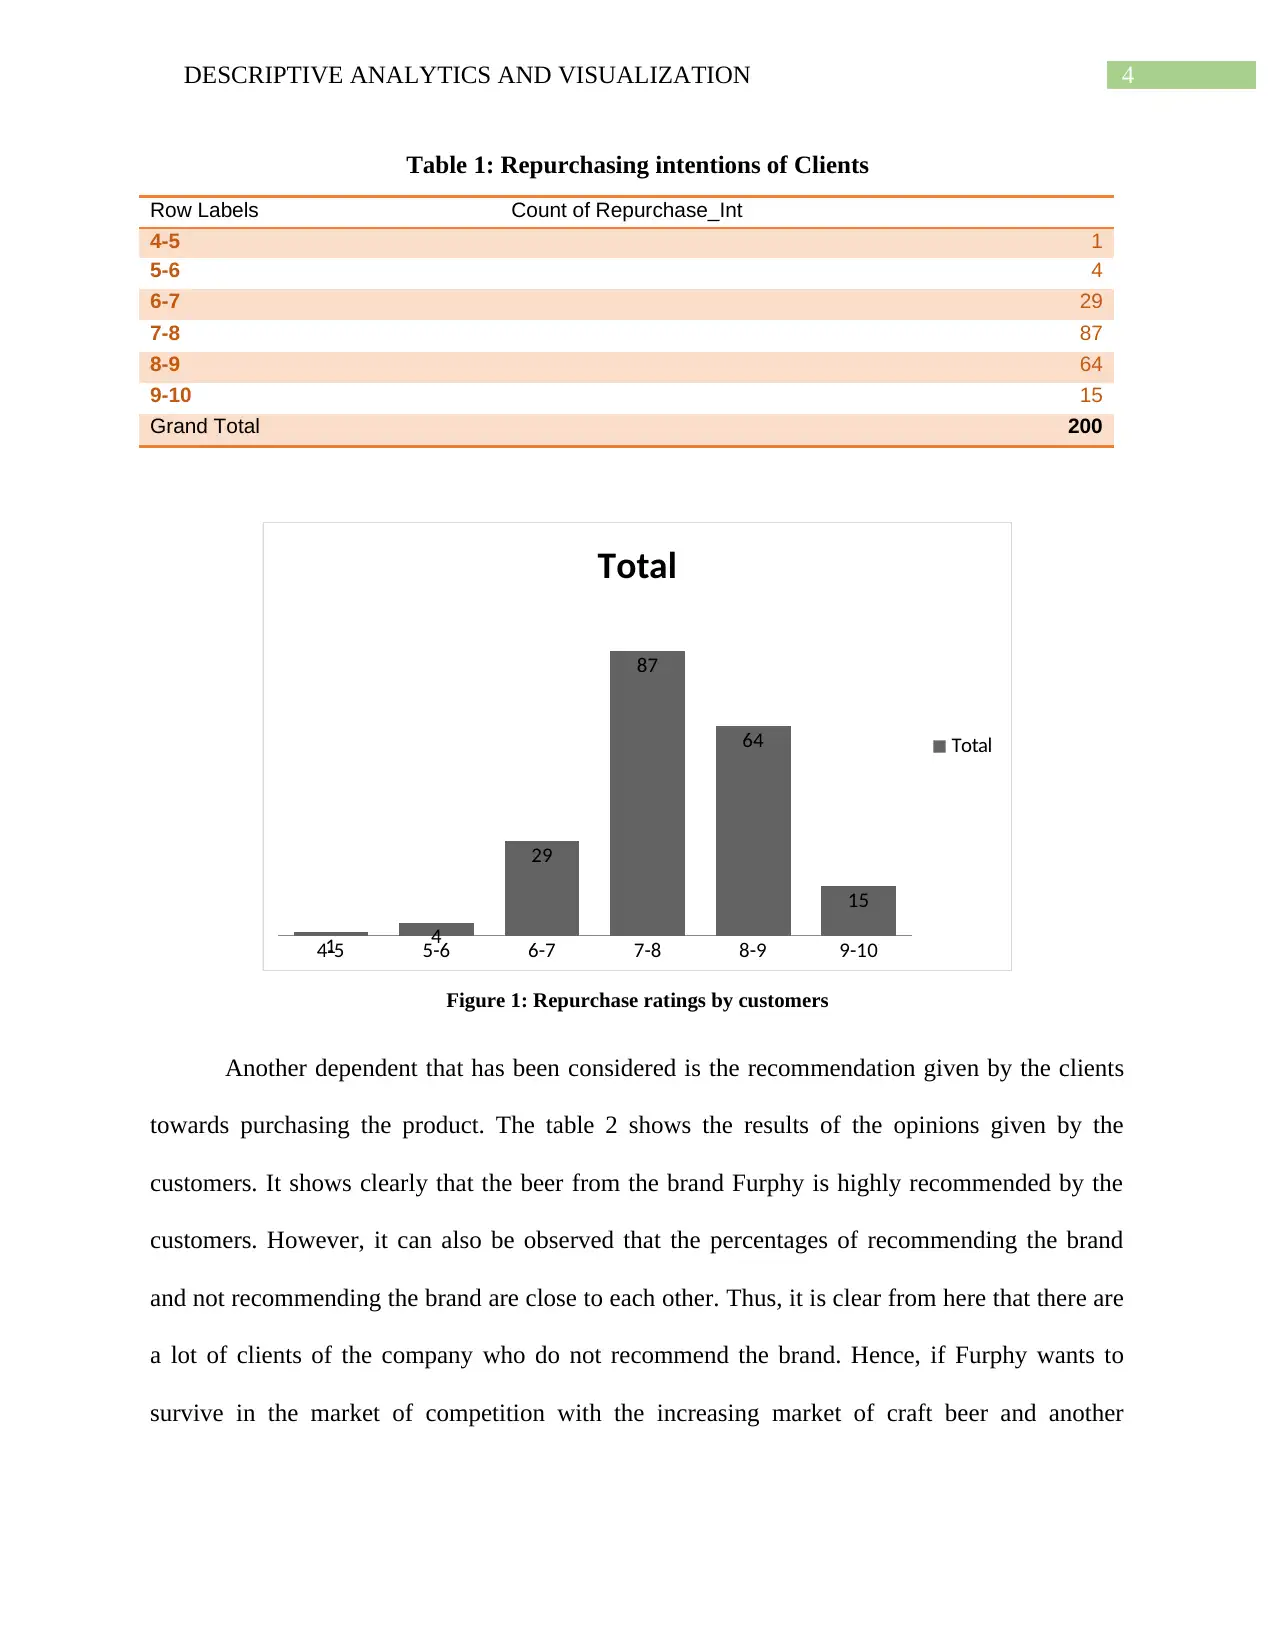
the company Furphy to others. The test results show that most of the ratings are between 7 and 8.
Thus, the product from the customers has received high ratings. Hence, the product is
repurchased by the clients. The clients have a high probability of repurchasing the product. Table
1 gives the repurchasing intentions of the clients. This is shown diagrammatically in figure 1.
2. Collection of Data
To meet the criteria provided by Furphy, the market research company Beautiful Data
made contacts with Furphy’s clients and asked them to fill up an online survey. The survey
questionnaire contained various factors necessary for the calculation. The data on the past years
sales in the four quarters per year have been collected from the information stored and compiled
through Furphy’sdatamart.
3. Description of the Data
The data collected from 200 clients of the company has 9 different perceptions of the
customers or clients. These perceptions have been recorded in a scale of 1 – 10. Other variables
give qualitative information about the outcomes of the purchases by the clients and their business
relationship with the respective clients. The analysis has been done using the MS Excel software.
4. Analysis of the Data
4.1 Dependent Variable Analysis
The dependent variables that has to be analyzed and predicted with the data collected are
intention of the customers in repurchasing Furphy’s products and recommending the products of
the company Furphy to others. The test results show that most of the ratings are between 7 and 8.
Thus, the product from the customers has received high ratings. Hence, the product is
repurchased by the clients. The clients have a high probability of repurchasing the product. Table
1 gives the repurchasing intentions of the clients. This is shown diagrammatically in figure 1.
Paraphrase This Document
Need a fresh take? Get an instant paraphrase of this document with our AI Paraphraser
4DESCRIPTIVE ANALYTICS AND VISUALIZATION
Table 1: Repurchasing intentions of Clients
Row Labels Count of Repurchase_Int
4-5 1
5-6 4
6-7 29
7-8 87
8-9 64
9-10 15
Grand Total 200
4-5 5-6 6-7 7-8 8-9 9-101 4
29
87
64
15
Total
Total
Figure 1: Repurchase ratings by customers
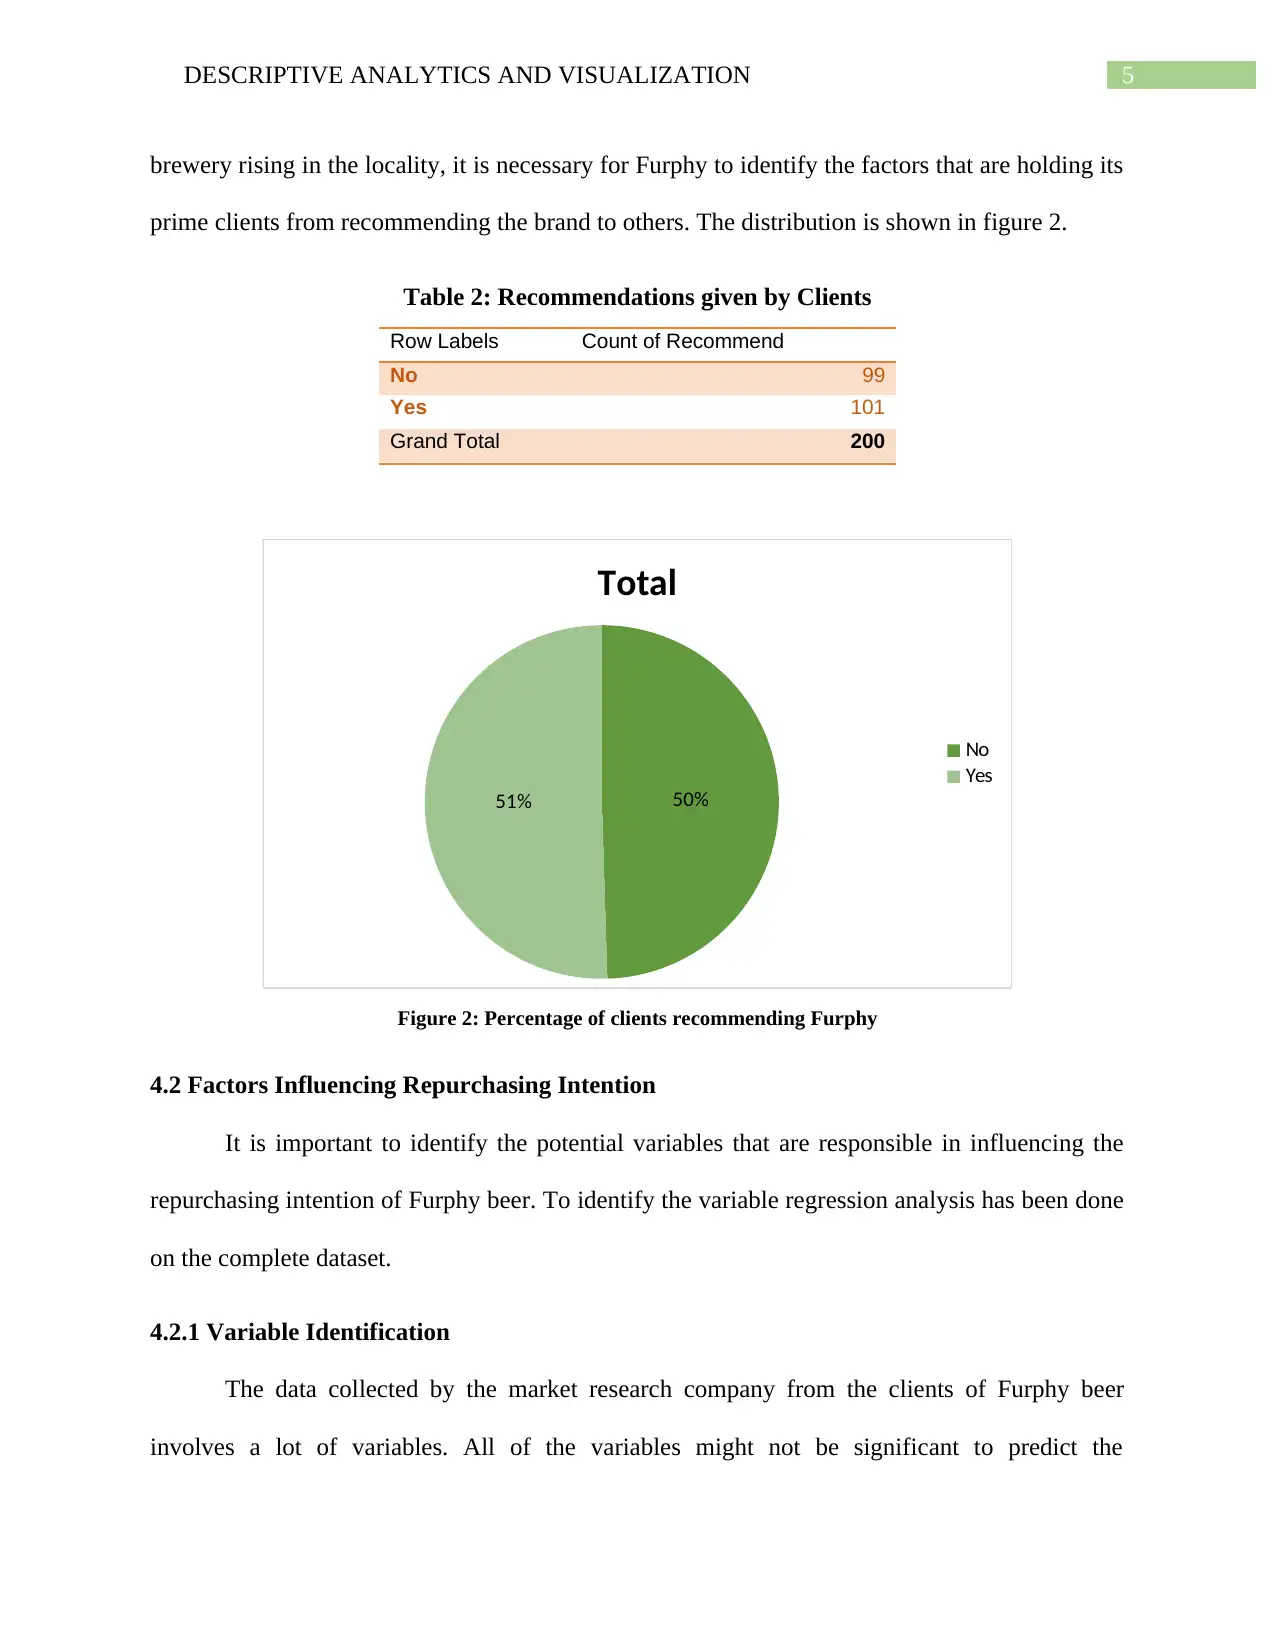
Another dependent that has been considered is the recommendation given by the clients
towards purchasing the product. The table 2 shows the results of the opinions given by the
customers. It shows clearly that the beer from the brand Furphy is highly recommended by the
customers. However, it can also be observed that the percentages of recommending the brand
and not recommending the brand are close to each other. Thus, it is clear from here that there are
a lot of clients of the company who do not recommend the brand. Hence, if Furphy wants to
survive in the market of competition with the increasing market of craft beer and another
Table 1: Repurchasing intentions of Clients
Row Labels Count of Repurchase_Int
4-5 1
5-6 4
6-7 29
7-8 87
8-9 64
9-10 15
Grand Total 200
4-5 5-6 6-7 7-8 8-9 9-101 4
29
87
64
15
Total
Total
Figure 1: Repurchase ratings by customers
Another dependent that has been considered is the recommendation given by the clients
towards purchasing the product. The table 2 shows the results of the opinions given by the
customers. It shows clearly that the beer from the brand Furphy is highly recommended by the
customers. However, it can also be observed that the percentages of recommending the brand
and not recommending the brand are close to each other. Thus, it is clear from here that there are
a lot of clients of the company who do not recommend the brand. Hence, if Furphy wants to
survive in the market of competition with the increasing market of craft beer and another
5DESCRIPTIVE ANALYTICS AND VISUALIZATION
brewery rising in the locality, it is necessary for Furphy to identify the factors that are holding its
prime clients from recommending the brand to others. The distribution is shown in figure 2.
Table 2: Recommendations given by Clients
Row Labels Count of Recommend
No 99
Yes 101
Grand Total 200
50%51%
Total
No
Yes
Figure 2: Percentage of clients recommending Furphy
4.2 Factors Influencing Repurchasing Intention
It is important to identify the potential variables that are responsible in influencing the
repurchasing intention of Furphy beer. To identify the variable regression analysis has been done
on the complete dataset.
4.2.1 Variable Identification
The data collected by the market research company from the clients of Furphy beer
involves a lot of variables. All of the variables might not be significant to predict the
⊘ This is a preview!⊘
Do you want full access?
Subscribe today to unlock all pages.
Trusted by 1+ million students worldwide
6DESCRIPTIVE ANALYTICS AND VISUALIZATION
repurchasing intentions of the product. In order to identify which are the significant variables the
regression is necessary to run and check the p-values of the variables involved(Draper and Smith
2014). The regression has been run at ninety-five percent level of significance. The variables
with the p-value higher than 0.05 (95 percent level of significance) are termed as insignificant
variables and the variables with the p-value lower than 0.05 are termed as significant
variables(Montgomery, Peckand Vining 2015). Regression analysis is the most important
analysis in this case as with the help of this analysis only the significant variables can be
identified(Chatterjeeand Hadi 2015). Analysis of variance (ANOVA) technique can be used to
check whether all the independent variables overall signify the dependent variable(Kleinbaumet
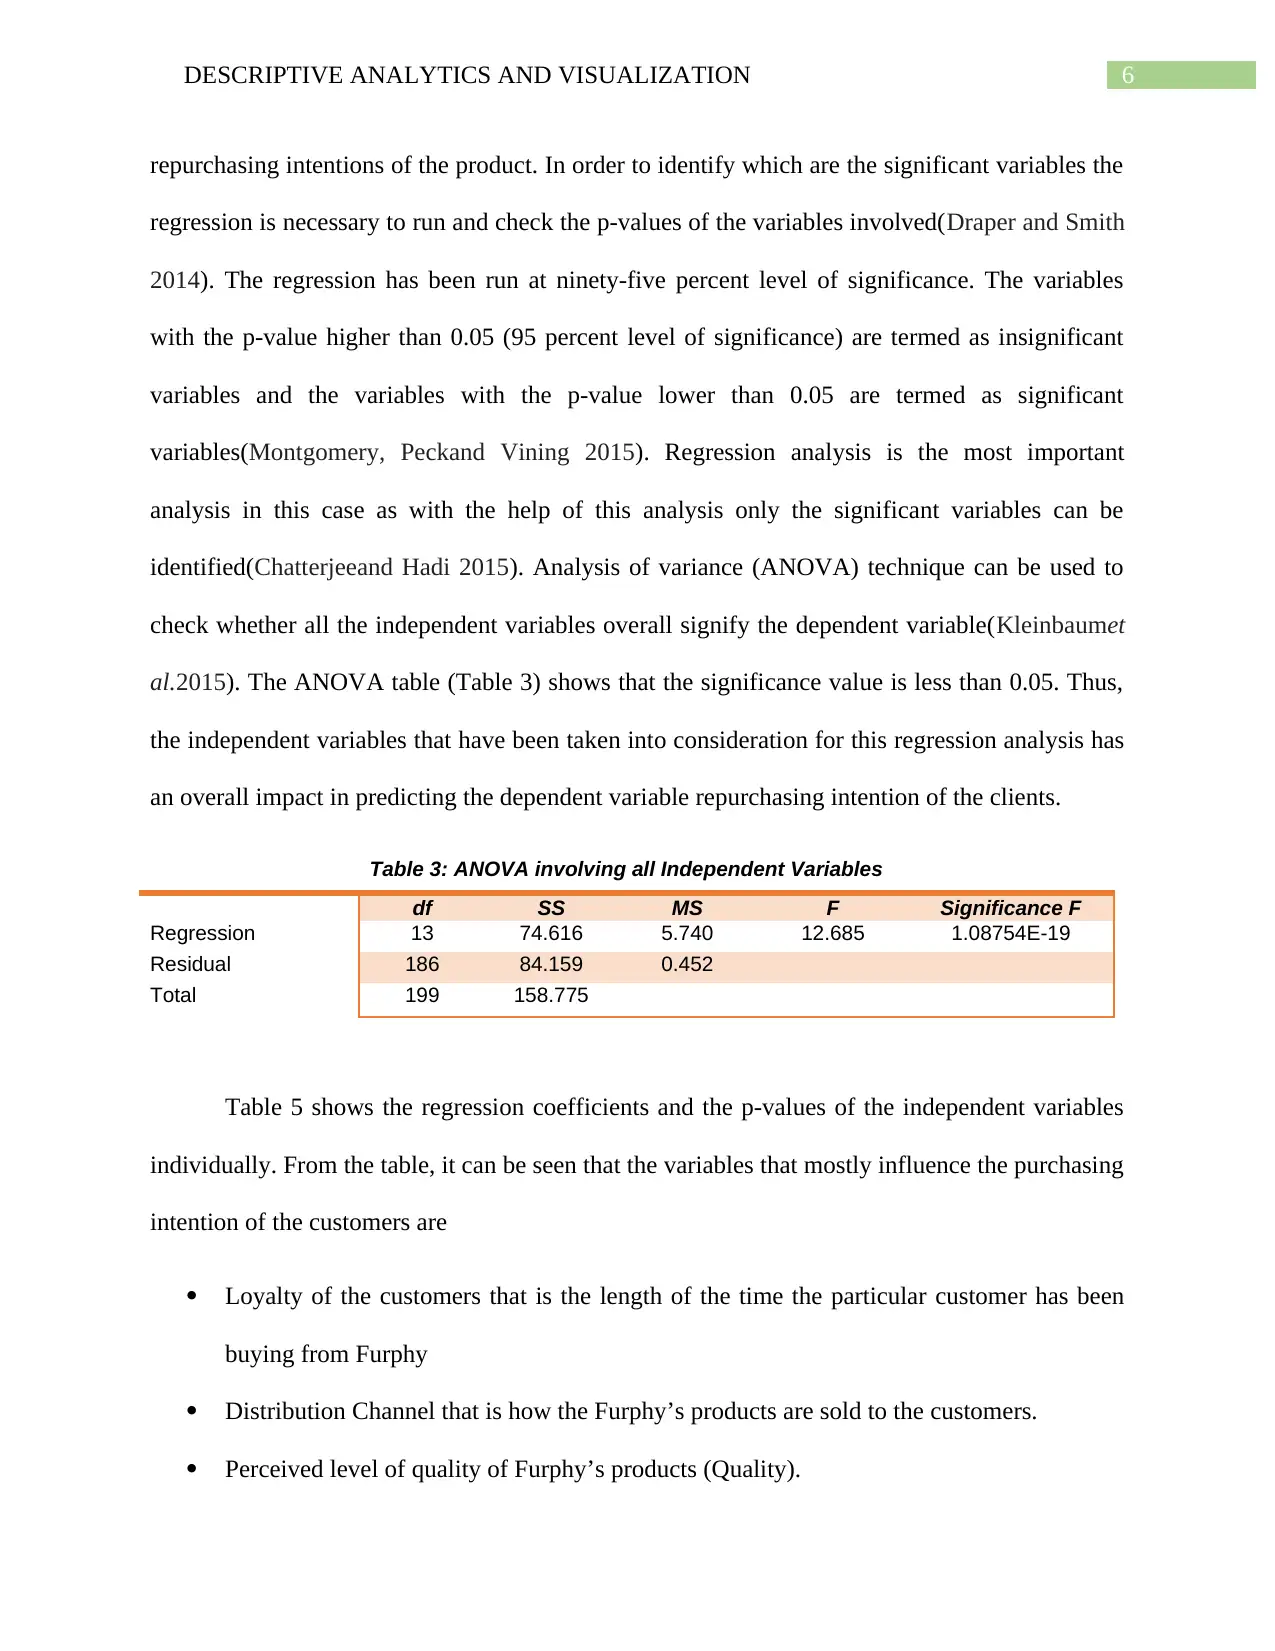
al.2015). The ANOVA table (Table 3) shows that the significance value is less than 0.05. Thus,
the independent variables that have been taken into consideration for this regression analysis has
an overall impact in predicting the dependent variable repurchasing intention of the clients.
Table 3: ANOVA involving all Independent Variables
df SS MS F Significance F
Regression 13 74.616 5.740 12.685 1.08754E-19
Residual 186 84.159 0.452
Total 199 158.775
Table 5 shows the regression coefficients and the p-values of the independent variables
individually. From the table, it can be seen that the variables that mostly influence the purchasing
intention of the customers are
Loyalty of the customers that is the length of the time the particular customer has been
buying from Furphy
Distribution Channel that is how the Furphy’s products are sold to the customers.
Perceived level of quality of Furphy’s products (Quality).
repurchasing intentions of the product. In order to identify which are the significant variables the
regression is necessary to run and check the p-values of the variables involved(Draper and Smith
2014). The regression has been run at ninety-five percent level of significance. The variables
with the p-value higher than 0.05 (95 percent level of significance) are termed as insignificant
variables and the variables with the p-value lower than 0.05 are termed as significant
variables(Montgomery, Peckand Vining 2015). Regression analysis is the most important
analysis in this case as with the help of this analysis only the significant variables can be
identified(Chatterjeeand Hadi 2015). Analysis of variance (ANOVA) technique can be used to
check whether all the independent variables overall signify the dependent variable(Kleinbaumet
al.2015). The ANOVA table (Table 3) shows that the significance value is less than 0.05. Thus,
the independent variables that have been taken into consideration for this regression analysis has
an overall impact in predicting the dependent variable repurchasing intention of the clients.
Table 3: ANOVA involving all Independent Variables
df SS MS F Significance F
Regression 13 74.616 5.740 12.685 1.08754E-19
Residual 186 84.159 0.452
Total 199 158.775
Table 5 shows the regression coefficients and the p-values of the independent variables
individually. From the table, it can be seen that the variables that mostly influence the purchasing
intention of the customers are
Loyalty of the customers that is the length of the time the particular customer has been
buying from Furphy
Distribution Channel that is how the Furphy’s products are sold to the customers.
Perceived level of quality of Furphy’s products (Quality).
Paraphrase This Document
Need a fresh take? Get an instant paraphrase of this document with our AI Paraphraser
7DESCRIPTIVE ANALYTICS AND VISUALIZATION
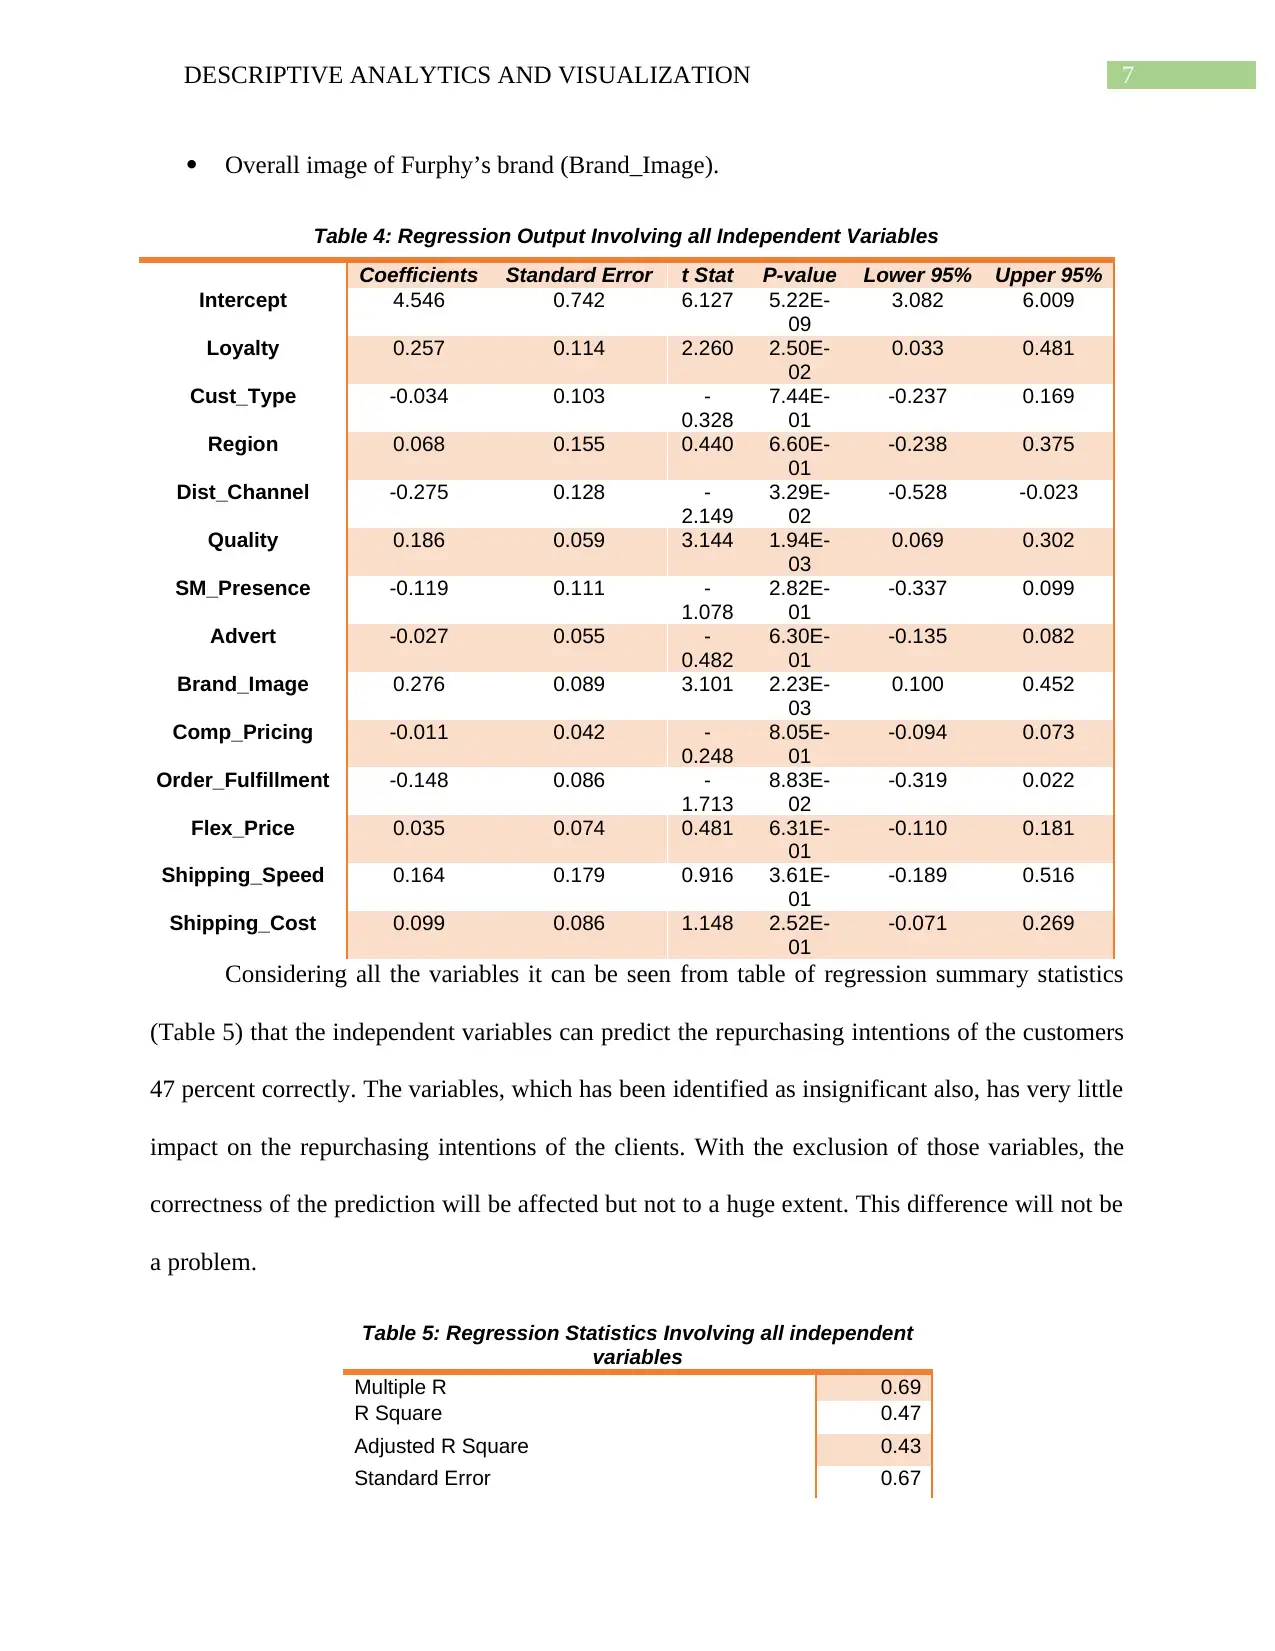
Overall image of Furphy’s brand (Brand_Image).
Table 4: Regression Output Involving all Independent Variables
Coefficients Standard Error t Stat P-value Lower 95% Upper 95%
Intercept 4.546 0.742 6.127 5.22E-
09
3.082 6.009
Loyalty 0.257 0.114 2.260 2.50E-
02
0.033 0.481
Cust_Type -0.034 0.103 -
0.328
7.44E-
01
-0.237 0.169
Region 0.068 0.155 0.440 6.60E-
01
-0.238 0.375
Dist_Channel -0.275 0.128 -
2.149
3.29E-
02
-0.528 -0.023
Quality 0.186 0.059 3.144 1.94E-
03
0.069 0.302
SM_Presence -0.119 0.111 -
1.078
2.82E-
01
-0.337 0.099
Advert -0.027 0.055 -
0.482
6.30E-
01
-0.135 0.082
Brand_Image 0.276 0.089 3.101 2.23E-
03
0.100 0.452
Comp_Pricing -0.011 0.042 -
0.248
8.05E-
01
-0.094 0.073
Order_Fulfillment -0.148 0.086 -
1.713
8.83E-
02
-0.319 0.022
Flex_Price 0.035 0.074 0.481 6.31E-
01
-0.110 0.181
Shipping_Speed 0.164 0.179 0.916 3.61E-
01
-0.189 0.516
Shipping_Cost 0.099 0.086 1.148 2.52E-
01
-0.071 0.269
Considering all the variables it can be seen from table of regression summary statistics
(Table 5) that the independent variables can predict the repurchasing intentions of the customers
47 percent correctly. The variables, which has been identified as insignificant also, has very little
impact on the repurchasing intentions of the clients. With the exclusion of those variables, the
correctness of the prediction will be affected but not to a huge extent. This difference will not be
a problem.
Table 5: Regression Statistics Involving all independent
variables
Multiple R 0.69
R Square 0.47
Adjusted R Square 0.43
Standard Error 0.67
8DESCRIPTIVE ANALYTICS AND VISUALIZATION
Observations 200
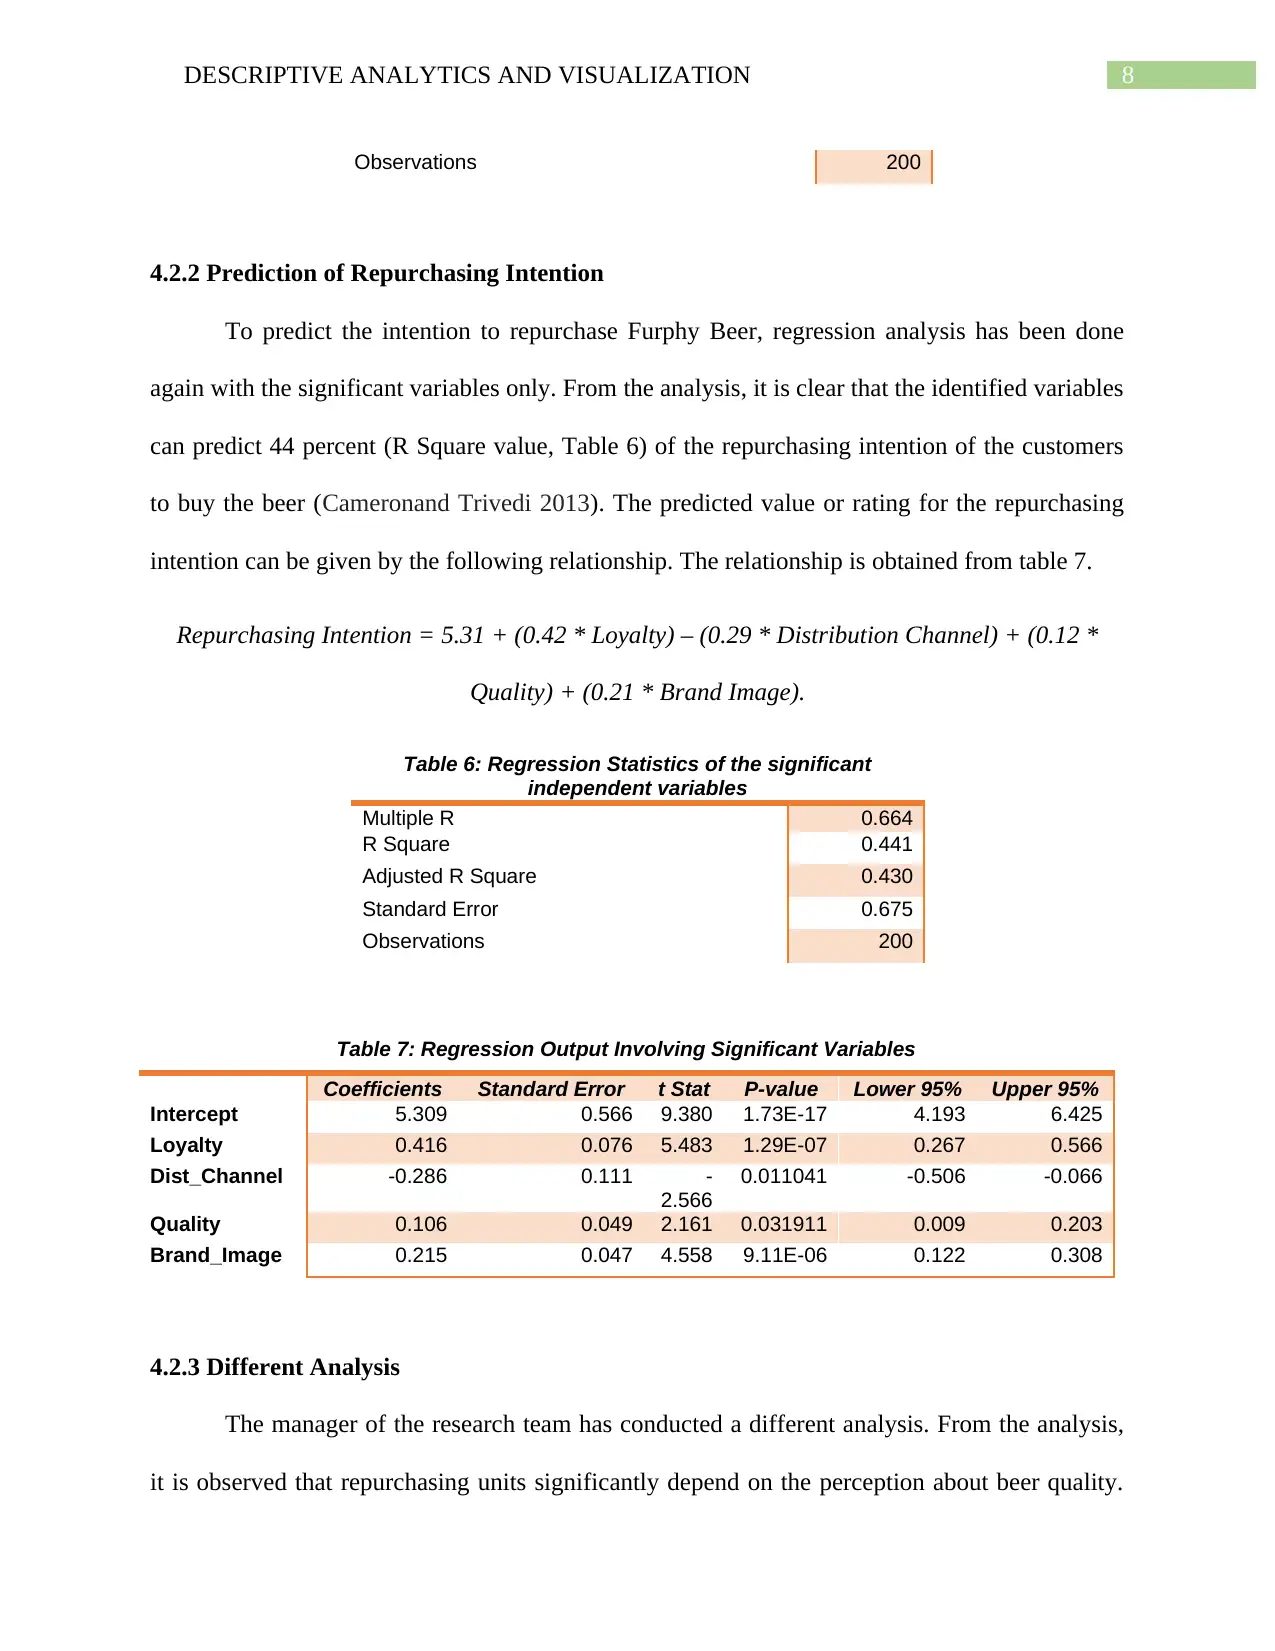
4.2.2 Prediction of Repurchasing Intention
To predict the intention to repurchase Furphy Beer, regression analysis has been done
again with the significant variables only. From the analysis, it is clear that the identified variables
can predict 44 percent (R Square value, Table 6) of the repurchasing intention of the customers
to buy the beer (Cameronand Trivedi 2013). The predicted value or rating for the repurchasing
intention can be given by the following relationship. The relationship is obtained from table 7.
Repurchasing Intention = 5.31 + (0.42 * Loyalty) – (0.29 * Distribution Channel) + (0.12 *
Quality) + (0.21 * Brand Image).
Table 6: Regression Statistics of the significant
independent variables
Multiple R 0.664
R Square 0.441
Adjusted R Square 0.430
Standard Error 0.675
Observations 200
Table 7: Regression Output Involving Significant Variables
Coefficients Standard Error t Stat P-value Lower 95% Upper 95%
Intercept 5.309 0.566 9.380 1.73E-17 4.193 6.425
Loyalty 0.416 0.076 5.483 1.29E-07 0.267 0.566
Dist_Channel -0.286 0.111 -
2.566
0.011041 -0.506 -0.066
Quality 0.106 0.049 2.161 0.031911 0.009 0.203
Brand_Image 0.215 0.047 4.558 9.11E-06 0.122 0.308
4.2.3 Different Analysis
The manager of the research team has conducted a different analysis. From the analysis,
it is observed that repurchasing units significantly depend on the perception about beer quality.
Observations 200
4.2.2 Prediction of Repurchasing Intention
To predict the intention to repurchase Furphy Beer, regression analysis has been done
again with the significant variables only. From the analysis, it is clear that the identified variables
can predict 44 percent (R Square value, Table 6) of the repurchasing intention of the customers
to buy the beer (Cameronand Trivedi 2013). The predicted value or rating for the repurchasing
intention can be given by the following relationship. The relationship is obtained from table 7.
Repurchasing Intention = 5.31 + (0.42 * Loyalty) – (0.29 * Distribution Channel) + (0.12 *
Quality) + (0.21 * Brand Image).
Table 6: Regression Statistics of the significant
independent variables
Multiple R 0.664
R Square 0.441
Adjusted R Square 0.430
Standard Error 0.675
Observations 200
Table 7: Regression Output Involving Significant Variables
Coefficients Standard Error t Stat P-value Lower 95% Upper 95%
Intercept 5.309 0.566 9.380 1.73E-17 4.193 6.425
Loyalty 0.416 0.076 5.483 1.29E-07 0.267 0.566
Dist_Channel -0.286 0.111 -
2.566
0.011041 -0.506 -0.066
Quality 0.106 0.049 2.161 0.031911 0.009 0.203
Brand_Image 0.215 0.047 4.558 9.11E-06 0.122 0.308
4.2.3 Different Analysis
The manager of the research team has conducted a different analysis. From the analysis,
it is observed that repurchasing units significantly depend on the perception about beer quality.
⊘ This is a preview!⊘
Do you want full access?
Subscribe today to unlock all pages.
Trusted by 1+ million students worldwide
9DESCRIPTIVE ANALYTICS AND VISUALIZATION
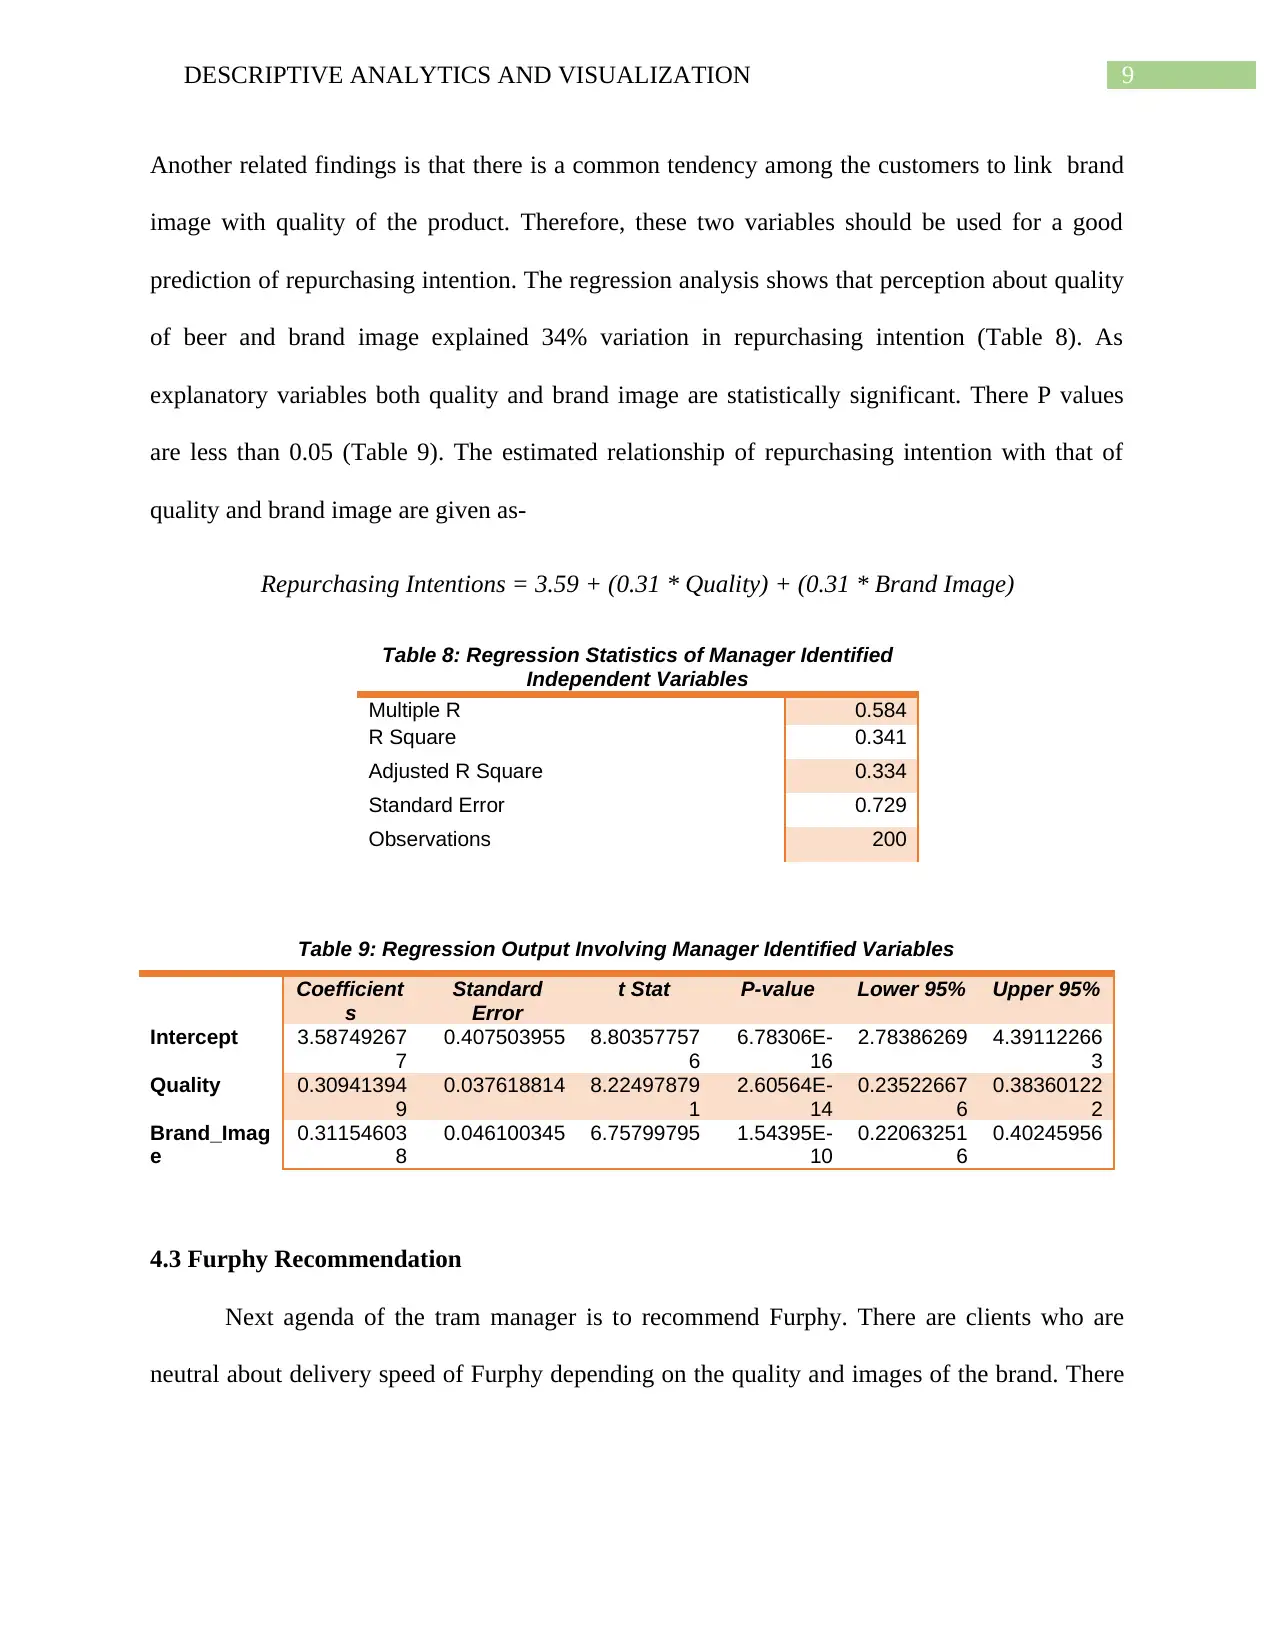
Another related findings is that there is a common tendency among the customers to link brand
image with quality of the product. Therefore, these two variables should be used for a good
prediction of repurchasing intention. The regression analysis shows that perception about quality
of beer and brand image explained 34% variation in repurchasing intention (Table 8). As
explanatory variables both quality and brand image are statistically significant. There P values
are less than 0.05 (Table 9). The estimated relationship of repurchasing intention with that of
quality and brand image are given as-
Repurchasing Intentions = 3.59 + (0.31 * Quality) + (0.31 * Brand Image)
Table 8: Regression Statistics of Manager Identified
Independent Variables
Multiple R 0.584
R Square 0.341
Adjusted R Square 0.334
Standard Error 0.729
Observations 200
Table 9: Regression Output Involving Manager Identified Variables
Coefficient
s
Standard
Error
t Stat P-value Lower 95% Upper 95%
Intercept 3.58749267
7
0.407503955 8.80357757
6
6.78306E-
16
2.78386269 4.39112266
3
Quality 0.30941394
9
0.037618814 8.22497879
1
2.60564E-
14
0.23522667
6
0.38360122
2
Brand_Imag
e
0.31154603
8
0.046100345 6.75799795 1.54395E-
10
0.22063251
6
0.40245956
4.3 Furphy Recommendation
Next agenda of the tram manager is to recommend Furphy. There are clients who are
neutral about delivery speed of Furphy depending on the quality and images of the brand. There
Paraphrase This Document
Need a fresh take? Get an instant paraphrase of this document with our AI Paraphraser
10DESCRIPTIVE ANALYTICS AND VISUALIZATION
are also clients who make purchase either directly or through sales representatives. Special
attention has been given to these groups of clients.
An important determinant of this is the ratings given by clients. To make the analysis
simple, ratings are rounded off to get the nearest whole number. Clients who have given a 5
ratings are collected to confirm the likely for Furphy recommendation. The likely hood of
recommendation is 29 percent for the clients who are neutral about Furphy’s delivery speed as
shown from table 12.
Perception of clients varied with different levels of product quality. With this varying
level, the likely hood for recommending Furphy to other clients is 0.505, as stated in table 14.
From the table it is seen that the lowest recorded rating is 6. Therefore, from the rating statistics
it is clearly evident that the product delivered by Furphy is quite satisfactory and is of a good
quality product.
The likely hood for different brand images is represented in tale 16. The brand images are
categorized in three groups positive brand image, neutral brand image and negative brand image.
1 percent of the clients having neutral brand preference recommend Furphy’s product. Clients
with positive and negative brand image constitutes likely hood of 31% and 18.5% respectively.
These are the recommendation statistics for clients influencing others toward making purchase of
Furphy’s beer brand.
The tendency for recommendation by customers who directly purchase the product or
purchase with intermediation by the sales representatives is shown in table 18. It is seen that
those who directly purchase the product have a higher tendency for recommendation as
compared to those purchase the product with sales representative. Percentage of customers
11DESCRIPTIVE ANALYTICS AND VISUALIZATION
recommending Furphy to others in directly purchasing group is 34% while that for buyers with
sales representative is 16.5 percent.
Furphy’s beer brand is quite popular in the state. Mixed responses are obtained from the
clients purchasing the products. There are both positive and negative ratings obtained from the
clients. Despite negative and neutral return from customers, there is an overall good image for
the product. Recommendations come from all the groups of customers. The Customers
recommend the product to others irrespective of their ratings
4.4 Analysis based on Time Series
A time series analysis is made for foresting sales of Furphy in the next quarter. Using
sales data until 2017, prediction is made for the tear 2018. Quarterly moving average method
(Granger and Newbold 2014)has been used to predict quarterly sales in 2018. When past data
points are available then moving average methods are suitable for making forecast(Brockwell
and Davis 2016). The trend obtained from the data is likely to depict a clear trend for
forecast(Boxet al. 2015). Moreover, moving average method is widely used because of
simplicity in calculation and easy interpretation(Montgomery, Jennings and Kulahci 2015). The
predicted sale in first quarter of 2018 is 1699.40 litres per ale. An increase in quarterly sales
prediction is found for the next quarter. In the second quarter of 2018, the expected sale is 1714
litres per ale. This trend declines in the third and fourth quarter of 2018. Forecasted sales for the
third and fourth quarter of 2018 are 1656.66 litres per ale and 1688.71 litres per ale.
5. Recommendations and Conclusion
The paper summarizes sales and ratings of the Furohy product with reference to
repurchase unit. Most people using the product have given high rating for the product. The
⊘ This is a preview!⊘
Do you want full access?
Subscribe today to unlock all pages.
Trusted by 1+ million students worldwide
1 out of 16
Related Documents


Your All-in-One AI-Powered Toolkit for Academic Success.
+13062052269
info@desklib.com
Available 24*7 on WhatsApp / Email
![[object Object]](/_next/static/media/star-bottom.7253800d.svg)
Unlock your academic potential
Copyright © 2020–2026 A2Z Services. All Rights Reserved. Developed and managed by ZUCOL.