Descriptive Statistics Report: Age and COVID-19 Deaths Analysis

Verified

Added on  2021/06/08

|6
|601
|147
Report
AI Summary
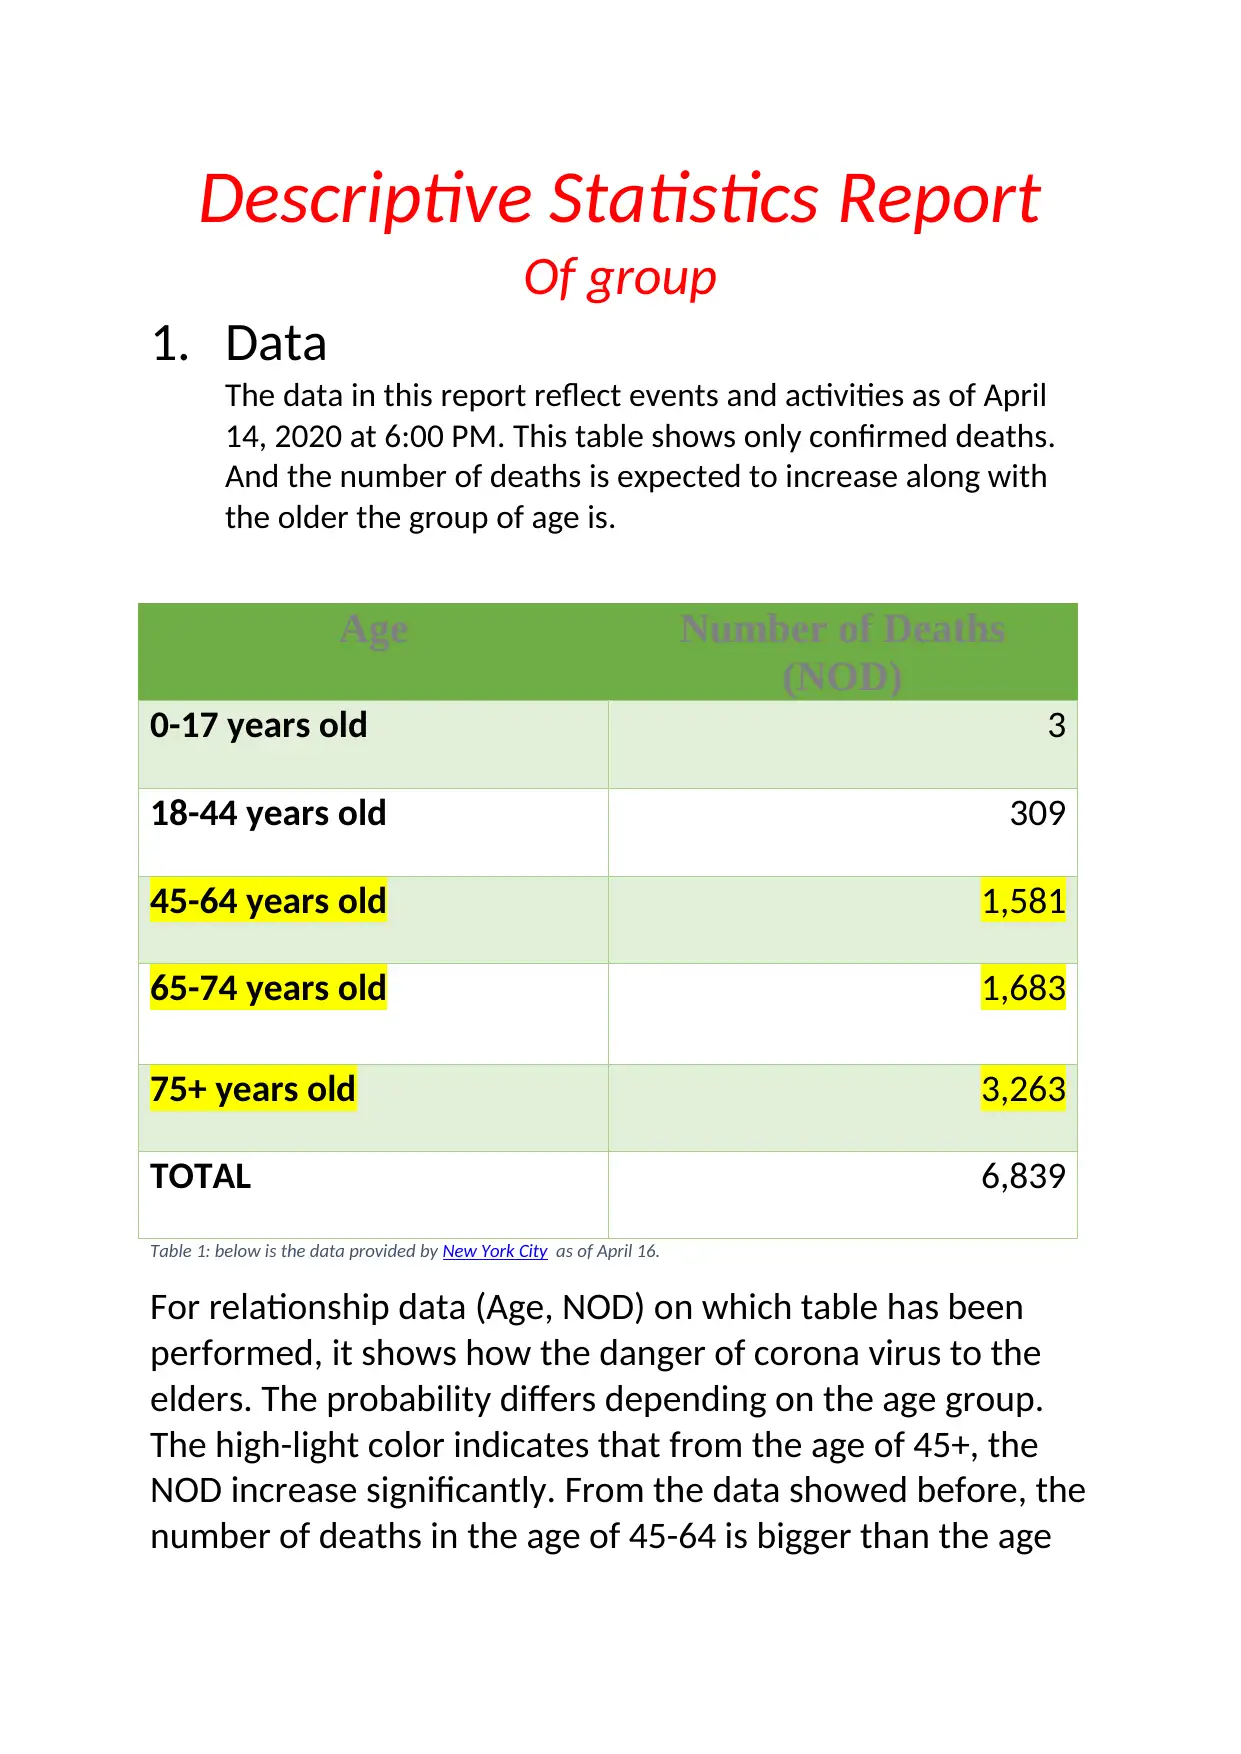
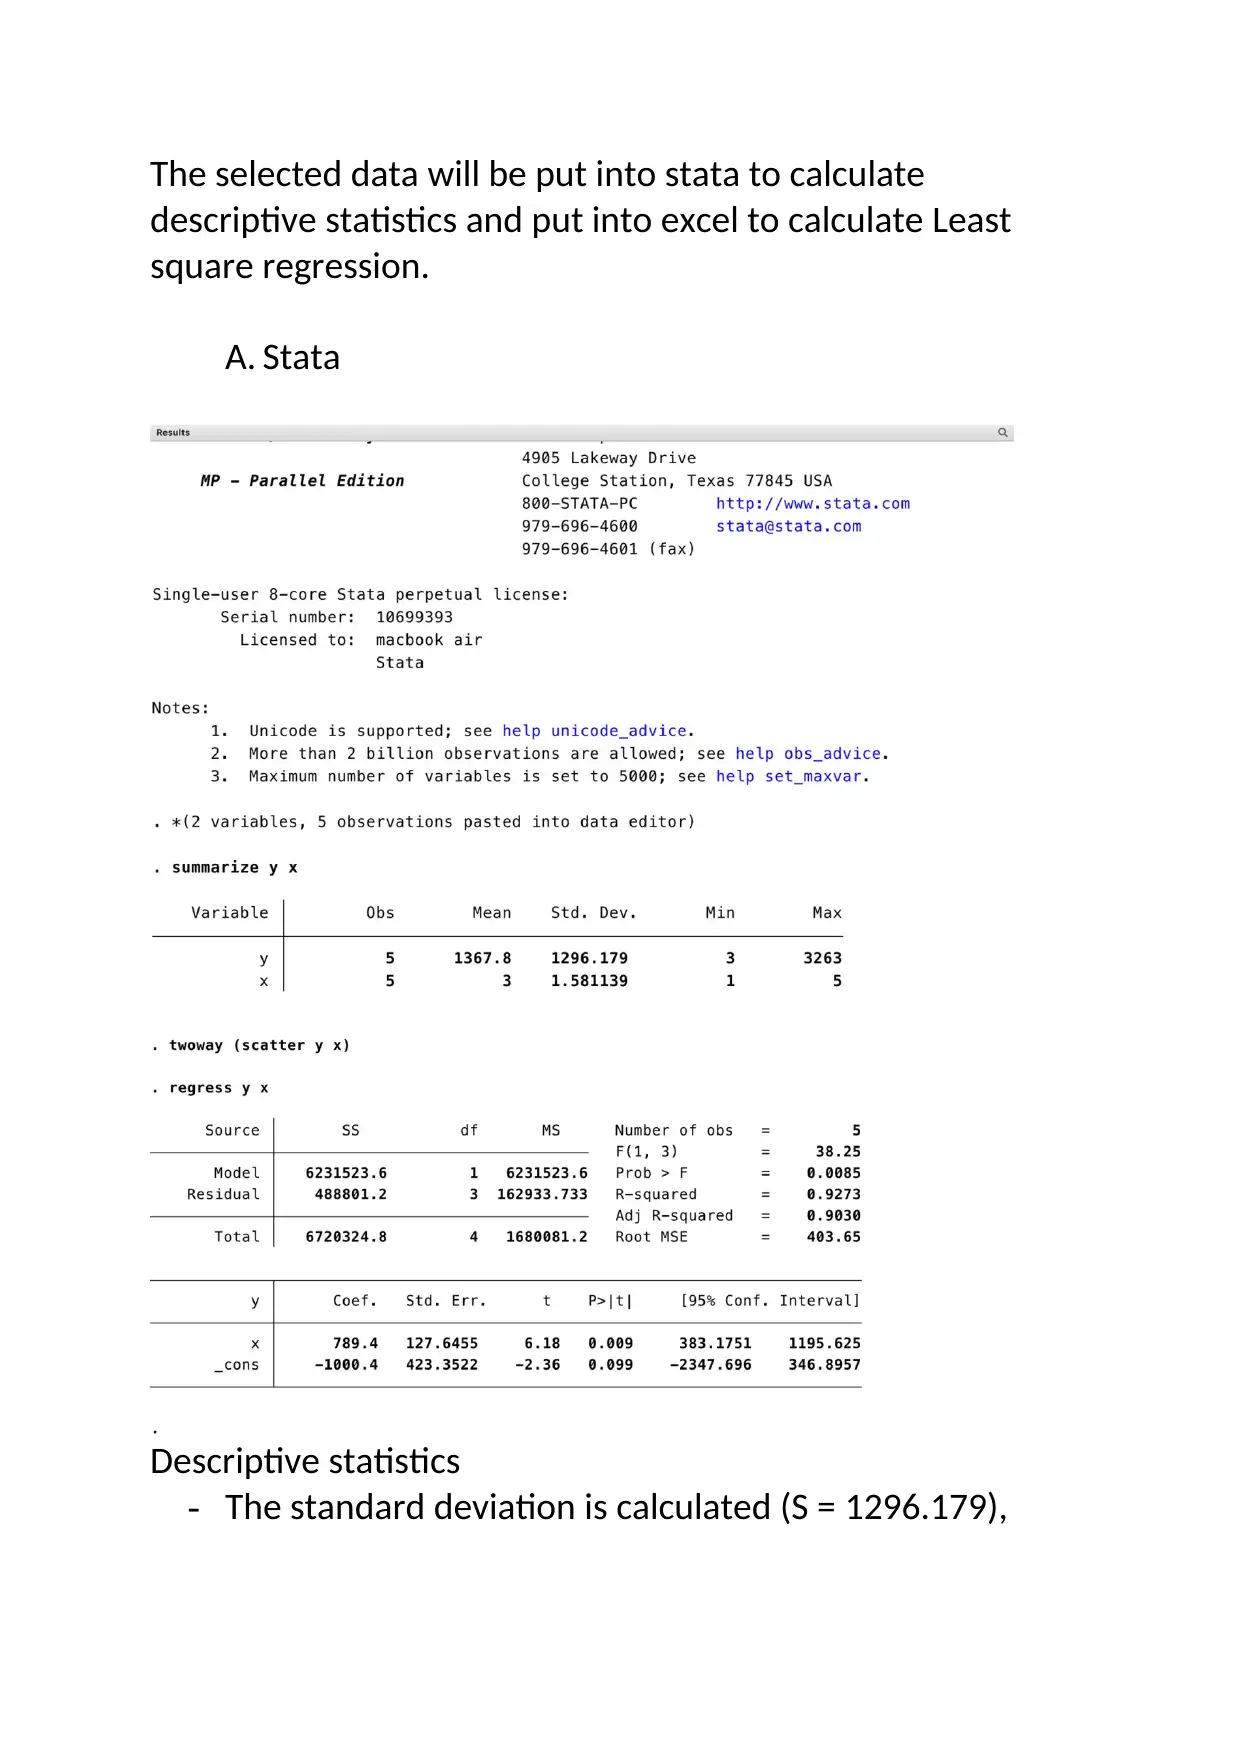
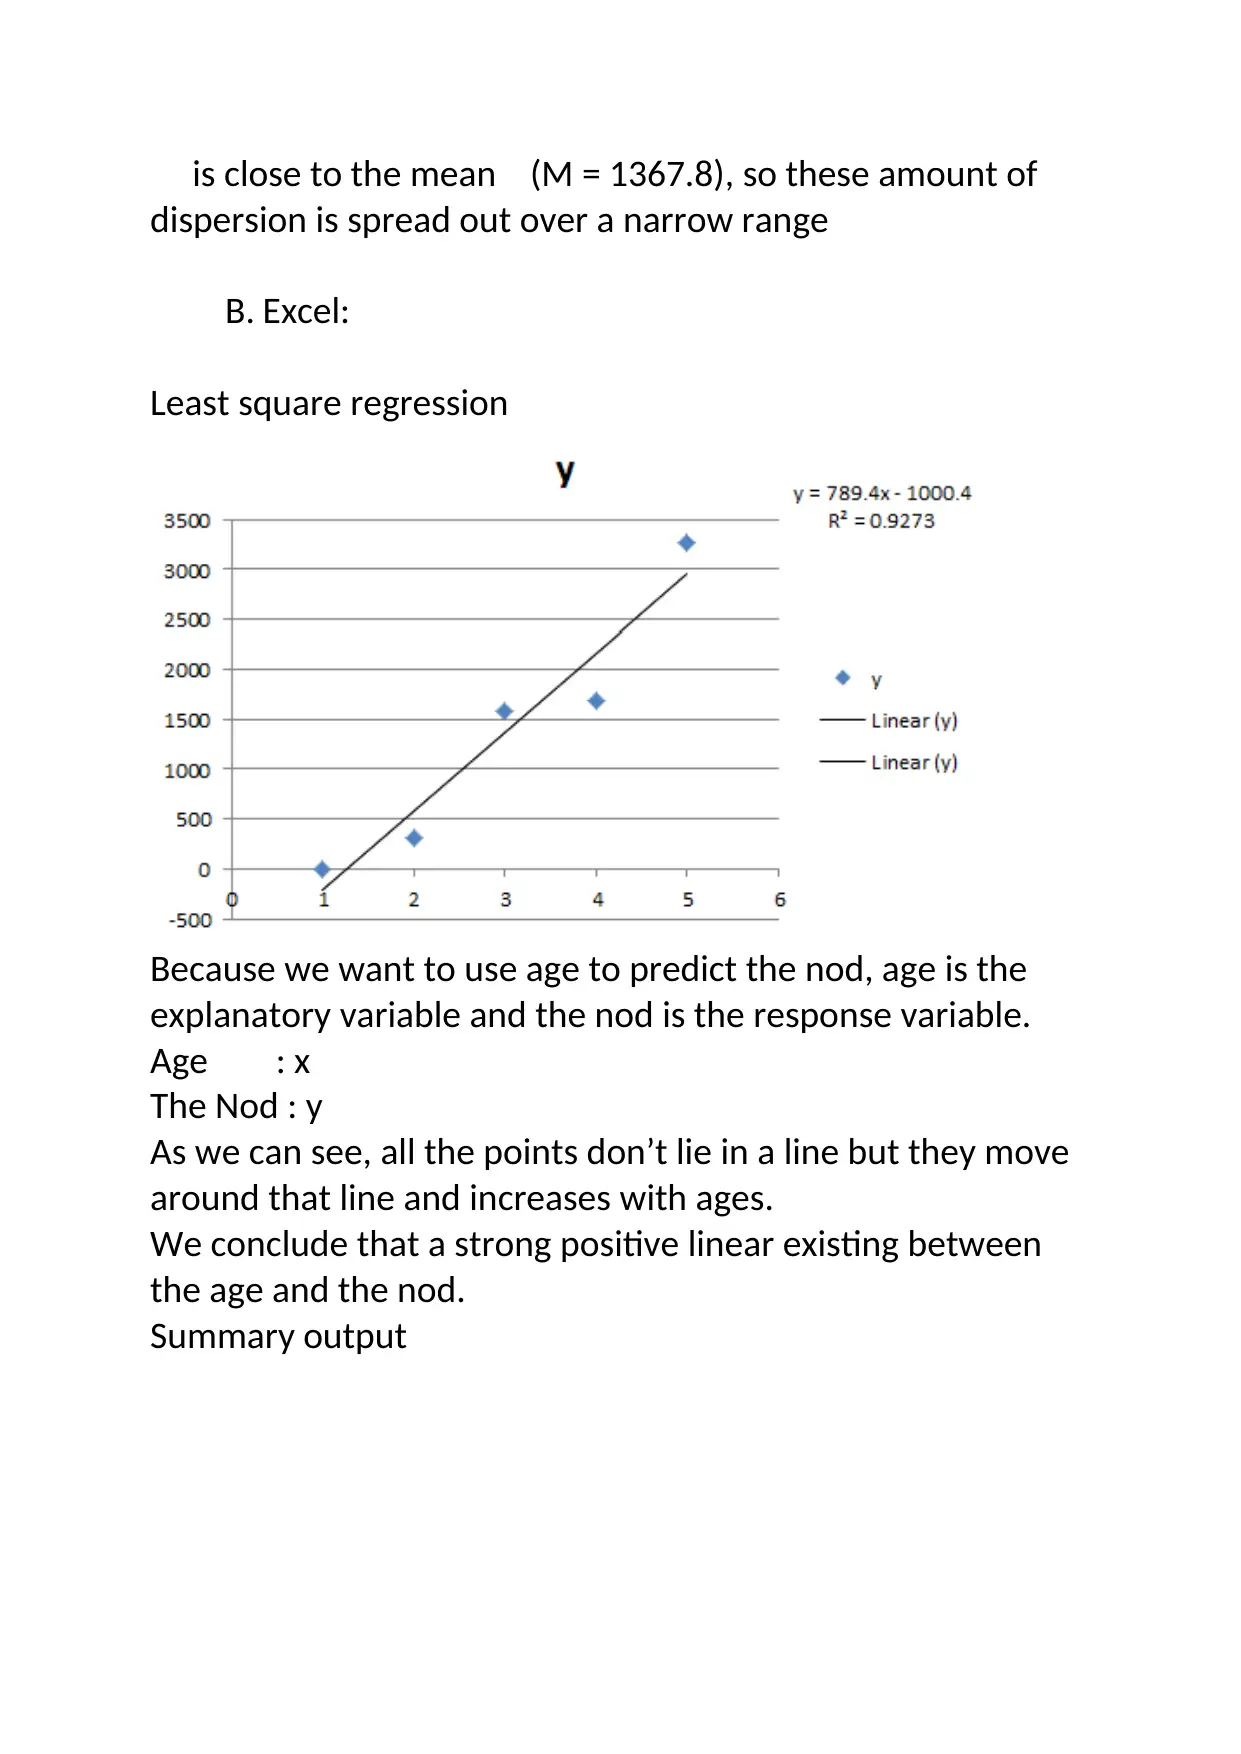
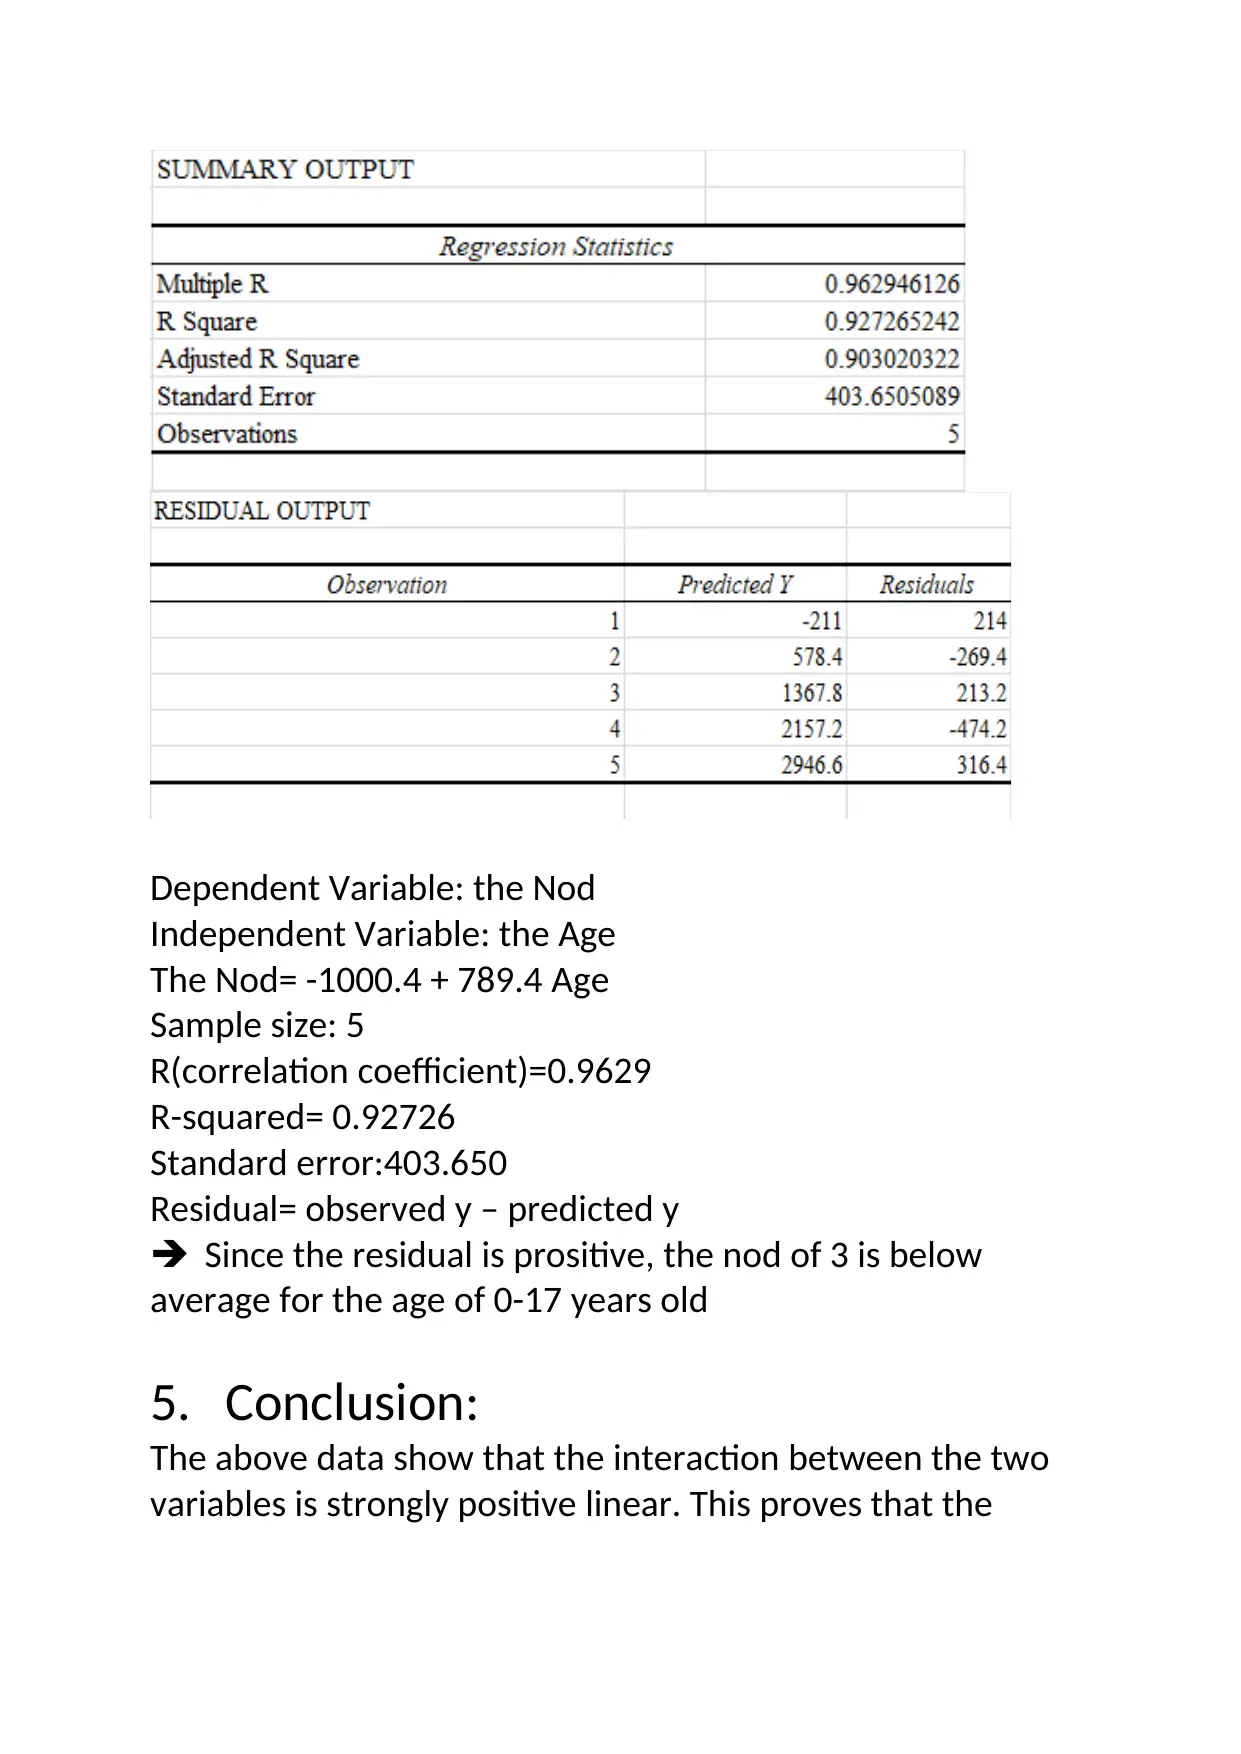
This report presents a descriptive statistical analysis of COVID-19 mortality data, focusing on the relationship between age and the number of deaths. The analysis utilizes data from April 2020, examining mortality rates across different age groups. The report includes descriptive statistics, such as standard deviation and mean, calculated using Stata, and least square regression analysis performed in Excel. The independent variable is age, and the dependent variable is the number of deaths. The findings reveal a strong positive linear relationship between age and mortality, indicating that as age increases, the number of COVID-19 deaths also increases. The report concludes that there is a strong positive correlation between age and the number of deaths, which aligns with the expected trend and highlights the importance of public awareness and preventative measures, especially for older age groups. The report also includes a summary output of the regression analysis, showing the regression equation, correlation coefficient, and R-squared value.
Document Page
Descriptive Statistics Report
Of group
1. Data
The data in this report reflect events and activities as of April
14, 2020 at 6:00 PM. This table shows only confirmed deaths.
And the number of deaths is expected to increase along with
the older the group of age is.
Age Number of Deaths
(NOD)
0-17 years old 3
18-44 years old 309
45-64 years old 1,581
65-74 years old 1,683
75+ years old 3,263
TOTAL 6,839
Table 1: below is the data provided by New York City as of April 16.
For relationship data (Age, NOD) on which table has been
performed, it shows how the danger of corona virus to the
elders. The probability differs depending on the age group.
The high-light color indicates that from the age of 45+, the
NOD increase significantly. From the data showed before, the
number of deaths in the age of 45-64 is bigger than the age
tabler-icon-diamond-filled.svg

Secure Best Marks with AI Grader

Need help grading? Try our AI Grader for instant feedback on your assignments.
Document Page
of 18-44 for 5 times. This numbers is slightly larger in the age
of 64-74 then enlarged twice at the age of 75+ years old.
2. 2 variables:
The age group was chosen as independent variable
and the number of deaths by corona was response
variable.
3. Aims of choosing these variables:
Based on the statistics, these two variables have
a significant impact on each other. Specifically,
the higher the independent variable at an older age,
the greater the value of the explanatory variable.
This indicates that the elderly group has a high
mortality rate.
This survey points to the urgency of raising
public awareness about disease prevention.
Especially preventing in the older age group,
protection of health needs special care.
4. Processing variables:
Because the independent variables(age) is the qualitative
variable, we assign them as the following values:
- 0-17 years old : 1
- 18-44 years old : 2
- 45- 64 years old : 3
- 65-74 years old : 4
- 75+ years old : 5
Document Page
The selected data will be put into stata to calculate
descriptive statistics and put into excel to calculate Least
square regression.
A. Stata
Descriptive statistics
- The standard deviation is calculated (S = 1296.179),
Document Page
is close to the mean (M = 1367.8), so these amount of
dispersion is spread out over a narrow range
B. Excel:
Least square regression
Because we want to use age to predict the nod, age is the
explanatory variable and the nod is the response variable.
Age : x
The Nod : y
As we can see, all the points don’t lie in a line but they move
around that line and increases with ages.
We conclude that a strong positive linear existing between
the age and the nod.
Summary output
tabler-icon-diamond-filled.svg

Secure Best Marks with AI Grader

Need help grading? Try our AI Grader for instant feedback on your assignments.
Document Page
Dependent Variable: the Nod
Independent Variable: the Age
The Nod= -1000.4 + 789.4 Age
Sample size: 5
R(correlation coefficient)=0.9629
R-squared= 0.92726
Standard error:403.650
Residual= observed y – predicted y
Since the residual is prositive, the nod of 3 is below
average for the age of 0-17 years old
5. Conclusion:
The above data show that the interaction between the two
variables is strongly positive linear. This proves that the
Document Page
higher age of coronary infection leads to the greater the
number of deaths at that age
Therefore, the trending of the number of deaths indicates
the compatibility with the expectation shown before.
chevron_up_icon
1 out of 6
circle_padding
hide_on_mobile
zoom_out_icon
logo.png

Your All-in-One AI-Powered Toolkit for Academic Success.

Available 24*7 on WhatsApp / Email

[object Object]