Descriptive Statistics: Analyzing Data for Business Insights
VerifiedAdded on 2023/06/17
|11
|1473
|52
Practical Assignment
AI Summary
This assignment focuses on descriptive statistics, covering various tasks such as calculating mean, median, standard deviation, and variance for a given dataset. It includes the analysis of expenditure on stand mixers, frequency distribution tables, cumulative frequency, and Ogive curve interpretat...
Descriptive statistics
Paraphrase This Document
Need a fresh take? Get an instant paraphrase of this document with our AI Paraphraser
TABLE OF CONTENTS
PART 1............................................................................................................................................2
TASK 1............................................................................................................................................2
a)..................................................................................................................................................2
b)..................................................................................................................................................2
TASK 2............................................................................................................................................3
a)..................................................................................................................................................3
b)..................................................................................................................................................4
c)..................................................................................................................................................4
TASK 3............................................................................................................................................4
a)..................................................................................................................................................4
TASK 4............................................................................................................................................5
a)..................................................................................................................................................5
b)..................................................................................................................................................5
c)..................................................................................................................................................5
TASK 5............................................................................................................................................5
a)..................................................................................................................................................5
b)..................................................................................................................................................6
c)..................................................................................................................................................6
d)..................................................................................................................................................6
e)..................................................................................................................................................6
TASK 6............................................................................................................................................6
1...................................................................................................................................................6
2...................................................................................................................................................7
TASK 7............................................................................................................................................7
PART 2............................................................................................................................................7
1...................................................................................................................................................7
2...................................................................................................................................................7
3...................................................................................................................................................8
4...................................................................................................................................................8
5...................................................................................................................................................8
6...................................................................................................................................................8
REFERENCES................................................................................................................................9
⊘ This is a preview!⊘
Do you want full access?
Subscribe today to unlock all pages.
Trusted by 1+ million students worldwide
PART 1
TASK 1
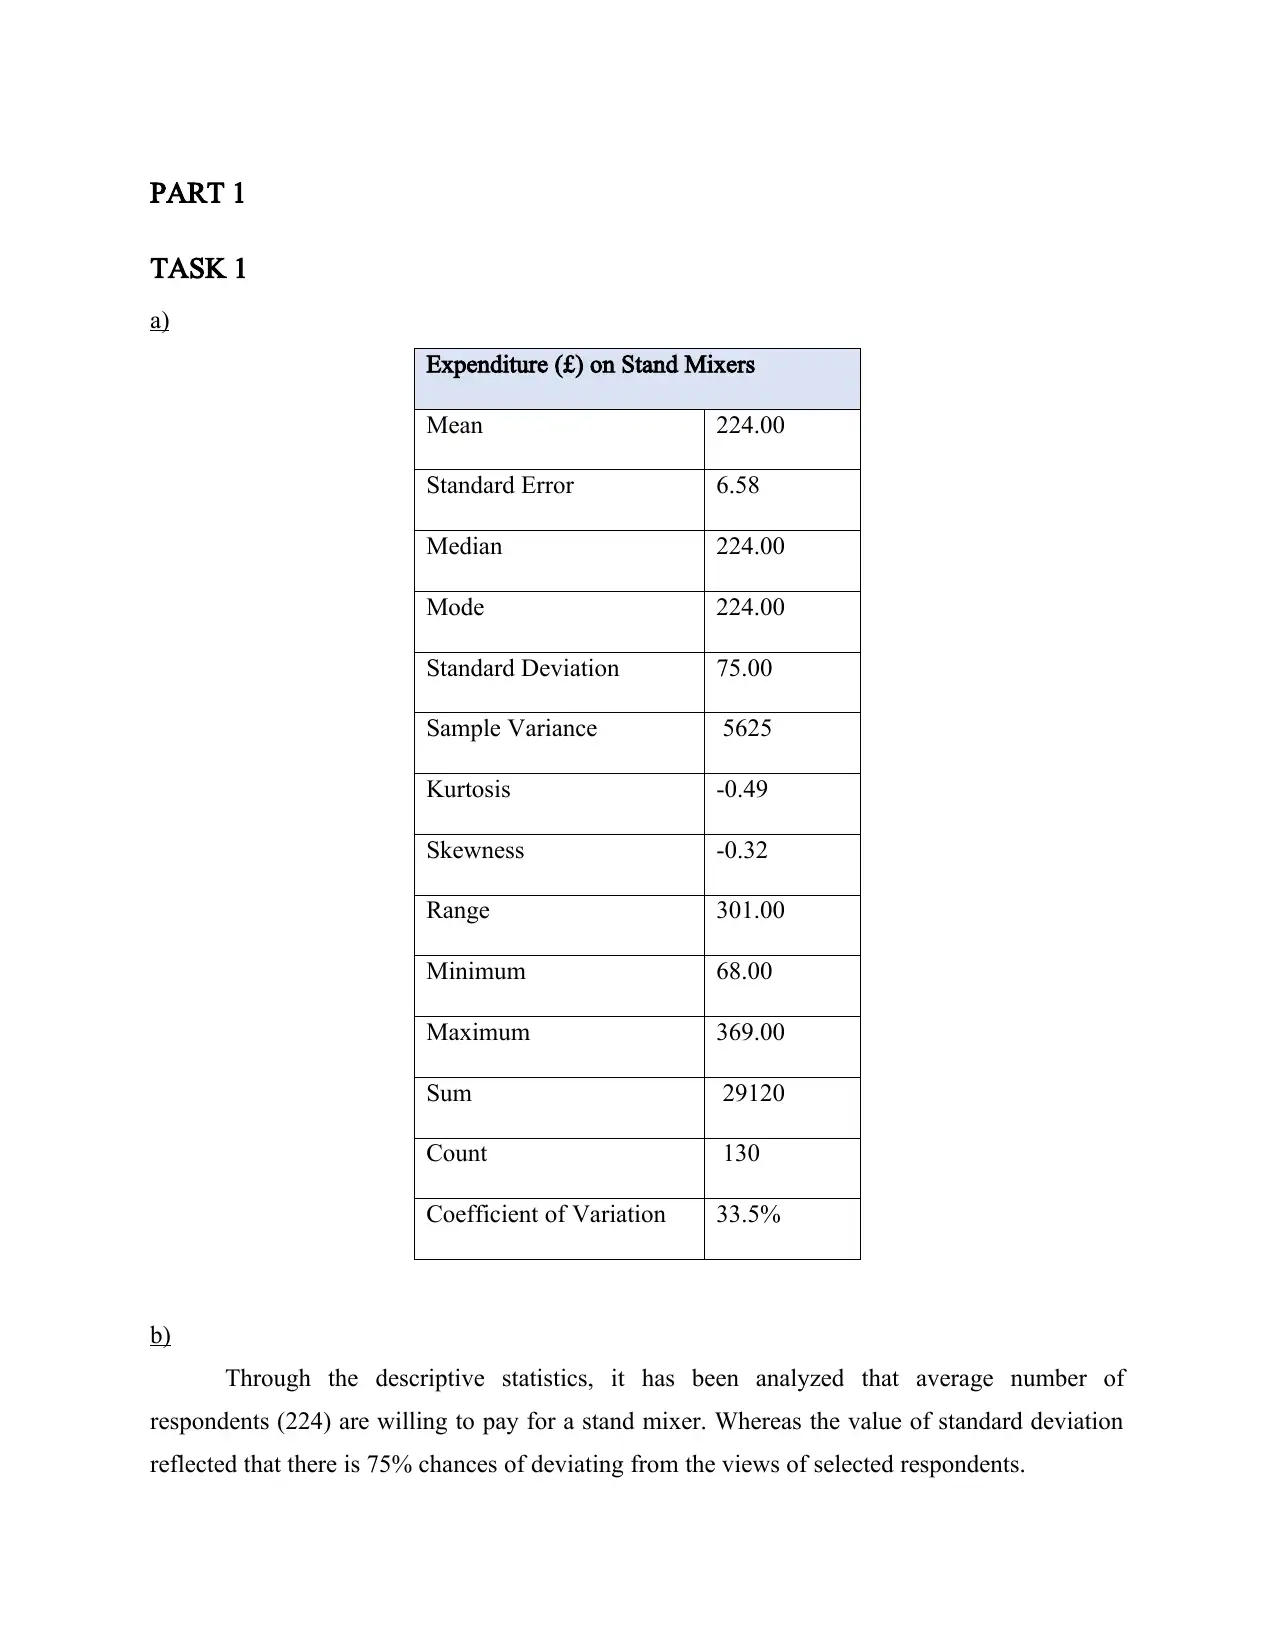
a)
Expenditure (£) on Stand Mixers
Mean 224.00
Standard Error 6.58
Median 224.00
Mode 224.00
Standard Deviation 75.00
Sample Variance 5625
Kurtosis -0.49
Skewness -0.32
Range 301.00
Minimum 68.00
Maximum 369.00
Sum 29120
Count 130
Coefficient of Variation 33.5%
b)
Through the descriptive statistics, it has been analyzed that average number of
respondents (224) are willing to pay for a stand mixer. Whereas the value of standard deviation
reflected that there is 75% chances of deviating from the views of selected respondents.
TASK 1
a)
Expenditure (£) on Stand Mixers
Mean 224.00
Standard Error 6.58
Median 224.00
Mode 224.00
Standard Deviation 75.00
Sample Variance 5625
Kurtosis -0.49
Skewness -0.32
Range 301.00
Minimum 68.00
Maximum 369.00
Sum 29120
Count 130
Coefficient of Variation 33.5%
b)
Through the descriptive statistics, it has been analyzed that average number of
respondents (224) are willing to pay for a stand mixer. Whereas the value of standard deviation
reflected that there is 75% chances of deviating from the views of selected respondents.
Paraphrase This Document
Need a fresh take? Get an instant paraphrase of this document with our AI Paraphraser
TASK 2
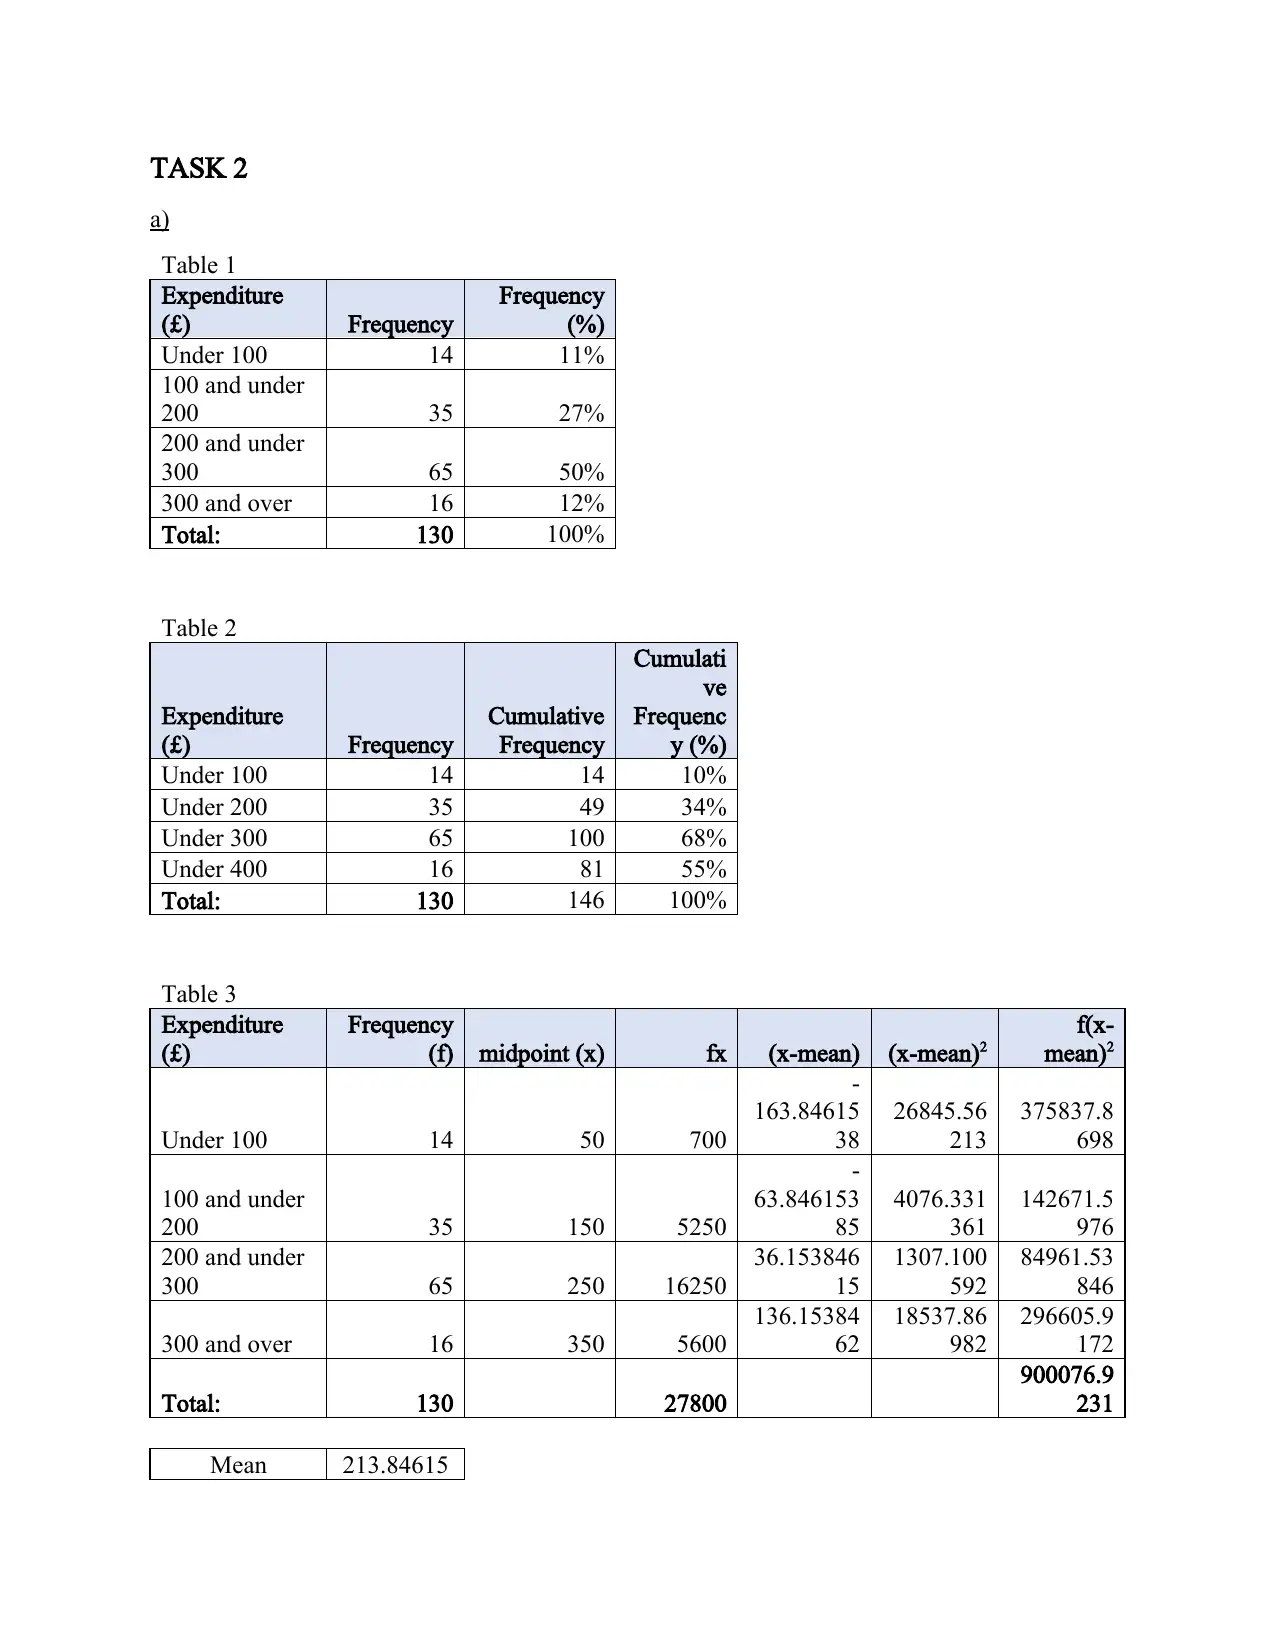
a)
Table 1
Expenditure
(£) Frequency
Frequency
(%)
Under 100 14 11%
100 and under
200 35 27%
200 and under
300 65 50%
300 and over 16 12%
Total: 130 100%
Table 2
Expenditure
(£) Frequency
Cumulative
Frequency
Cumulati
ve
Frequenc
y (%)
Under 100 14 14 10%
Under 200 35 49 34%
Under 300 65 100 68%
Under 400 16 81 55%
Total: 130 146 100%
Table 3
Expenditure
(£)
Frequency
(f) midpoint (x) fx (x-mean) (x-mean)2
f(x-
mean)2
Under 100 14 50 700
-
163.84615
38
26845.56
213
375837.8
698
100 and under
200 35 150 5250
-
63.846153
85
4076.331
361
142671.5
976
200 and under
300 65 250 16250
36.153846
15
1307.100
592
84961.53
846
300 and over 16 350 5600
136.15384
62
18537.86
982
296605.9
172
Total: 130 27800
900076.9
231
Mean 213.84615
38
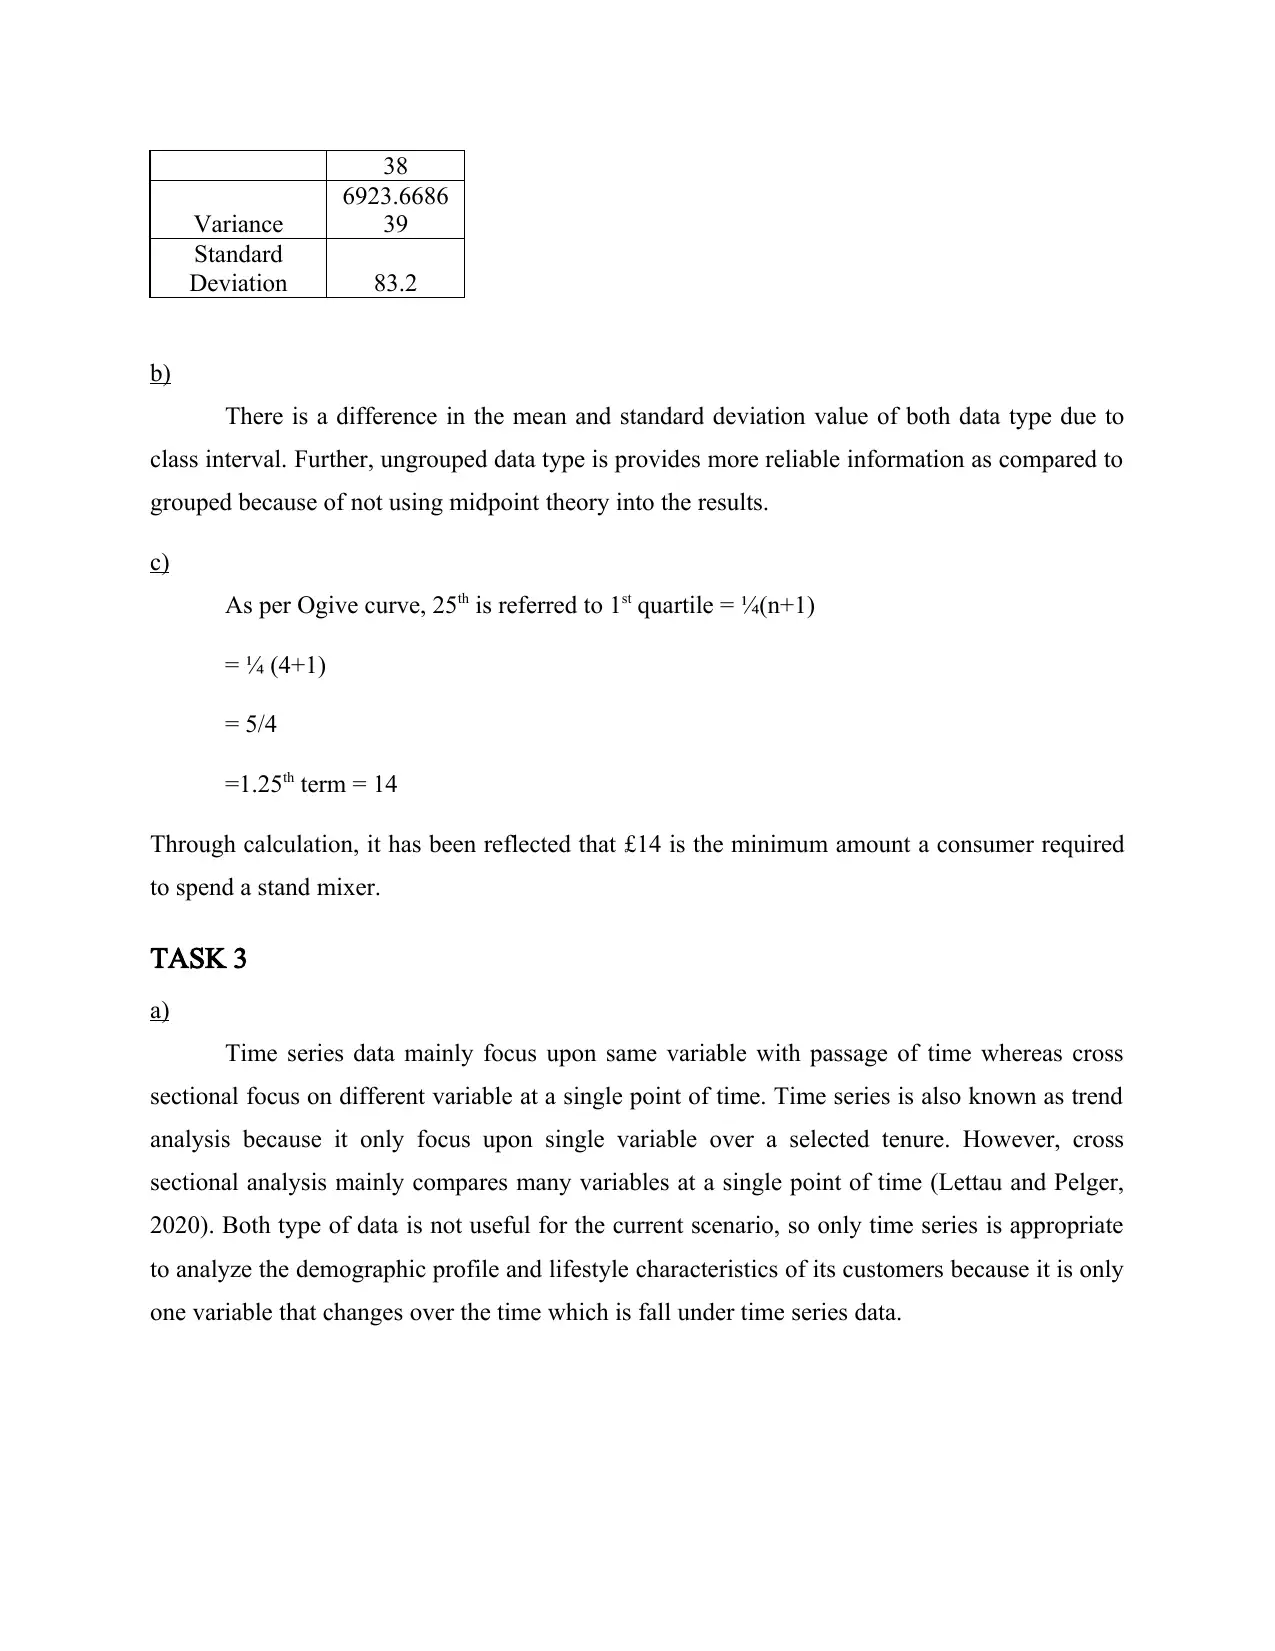
Variance
6923.6686
39
Standard
Deviation 83.2
b)
There is a difference in the mean and standard deviation value of both data type due to
class interval. Further, ungrouped data type is provides more reliable information as compared to
grouped because of not using midpoint theory into the results.
c)
As per Ogive curve, 25th is referred to 1st quartile = ¼(n+1)
= ¼ (4+1)
= 5/4
=1.25th term = 14
Through calculation, it has been reflected that £14 is the minimum amount a consumer required
to spend a stand mixer.
TASK 3
a)
Time series data mainly focus upon same variable with passage of time whereas cross
sectional focus on different variable at a single point of time. Time series is also known as trend
analysis because it only focus upon single variable over a selected tenure. However, cross
sectional analysis mainly compares many variables at a single point of time (Lettau and Pelger,
2020). Both type of data is not useful for the current scenario, so only time series is appropriate
to analyze the demographic profile and lifestyle characteristics of its customers because it is only
one variable that changes over the time which is fall under time series data.
⊘ This is a preview!⊘
Do you want full access?
Subscribe today to unlock all pages.
Trusted by 1+ million students worldwide
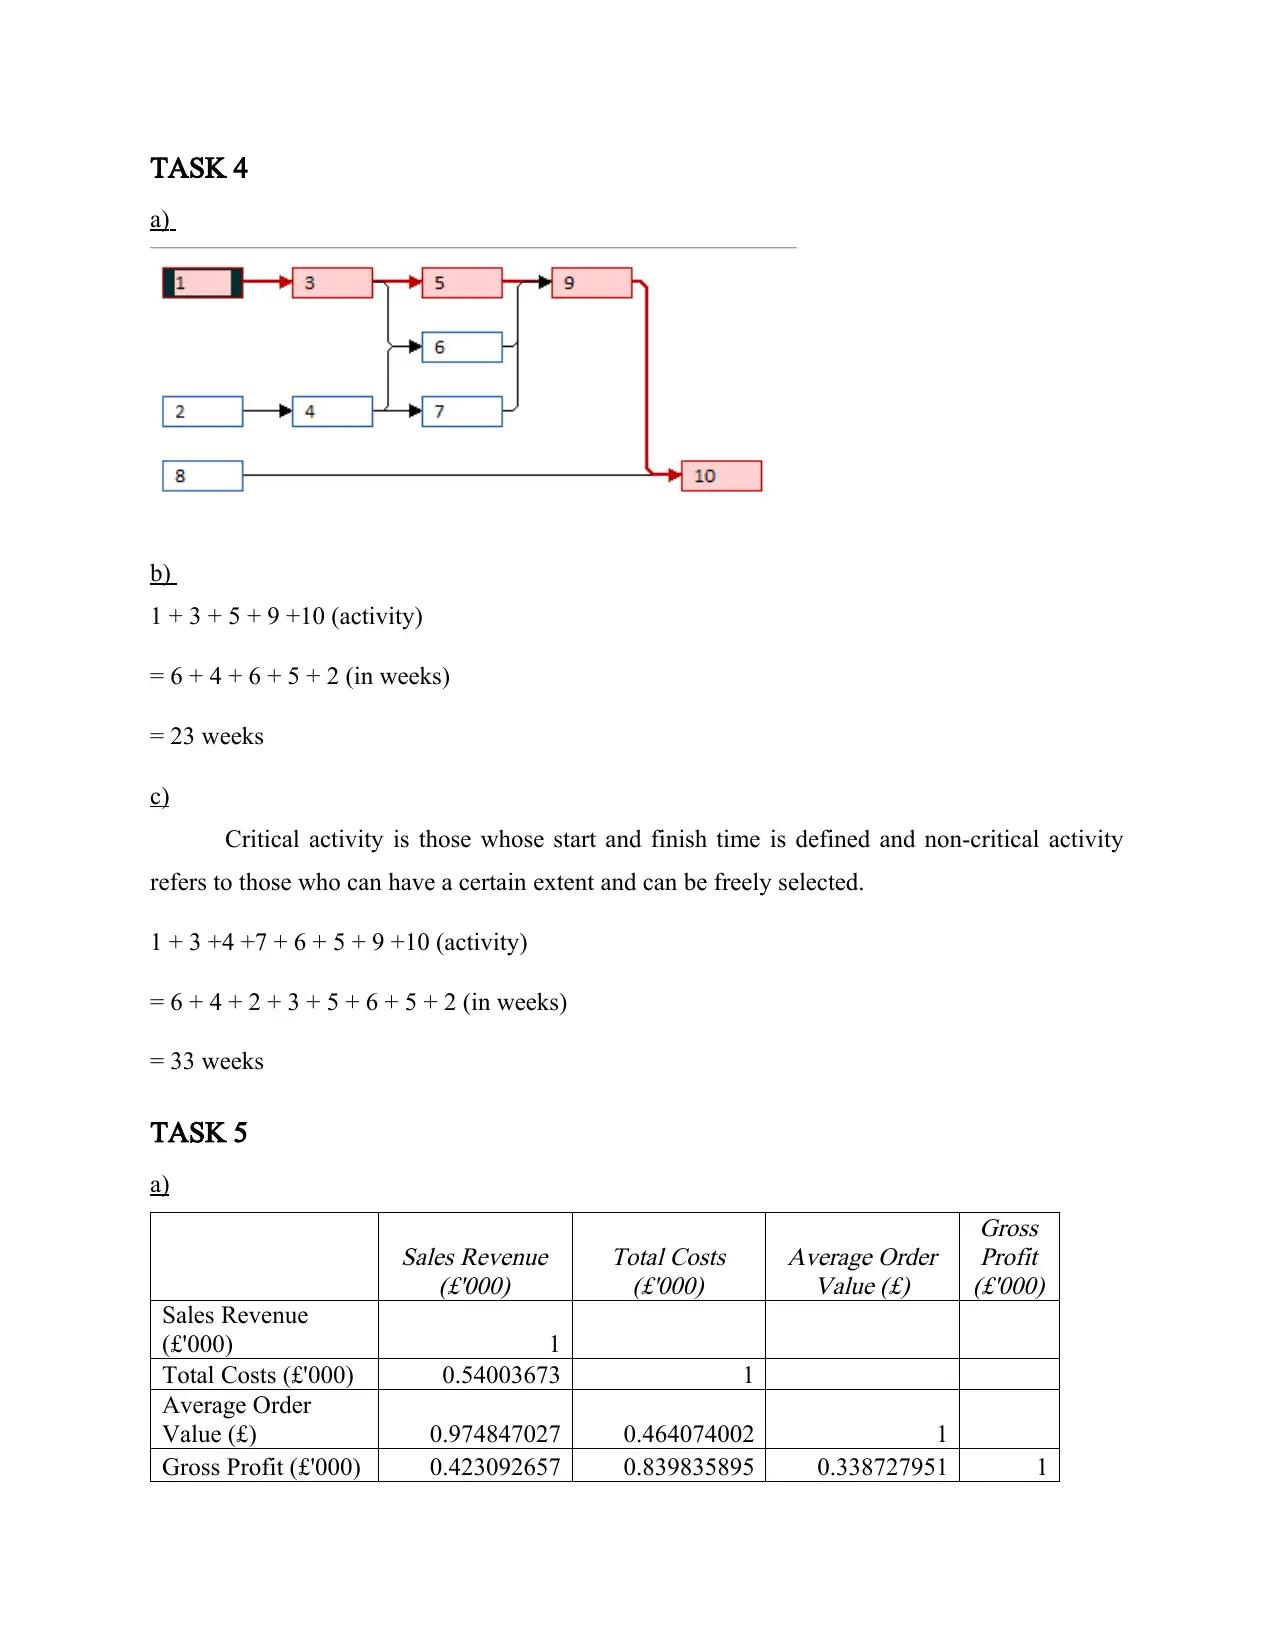
TASK 4
a)
b)
1 + 3 + 5 + 9 +10 (activity)
= 6 + 4 + 6 + 5 + 2 (in weeks)
= 23 weeks
c)
Critical activity is those whose start and finish time is defined and non-critical activity
refers to those who can have a certain extent and can be freely selected.
1 + 3 +4 +7 + 6 + 5 + 9 +10 (activity)
= 6 + 4 + 2 + 3 + 5 + 6 + 5 + 2 (in weeks)
= 33 weeks
TASK 5
a)
Sales Revenue
(£'000)
Total Costs
(£'000)
Average Order
Value (£)
Gross
Profit
(£'000)
Sales Revenue
(£'000) 1
Total Costs (£'000) 0.54003673 1
Average Order
Value (£) 0.974847027 0.464074002 1
Gross Profit (£'000) 0.423092657 0.839835895 0.338727951 1
a)
b)
1 + 3 + 5 + 9 +10 (activity)
= 6 + 4 + 6 + 5 + 2 (in weeks)
= 23 weeks
c)
Critical activity is those whose start and finish time is defined and non-critical activity
refers to those who can have a certain extent and can be freely selected.
1 + 3 +4 +7 + 6 + 5 + 9 +10 (activity)
= 6 + 4 + 2 + 3 + 5 + 6 + 5 + 2 (in weeks)
= 33 weeks
TASK 5
a)
Sales Revenue
(£'000)
Total Costs
(£'000)
Average Order
Value (£)
Gross
Profit
(£'000)
Sales Revenue
(£'000) 1
Total Costs (£'000) 0.54003673 1
Average Order
Value (£) 0.974847027 0.464074002 1
Gross Profit (£'000) 0.423092657 0.839835895 0.338727951 1
Paraphrase This Document
Need a fresh take? Get an instant paraphrase of this document with our AI Paraphraser
b)
From the above table, it has been identified that the best predictor is sales revenue
because of highly association with other variables.
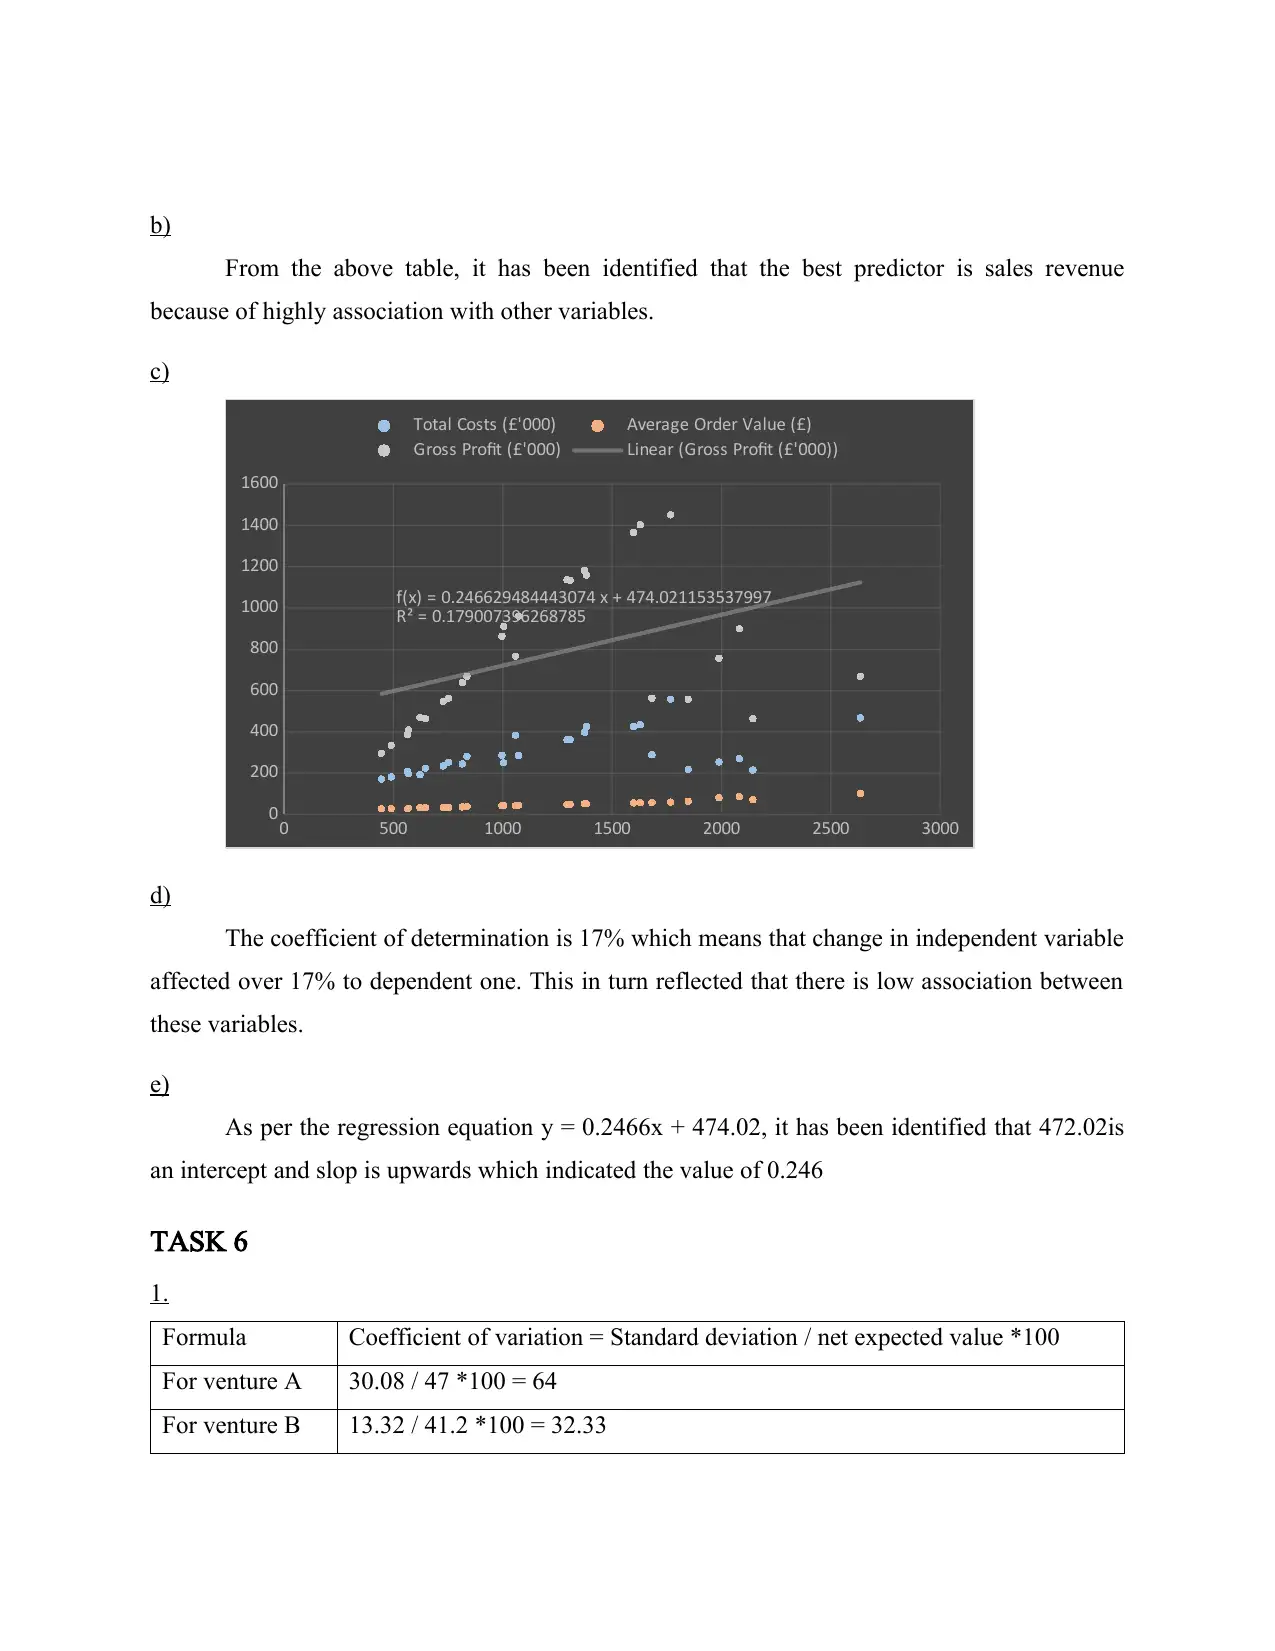
c)
0 500 1000 1500 2000 2500 3000
0
200
400
600
800
1000
1200
1400
1600
f(x) = 0.246629484443074 x + 474.021153537997
R² = 0.179007396268785
Total Costs (£'000) Average Order Value (£)
Gross Profit (£'000) Linear (Gross Profit (£'000))
d)
The coefficient of determination is 17% which means that change in independent variable
affected over 17% to dependent one. This in turn reflected that there is low association between
these variables.
e)
As per the regression equation y = 0.2466x + 474.02, it has been identified that 472.02is
an intercept and slop is upwards which indicated the value of 0.246
TASK 6
1.
Formula Coefficient of variation = Standard deviation / net expected value *100
For venture A 30.08 / 47 *100 = 64
For venture B 13.32 / 41.2 *100 = 32.33
From the above table, it has been identified that the best predictor is sales revenue
because of highly association with other variables.
c)
0 500 1000 1500 2000 2500 3000
0
200
400
600
800
1000
1200
1400
1600
f(x) = 0.246629484443074 x + 474.021153537997
R² = 0.179007396268785
Total Costs (£'000) Average Order Value (£)
Gross Profit (£'000) Linear (Gross Profit (£'000))
d)
The coefficient of determination is 17% which means that change in independent variable
affected over 17% to dependent one. This in turn reflected that there is low association between
these variables.
e)
As per the regression equation y = 0.2466x + 474.02, it has been identified that 472.02is
an intercept and slop is upwards which indicated the value of 0.246
TASK 6
1.
Formula Coefficient of variation = Standard deviation / net expected value *100
For venture A 30.08 / 47 *100 = 64
For venture B 13.32 / 41.2 *100 = 32.33
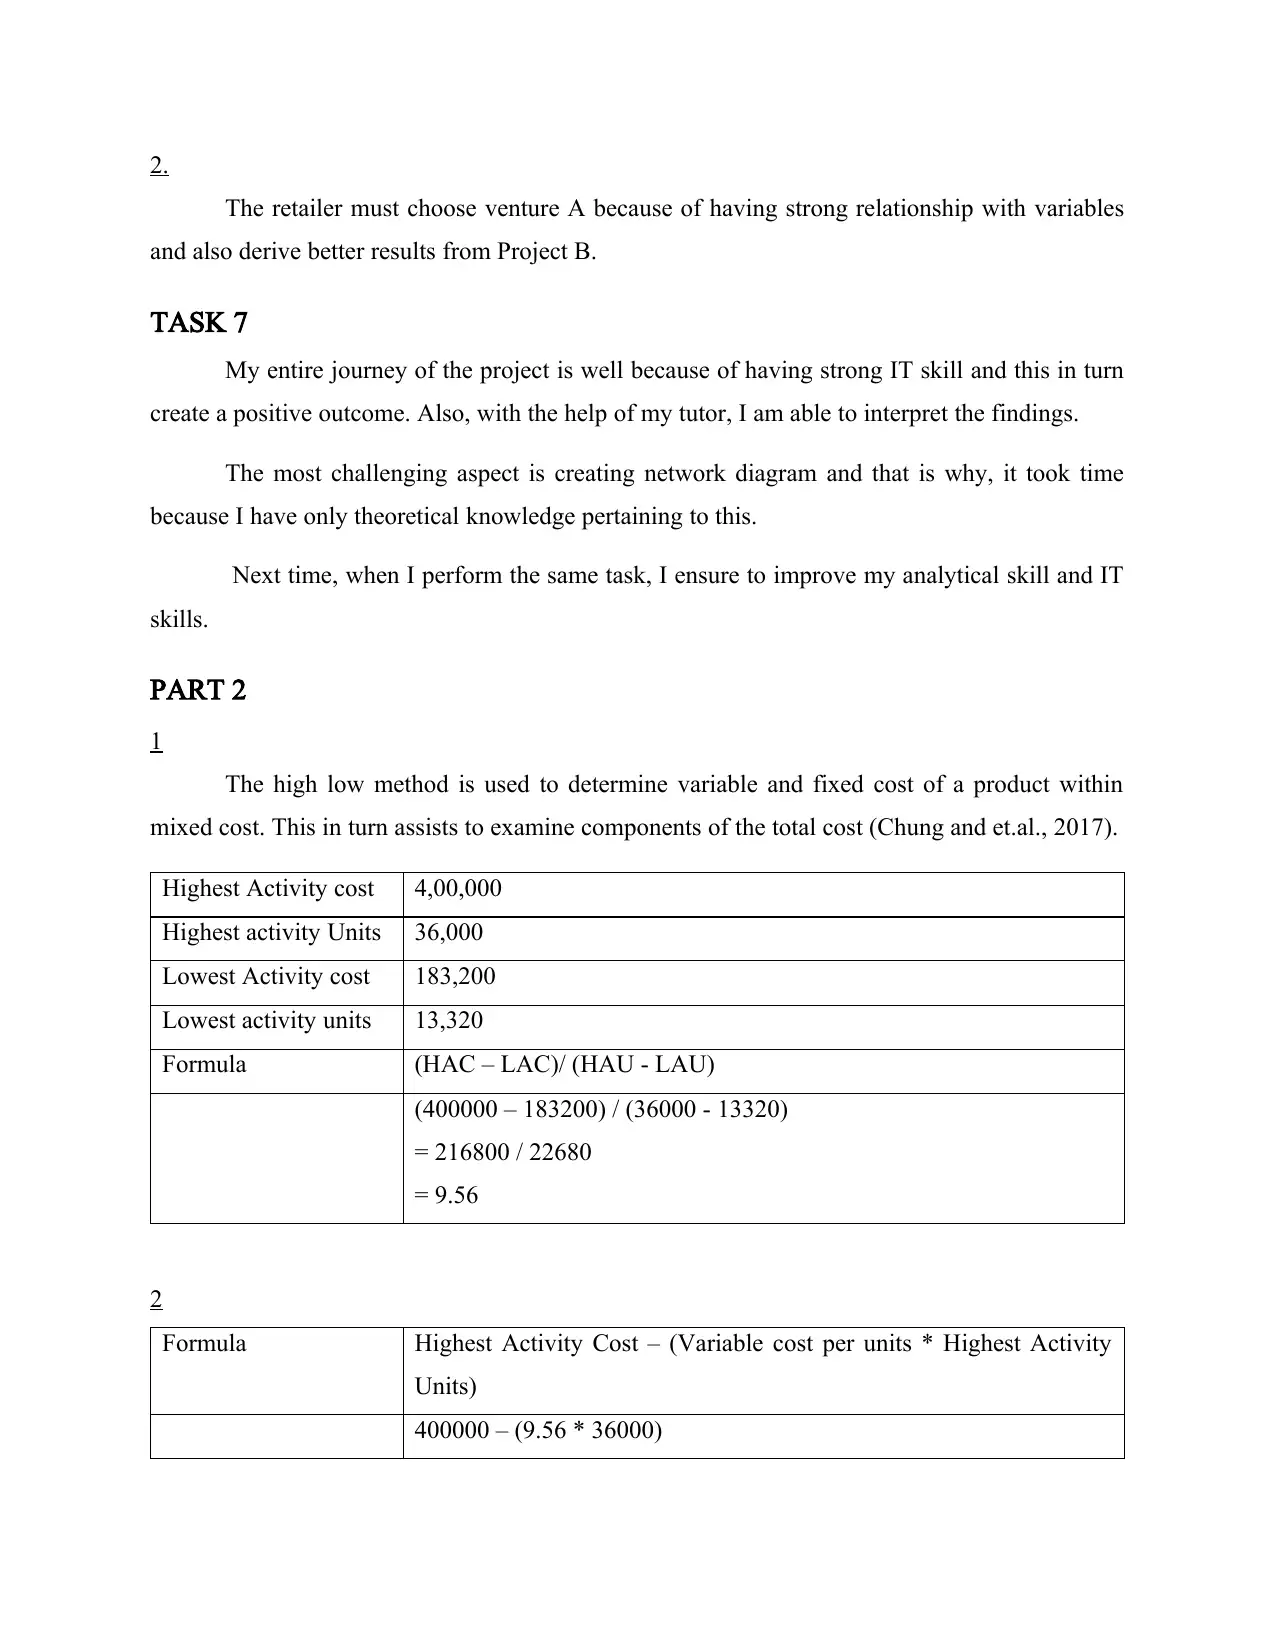
2.
The retailer must choose venture A because of having strong relationship with variables
and also derive better results from Project B.
TASK 7
My entire journey of the project is well because of having strong IT skill and this in turn
create a positive outcome. Also, with the help of my tutor, I am able to interpret the findings.
The most challenging aspect is creating network diagram and that is why, it took time
because I have only theoretical knowledge pertaining to this.
Next time, when I perform the same task, I ensure to improve my analytical skill and IT
skills.
PART 2
1
The high low method is used to determine variable and fixed cost of a product within
mixed cost. This in turn assists to examine components of the total cost (Chung and et.al., 2017).
Highest Activity cost 4,00,000
Highest activity Units 36,000
Lowest Activity cost 183,200
Lowest activity units 13,320
Formula (HAC – LAC)/ (HAU - LAU)
(400000 – 183200) / (36000 - 13320)
= 216800 / 22680
= 9.56
2
Formula Highest Activity Cost – (Variable cost per units * Highest Activity
Units)
400000 – (9.56 * 36000)
⊘ This is a preview!⊘
Do you want full access?
Subscribe today to unlock all pages.
Trusted by 1+ million students worldwide
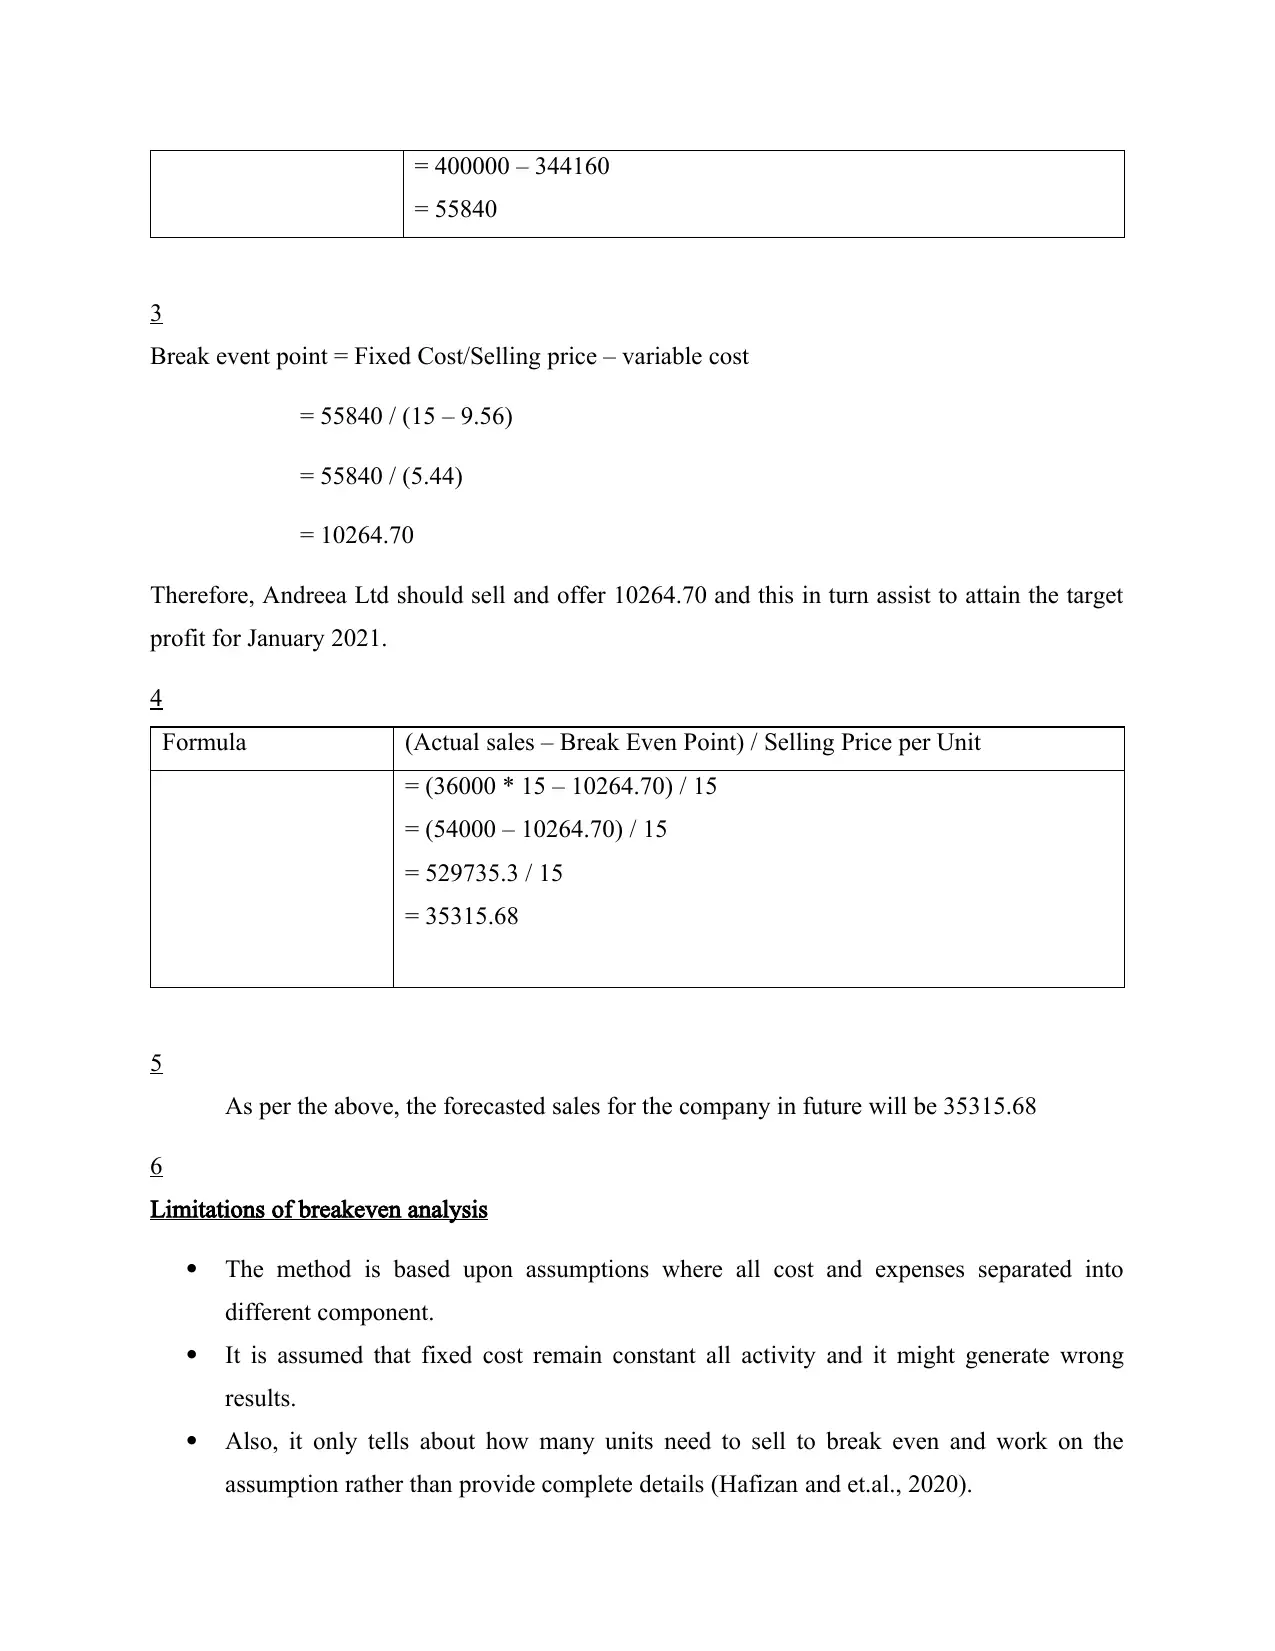
= 400000 – 344160
= 55840
3
Break event point = Fixed Cost/Selling price – variable cost
= 55840 / (15 – 9.56)
= 55840 / (5.44)
= 10264.70
Therefore, Andreea Ltd should sell and offer 10264.70 and this in turn assist to attain the target
profit for January 2021.
4
Formula (Actual sales – Break Even Point) / Selling Price per Unit
= (36000 * 15 – 10264.70) / 15
= (54000 – 10264.70) / 15
= 529735.3 / 15
= 35315.68
5
As per the above, the forecasted sales for the company in future will be 35315.68
6
Limitations of breakeven analysis
The method is based upon assumptions where all cost and expenses separated into
different component.
It is assumed that fixed cost remain constant all activity and it might generate wrong
results.
Also, it only tells about how many units need to sell to break even and work on the
assumption rather than provide complete details (Hafizan and et.al., 2020).
Paraphrase This Document
Need a fresh take? Get an instant paraphrase of this document with our AI Paraphraser
REFERENCES
Books and Journals
Chung, J.M. and et.al., 2017. High, low, and in between: Self-esteem development from middle
childhood to young adulthood.
Journal of Research in Personality. 70. pp.122-133.
Hafizan, A.M. and et.al., 2020. Design of optimal heat exchanger network with fluctuation
probability using break-even analysis.
Energy. 212. p.118583.
Lettau, M. and Pelger, M., 2020. Factors that fit the time series and cross-section of stock
returns.
The Review of Financial Studies. 33(5). pp.2274-2325.
1 out of 11
Related Documents


Your All-in-One AI-Powered Toolkit for Academic Success.
+13062052269
info@desklib.com
Available 24*7 on WhatsApp / Email
![[object Object]](/_next/static/media/star-bottom.7253800d.svg)
Unlock your academic potential
© 2024 | Zucol Services PVT LTD | All rights reserved.