BSBINM601 Project: Analyzing Information and Business Decision Making
VerifiedAdded on 2023/06/10
|10
|433
|320
Project
AI Summary
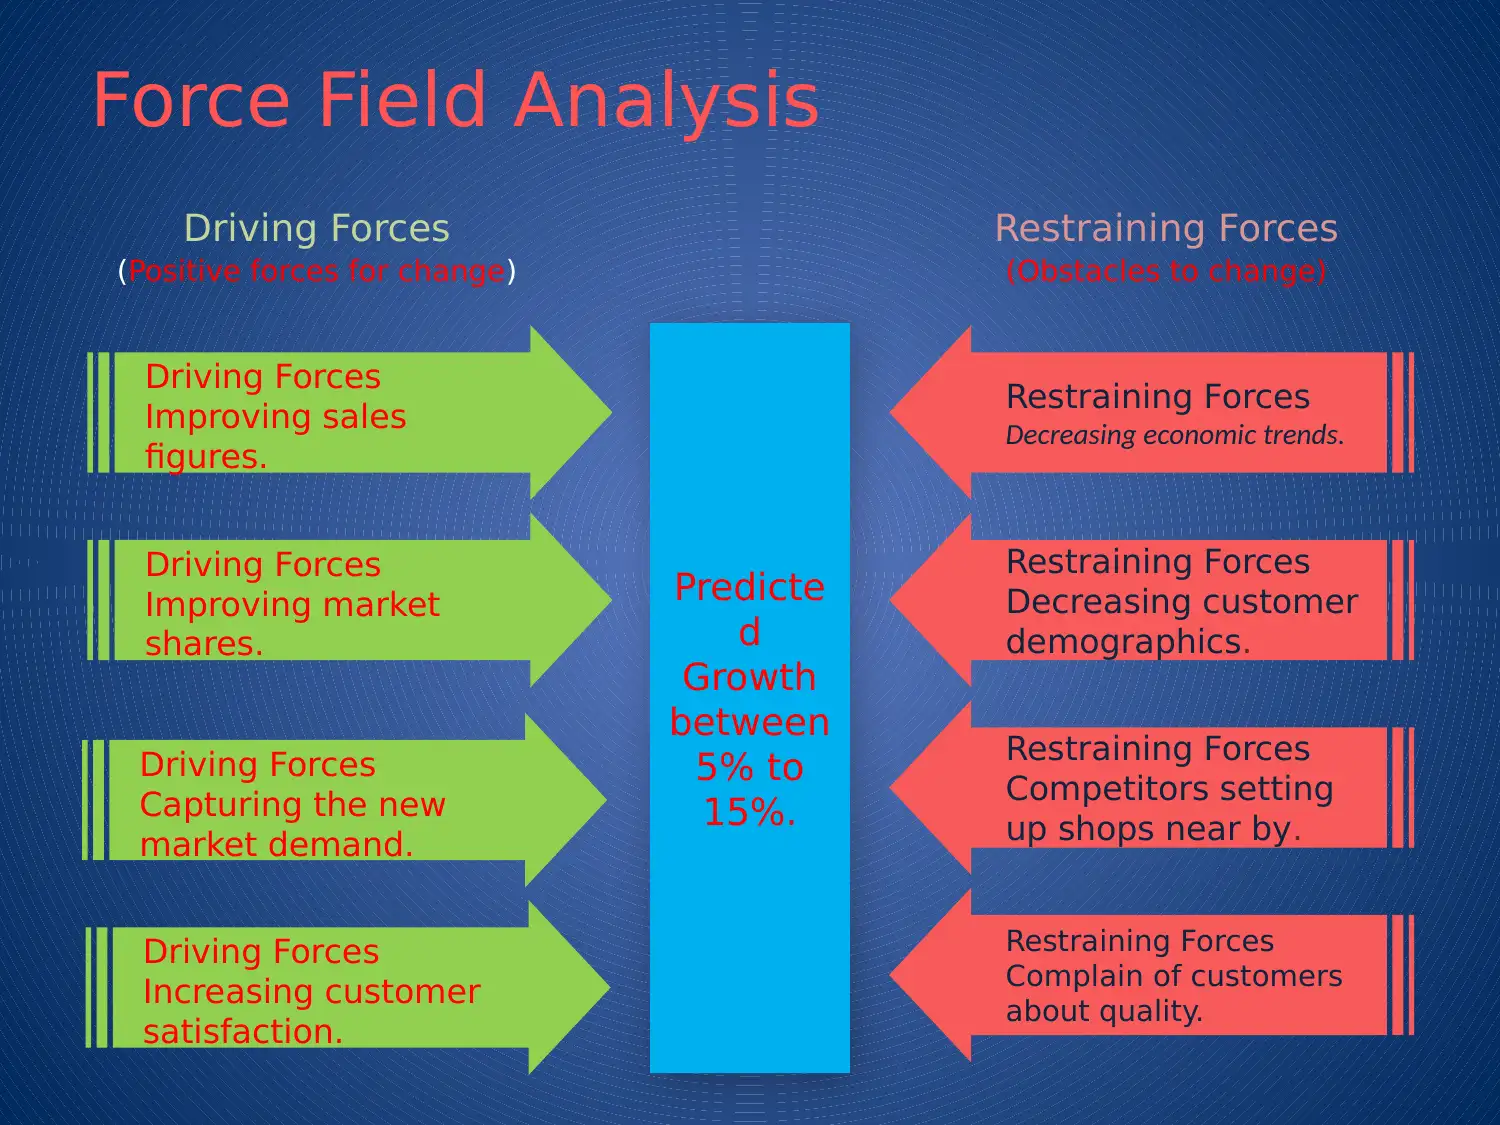
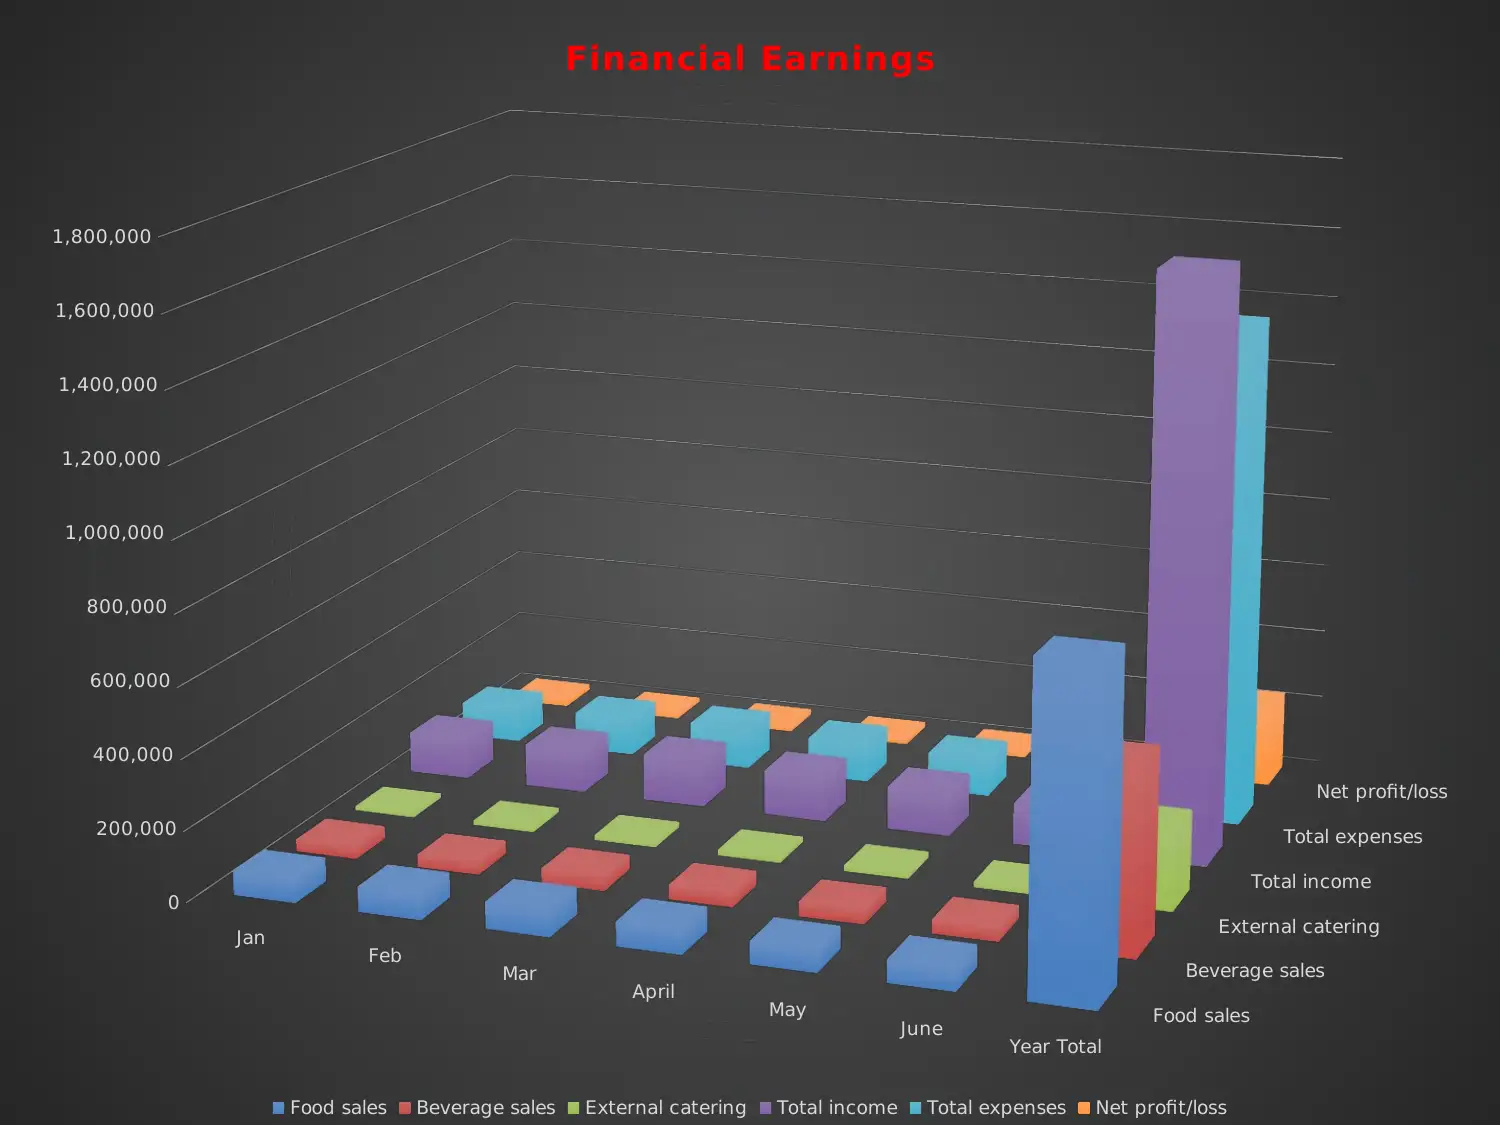
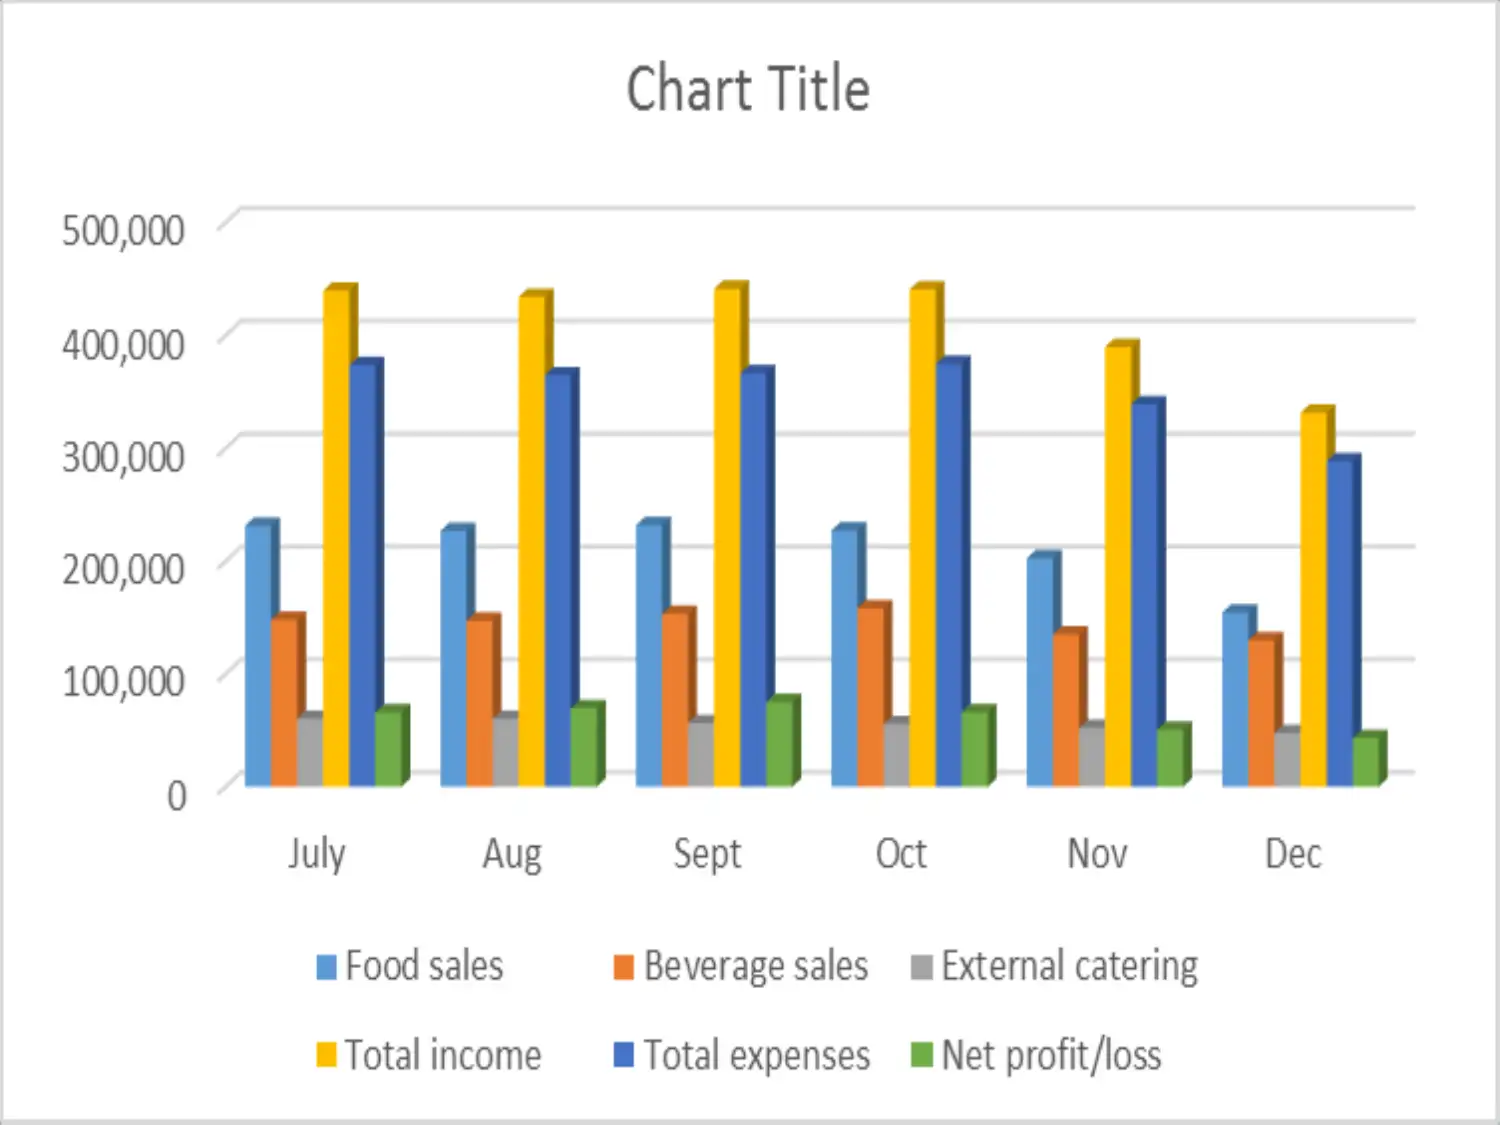
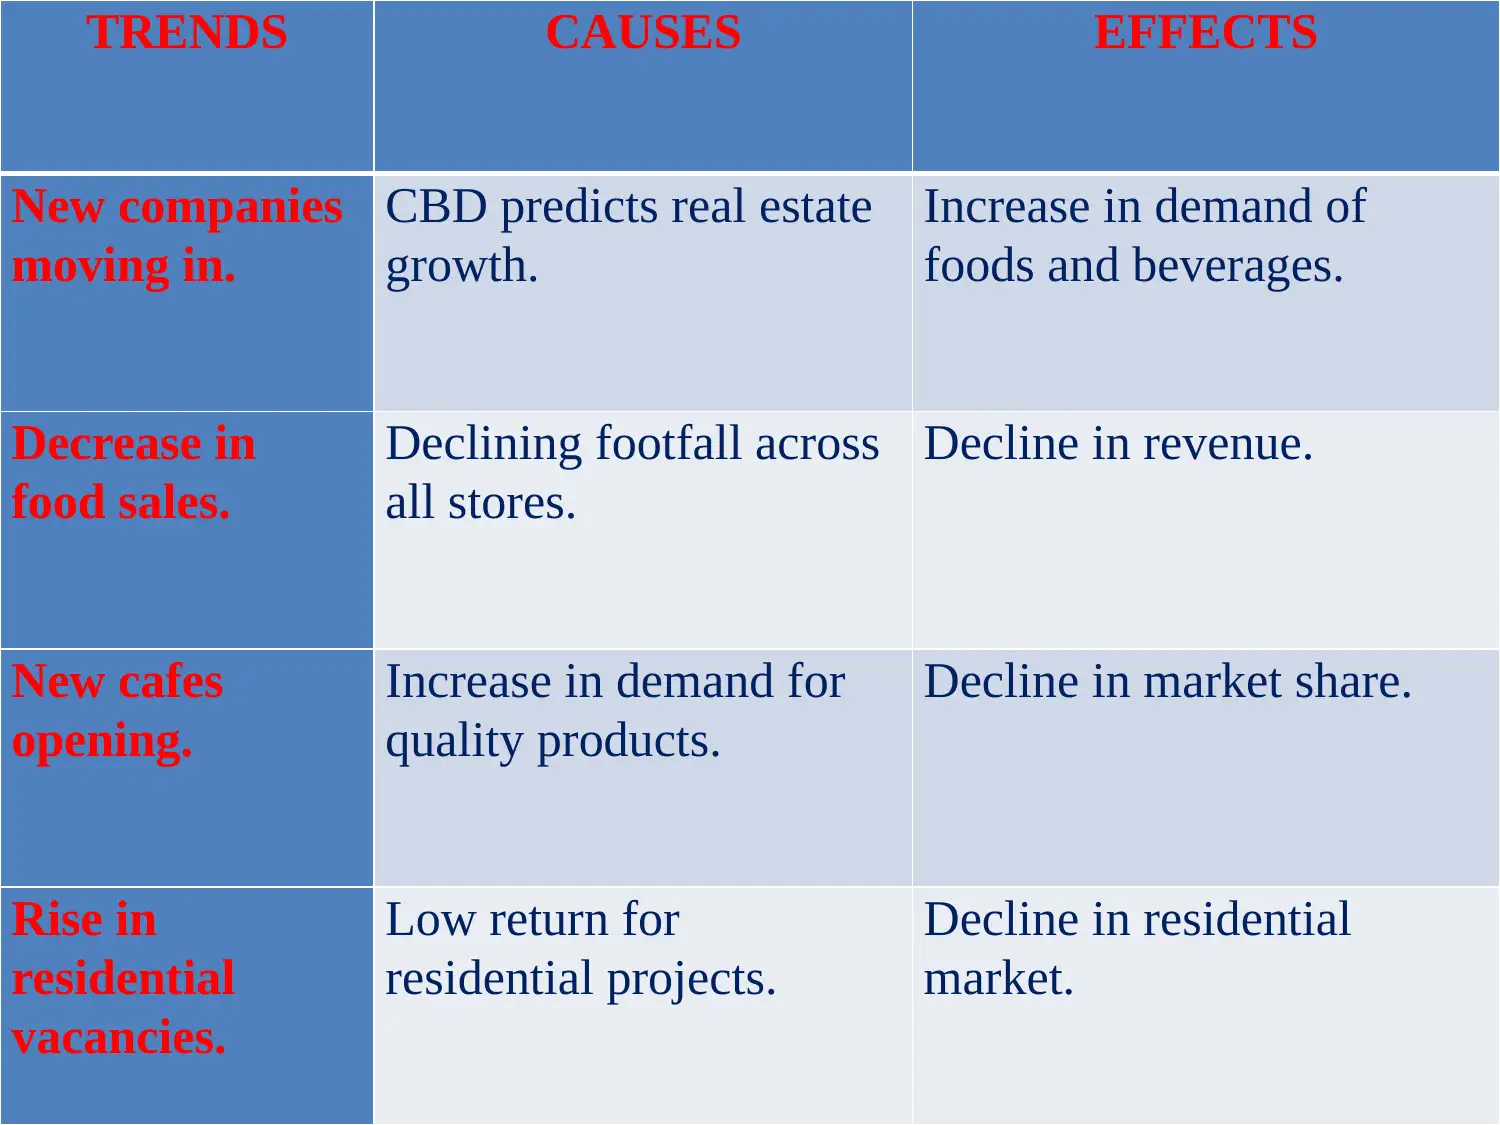
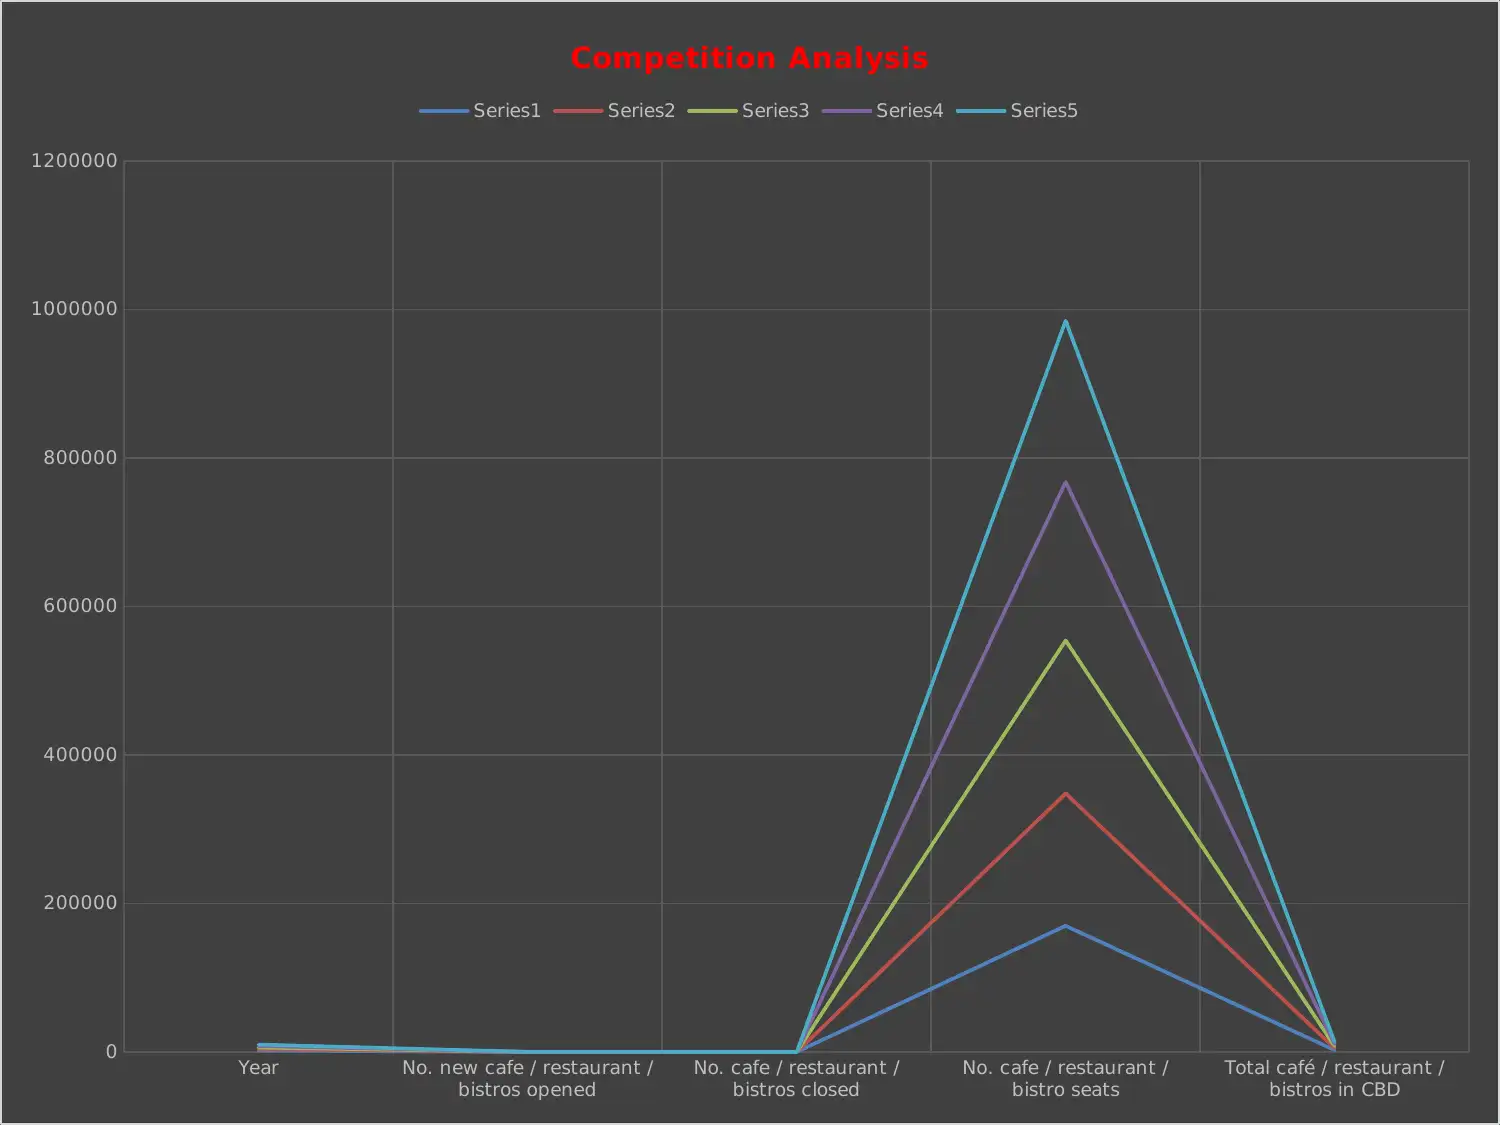
This project analyzes CoffeeVille's business performance, utilizing the provided data and scenario information to identify patterns, trends, and potential causes of business issues. The analysis includes a force field analysis, financial data review, and market trend assessment. The project also focus...

Rufus and Emma
Belcastran
Owner/ Managers
Store Managers
Baristas
Food
service
attendants
Cooks
Belcastran
Owner/ Managers
Store Managers
Baristas
Food
service
attendants
Cooks
Paraphrase This Document
Need a fresh take? Get an instant paraphrase of this document with our AI Paraphraser

Force Field Analysis
Predicte
d
Growth
between
5% to
15%.
Driving Forces
Improving sales
figures.
Restraining Forces
Decreasing economic trends.
Driving Forces
Improving market
shares.
Restraining Forces
Decreasing customer
demographics.
Driving Forces
Capturing the new
market demand.
Restraining Forces
Competitors setting
up shops near by.
Driving Forces
Increasing customer
satisfaction.
Restraining Forces
Complain of customers
about quality.
Driving Forces
(Positive forces for change)
Restraining Forces
(Obstacles to change)

Jan Feb Mar April May June Year Total
0
200,000
400,000
600,000
800,000
1,000,000
1,200,000
1,400,000
1,600,000
1,800,000
Food sales
Beverage sales
External catering
Total income
Total expenses
Net profit/loss
Financial Earnings
Food sales Beverage sales External catering Total income Total expenses Net profit/loss
0
200,000
400,000
600,000
800,000
1,000,000
1,200,000
1,400,000
1,600,000
1,800,000
Food sales
Beverage sales
External catering
Total income
Total expenses
Net profit/loss
Financial Earnings
Food sales Beverage sales External catering Total income Total expenses Net profit/loss
⊘ This is a preview!⊘
Do you want full access?
Subscribe today to unlock all pages.

Trusted by 1+ million students worldwide

Paraphrase This Document
Need a fresh take? Get an instant paraphrase of this document with our AI Paraphraser

Jan-Feb Mar-Apr May-jun Jul-Aug Sep-Oct Nov-Dec
-100%
-80%
-60%
-40%
-20%
0%
20%
Budget Variance
Food sales Beverage sales External catering Total income Total expenses Net profit/loss
-100%
-80%
-60%
-40%
-20%
0%
20%
Budget Variance
Food sales Beverage sales External catering Total income Total expenses Net profit/loss

Aug Sept Oct Nov Dec-14 Jan-15 Feb Mar April May June
$-
$10,000
$20,000
$30,000
$40,000
$50,000
$60,000
$70,000
Store 2 Forecasted sales 2015-16
Food sales
Beverage sales
External catering
$-
$10,000
$20,000
$30,000
$40,000
$50,000
$60,000
$70,000
Store 2 Forecasted sales 2015-16
Food sales
Beverage sales
External catering
⊘ This is a preview!⊘
Do you want full access?
Subscribe today to unlock all pages.

Trusted by 1+ million students worldwide

July Aug Sept Oct Nov Dec-14 Jan-15 Feb Mar April May June
$-
$2,000
$4,000
$6,000
$8,000
$10,000
$12,000
$14,000
$16,000
$18,000
$20,000
Store 2 - Forecasted net profi t 2015-16
Net profit
$-
$2,000
$4,000
$6,000
$8,000
$10,000
$12,000
$14,000
$16,000
$18,000
$20,000
Store 2 - Forecasted net profi t 2015-16
Net profit
Paraphrase This Document
Need a fresh take? Get an instant paraphrase of this document with our AI Paraphraser

Breakfast options
Sandwiches bar wraps
Hot items
Sweet baked goods
Hot beverages
Milkshakes and iced
coffees
Packaged drinks
$0.00 $200.00 $400.00 $600.00 $800.00 $1,000.00 $1,200.00 $1,400.00 $1,600.00 $1,800.00
Predicted growth
Average spend Average No. of sales per day per store
Current average revenue per day per store Proposed price reduction

TRENDS CAUSES EFFECTS
New companies
moving in.
CBD predicts real estate
growth.
Increase in demand of
foods and beverages.
Decrease in
food sales.
Declining footfall across
all stores.
Decline in revenue.
New cafes
opening.
Increase in demand for
quality products.
Decline in market share.
Rise in
residential
vacancies.
Low return for
residential projects.
Decline in residential
market.
⊘ This is a preview!⊘
Do you want full access?
Subscribe today to unlock all pages.

Trusted by 1+ million students worldwide

Year No. new cafe / restaurant /
bistros opened
No. cafe / restaurant /
bistros closed
No. cafe / restaurant /
bistro seats
Total café / restaurant /
bistros in CBD
0
200000
400000
600000
800000
1000000
1200000
Competition Analysis
Series1 Series2 Series3 Series4 Series5
bistros opened
No. cafe / restaurant /
bistros closed
No. cafe / restaurant /
bistro seats
Total café / restaurant /
bistros in CBD
0
200000
400000
600000
800000
1000000
1200000
Competition Analysis
Series1 Series2 Series3 Series4 Series5
1 out of 10
Related Documents

Your All-in-One AI-Powered Toolkit for Academic Success.
+13062052269
info@desklib.com
Available 24*7 on WhatsApp / Email
Unlock your academic potential
© 2024 | Zucol Services PVT LTD | All rights reserved.