BUSN1009 - Quantitative Methods: Probability Distributions Analysis

Verified

Added on  2023/06/08

|10
|1995
|133
Homework Assignment
AI Summary
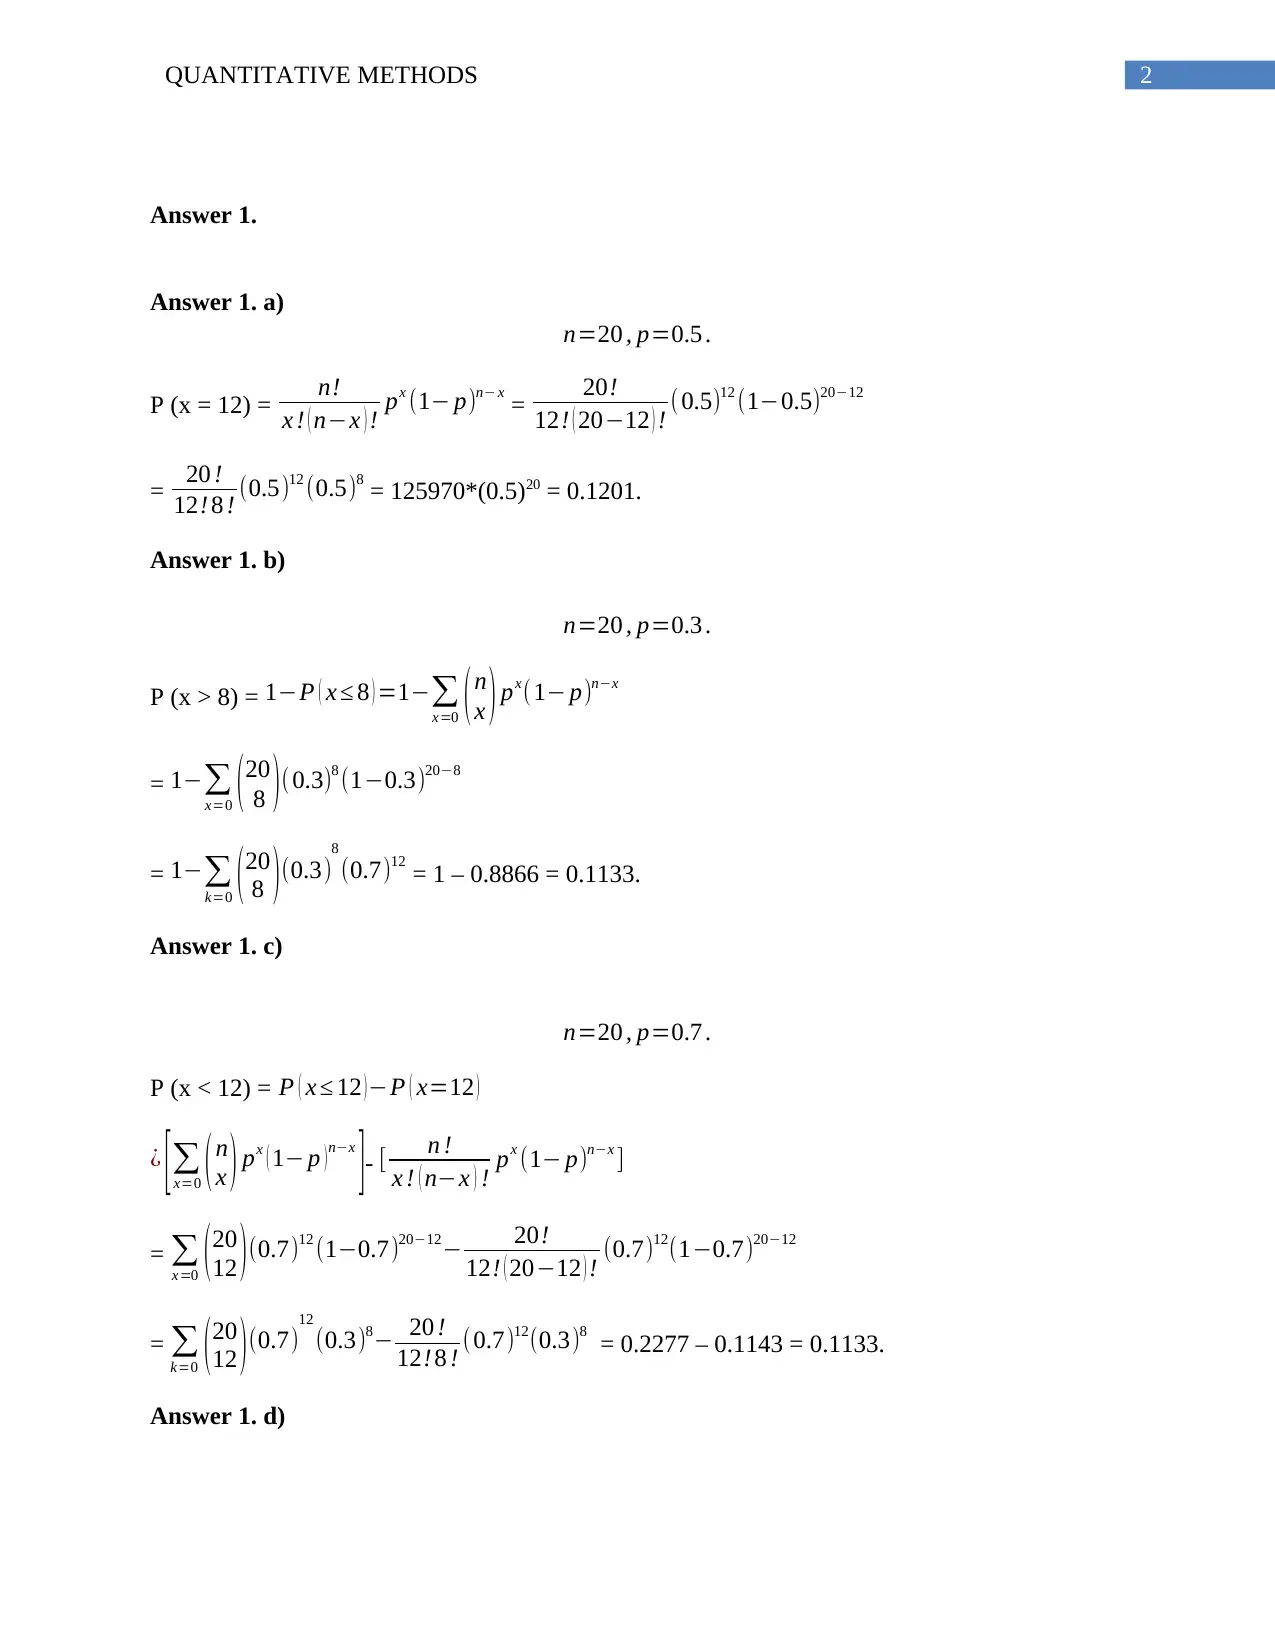
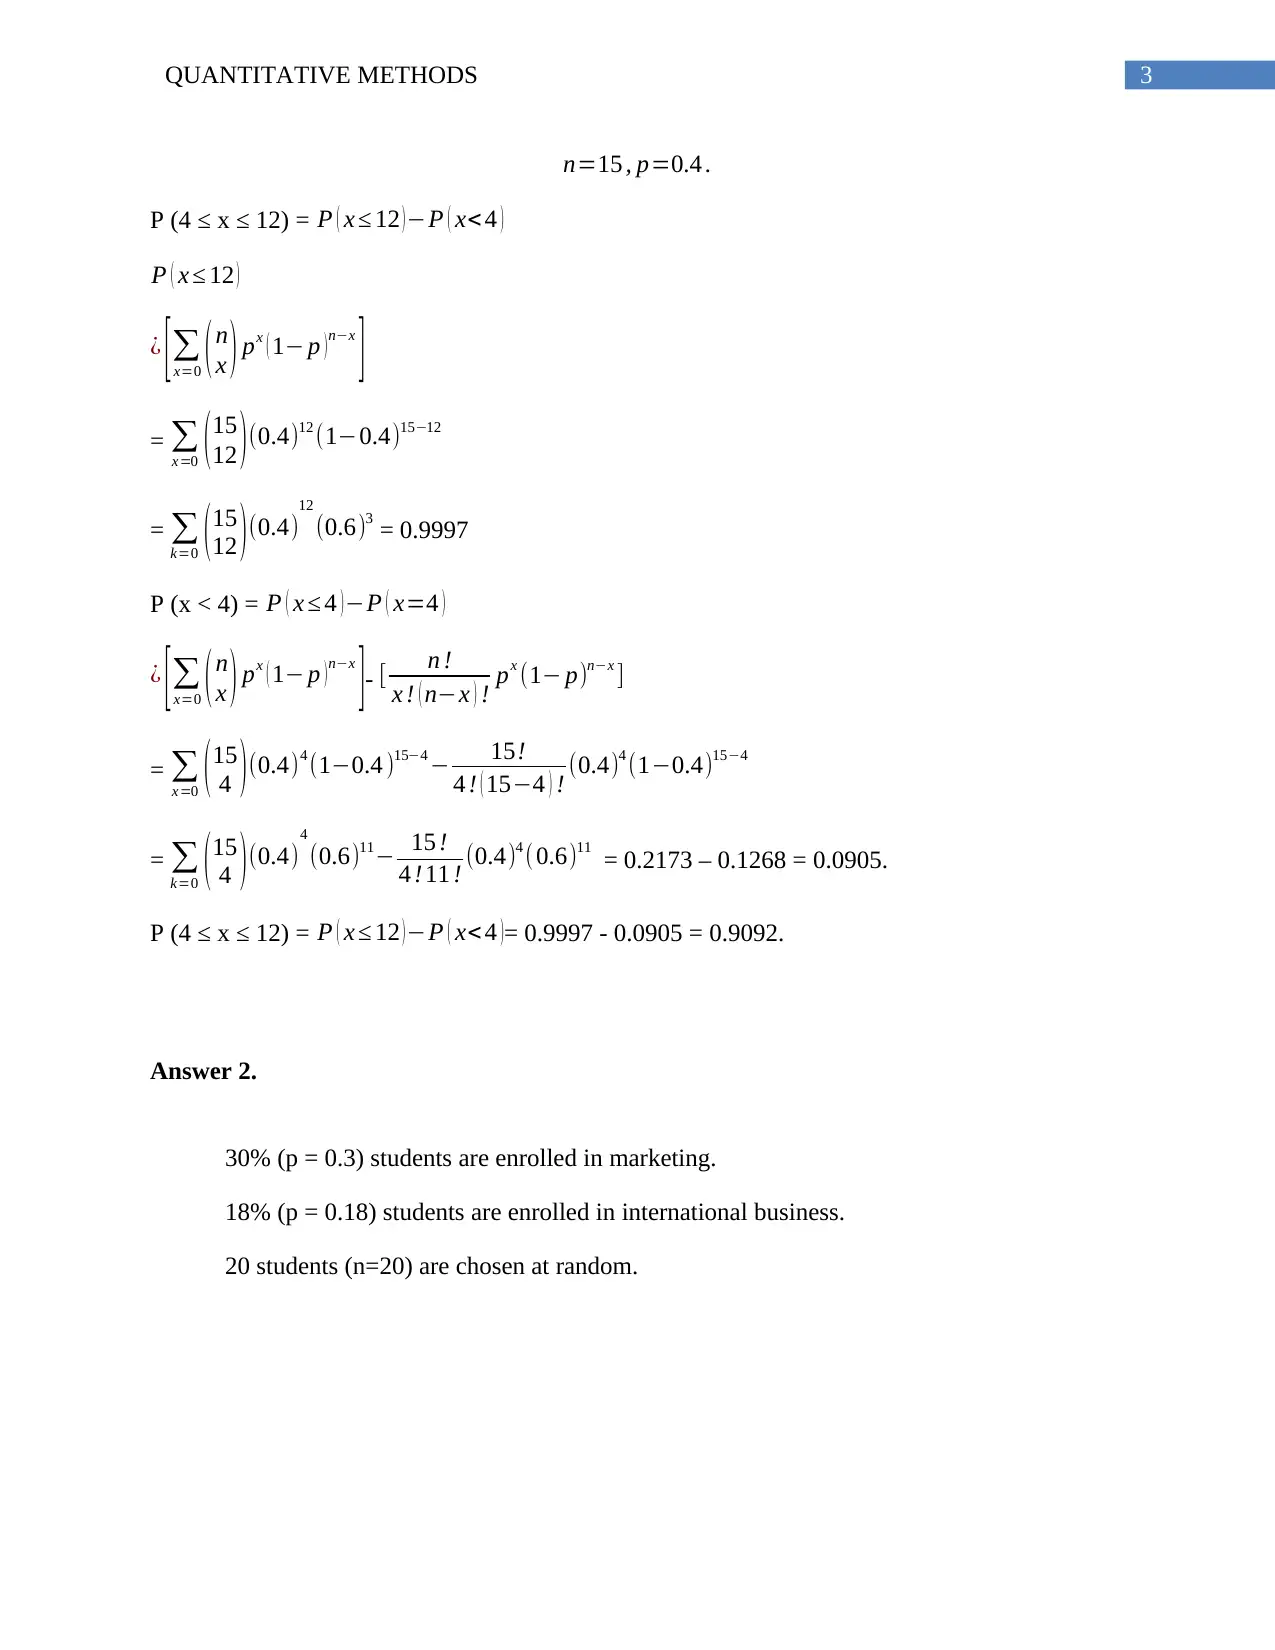
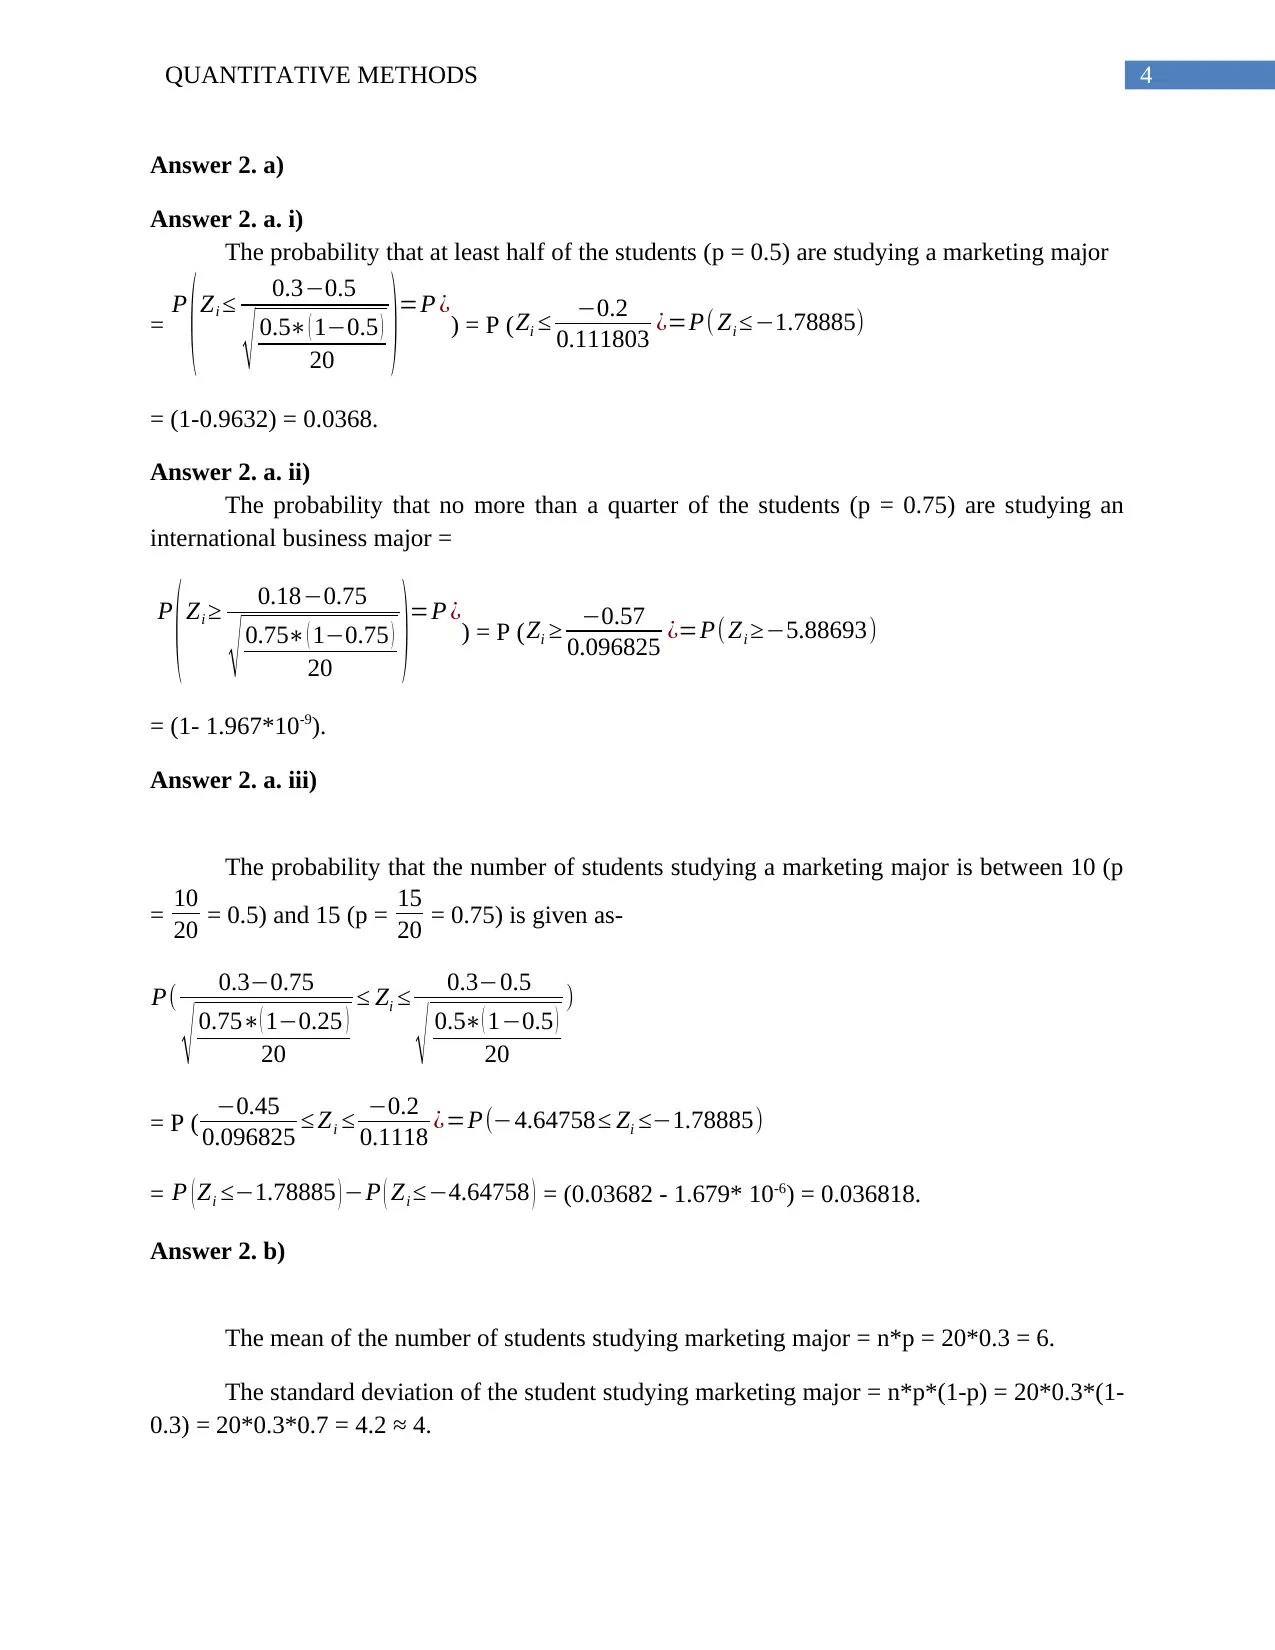
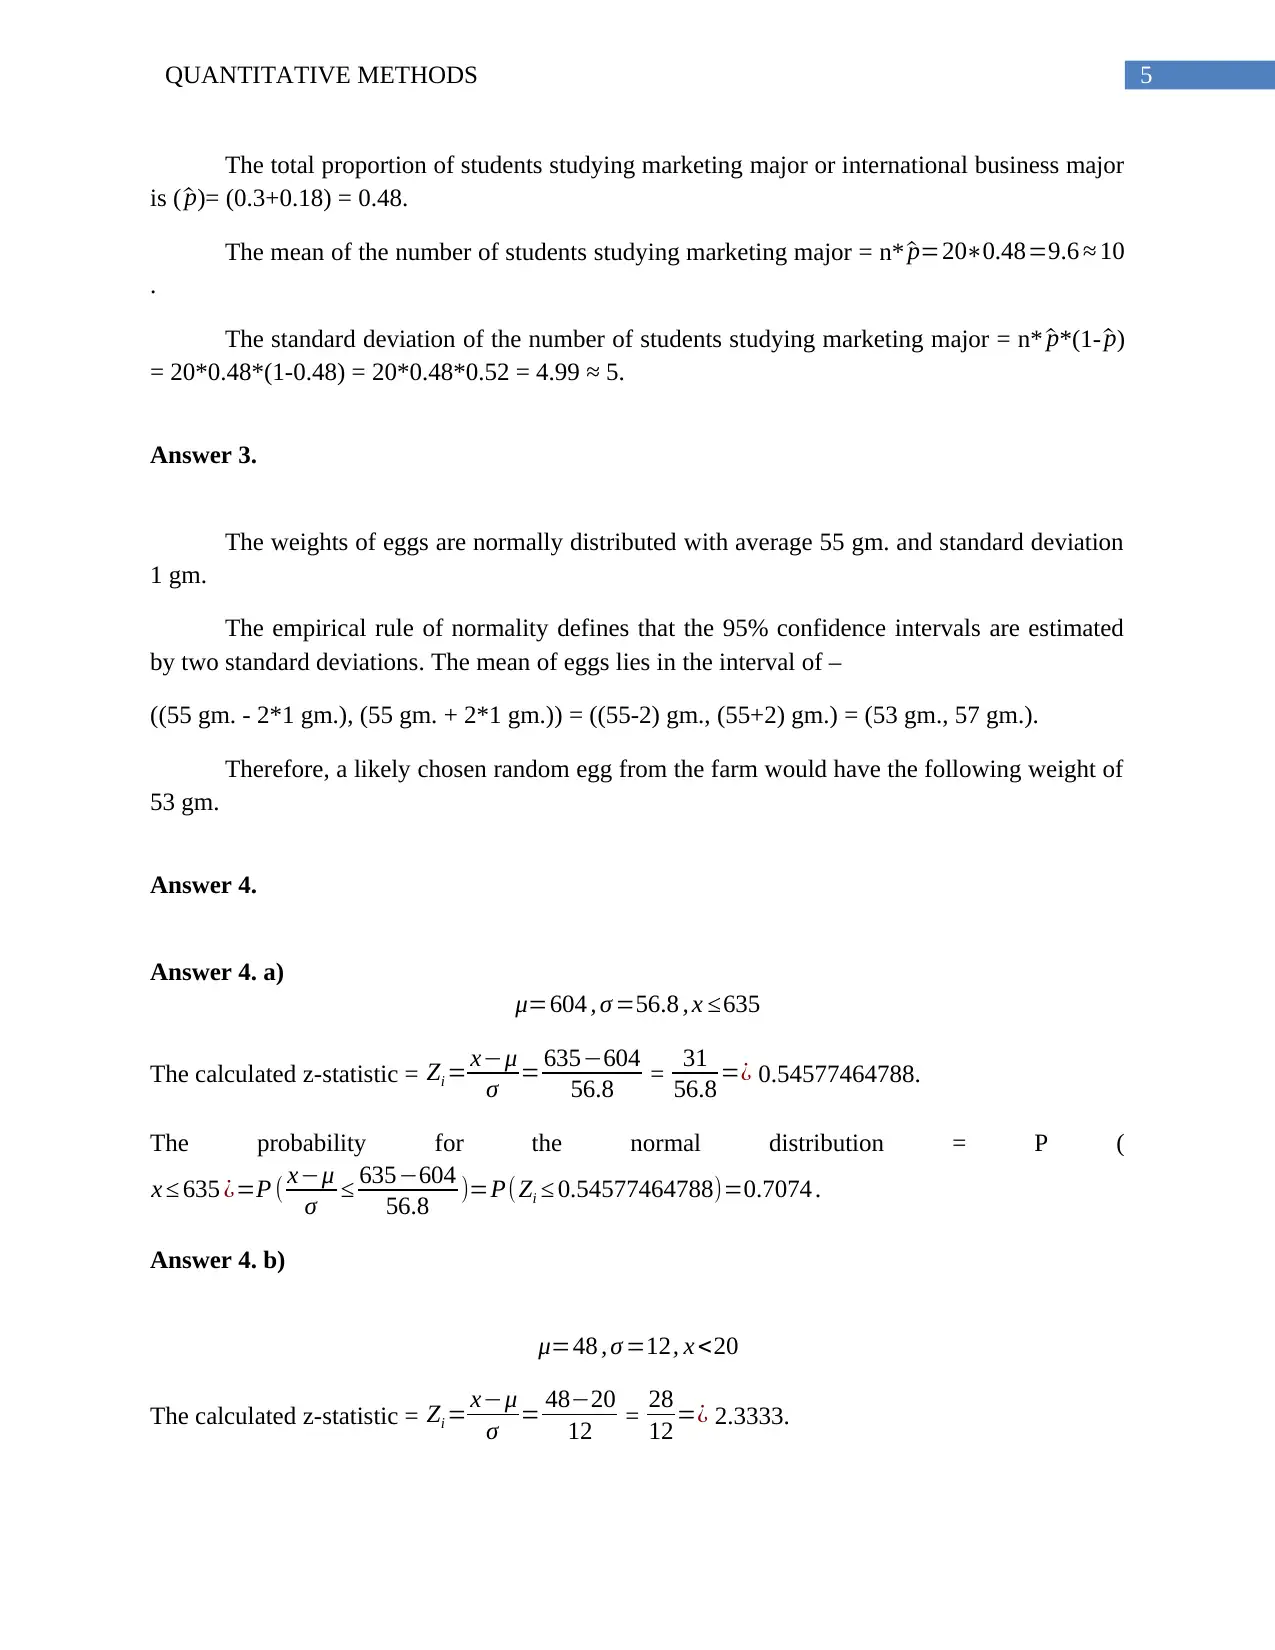
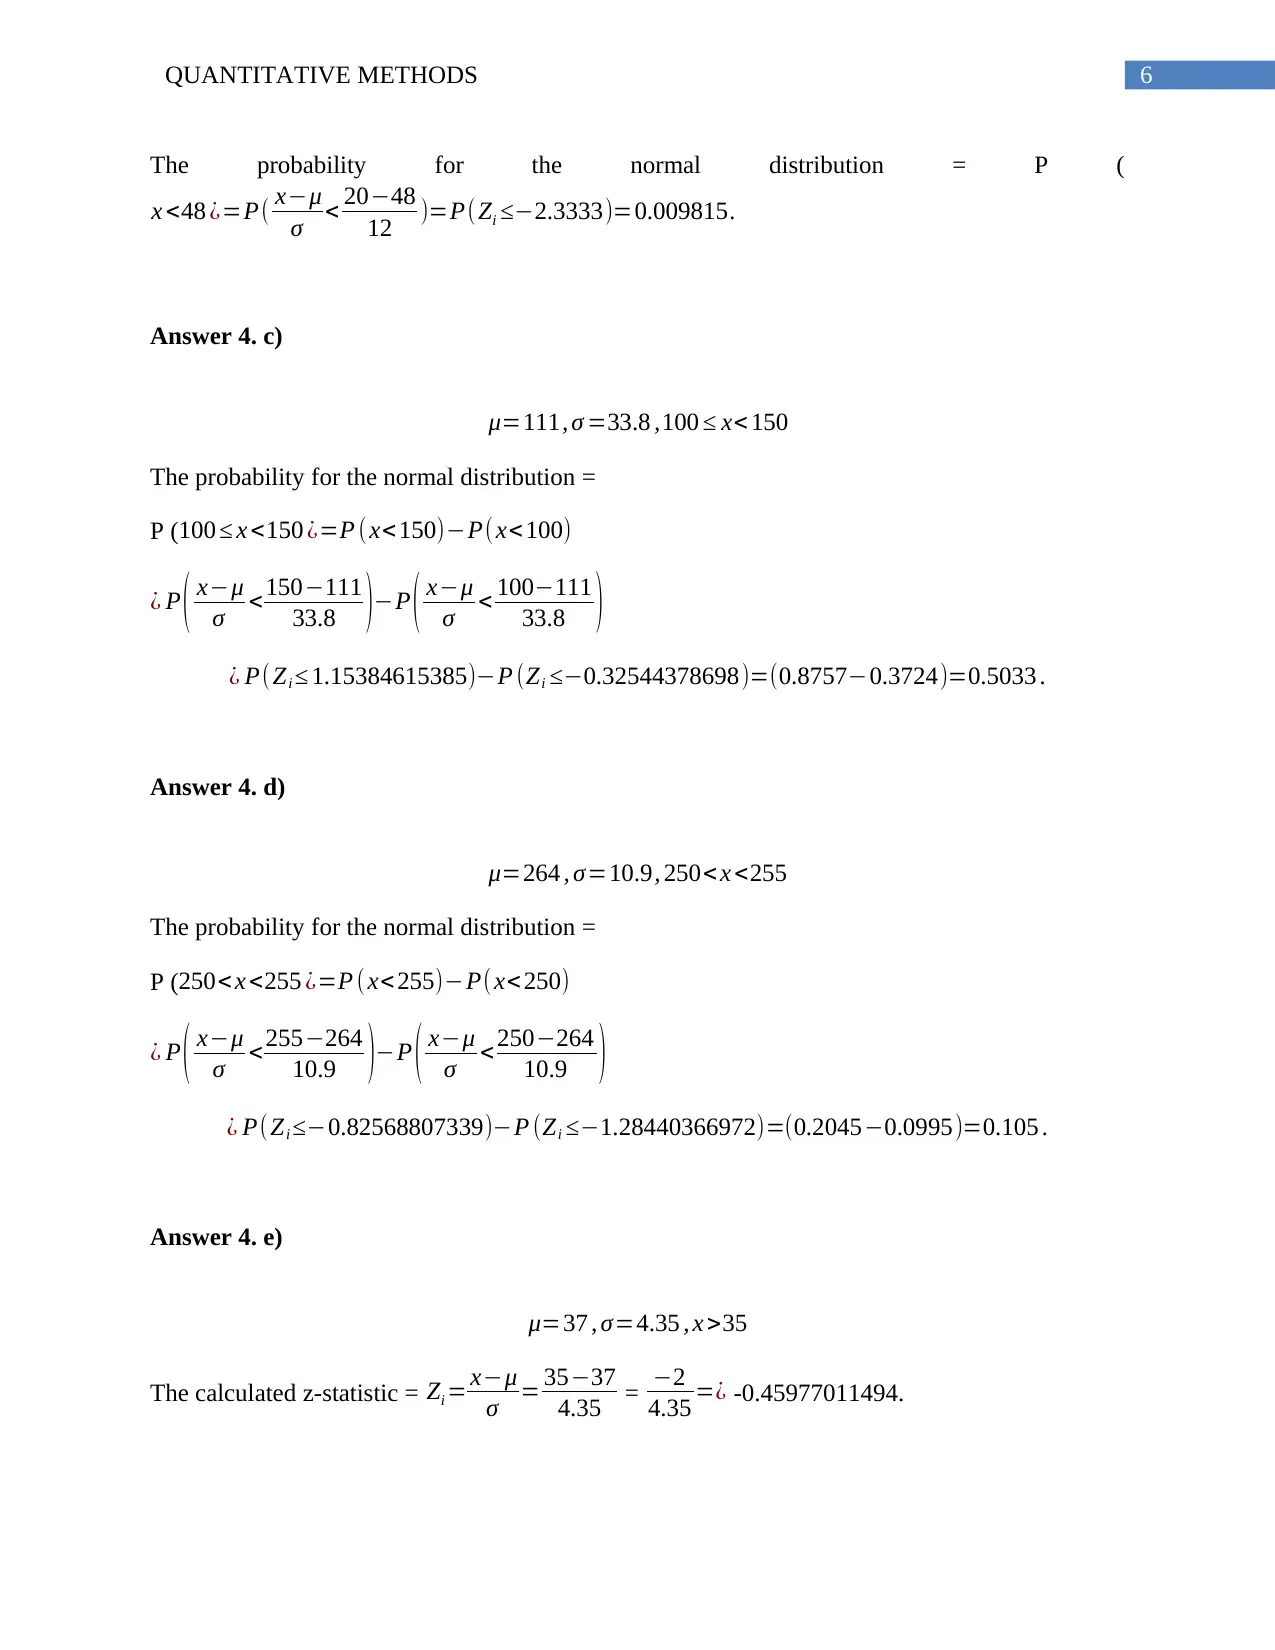
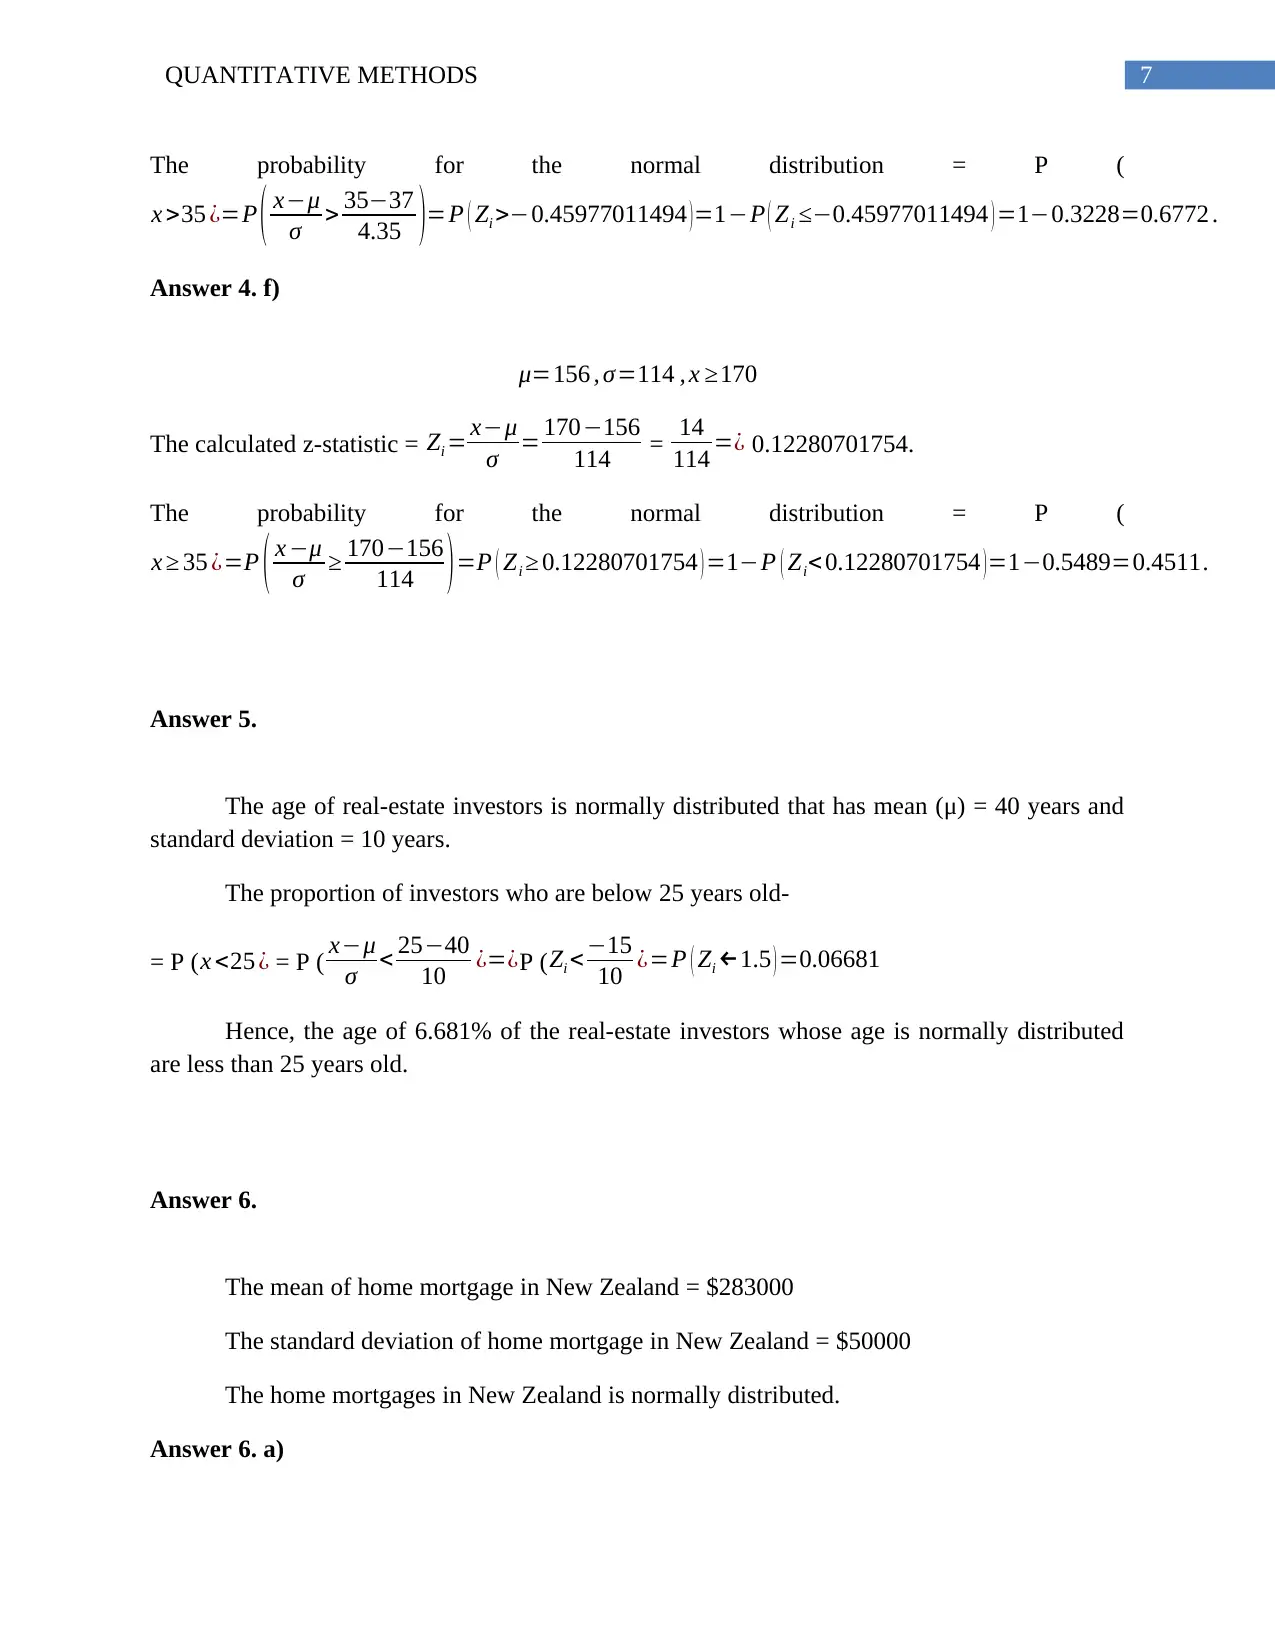
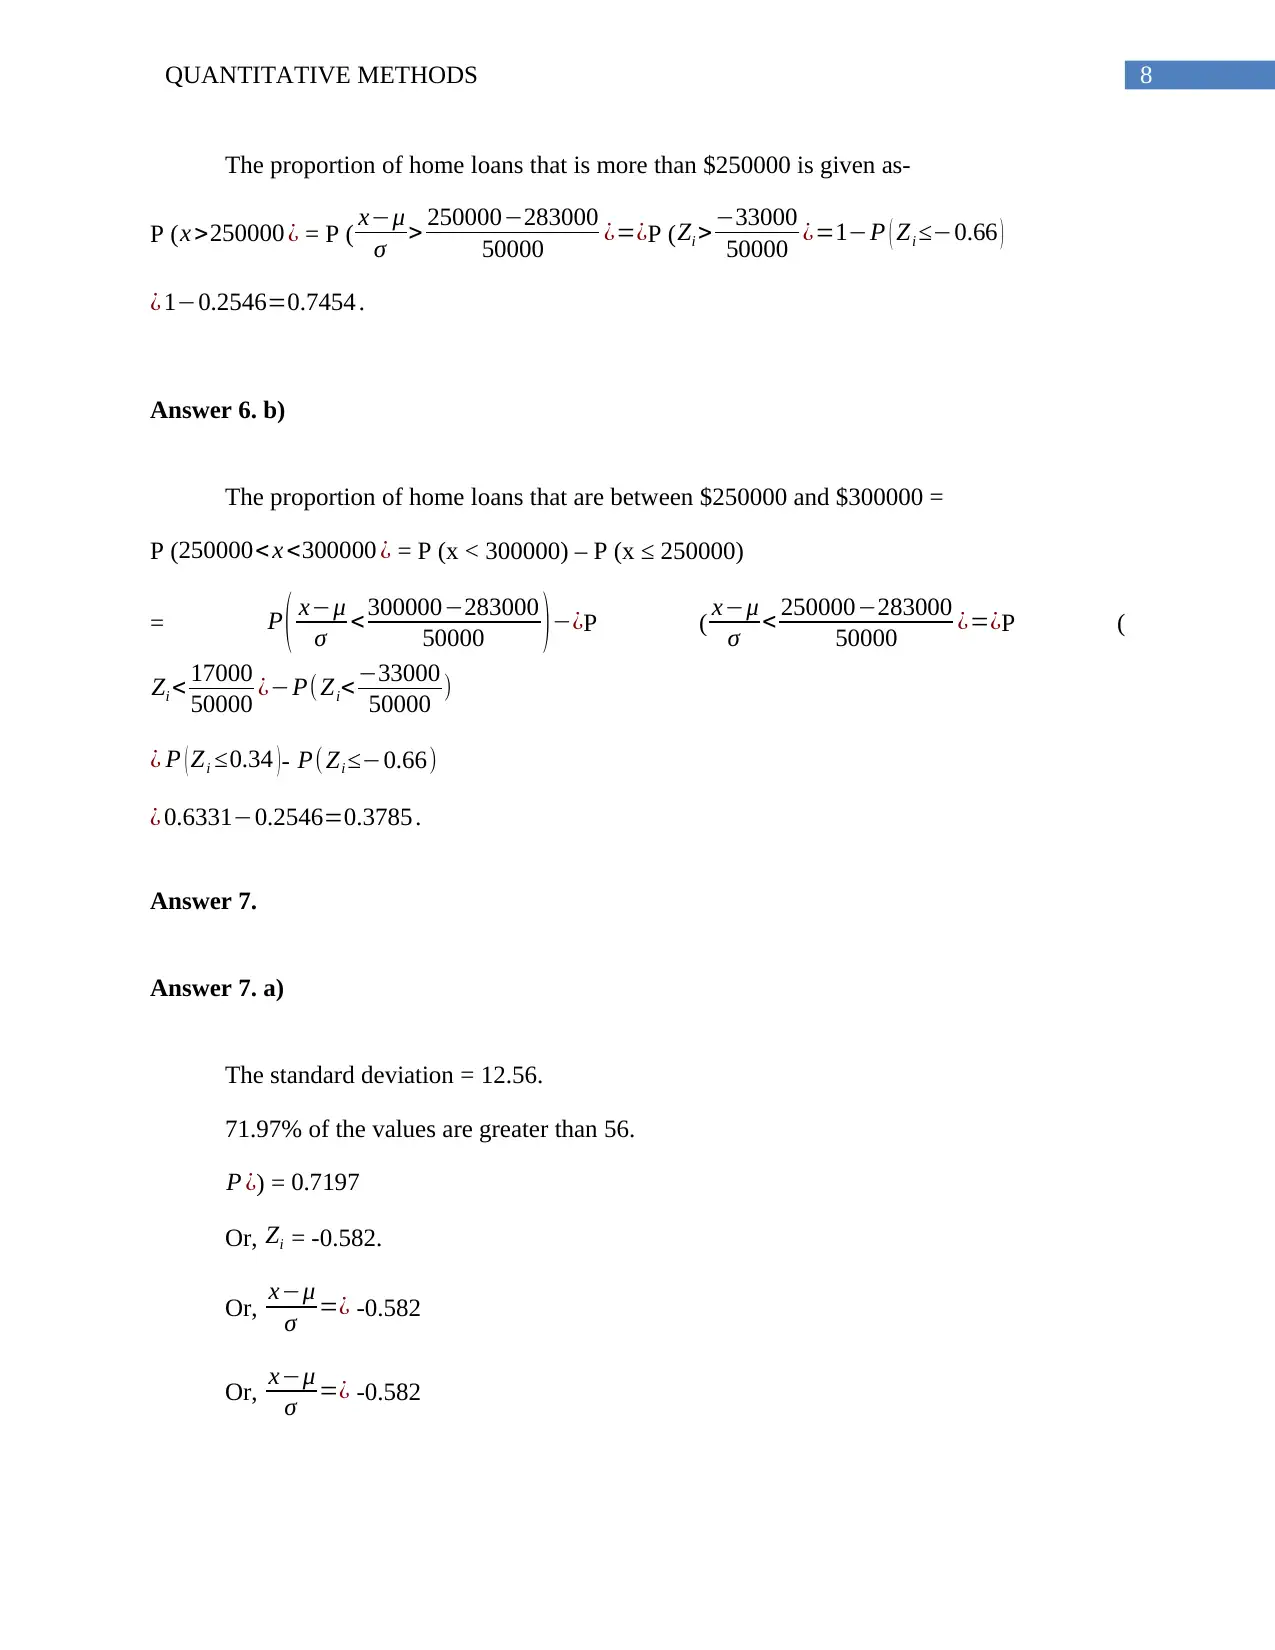
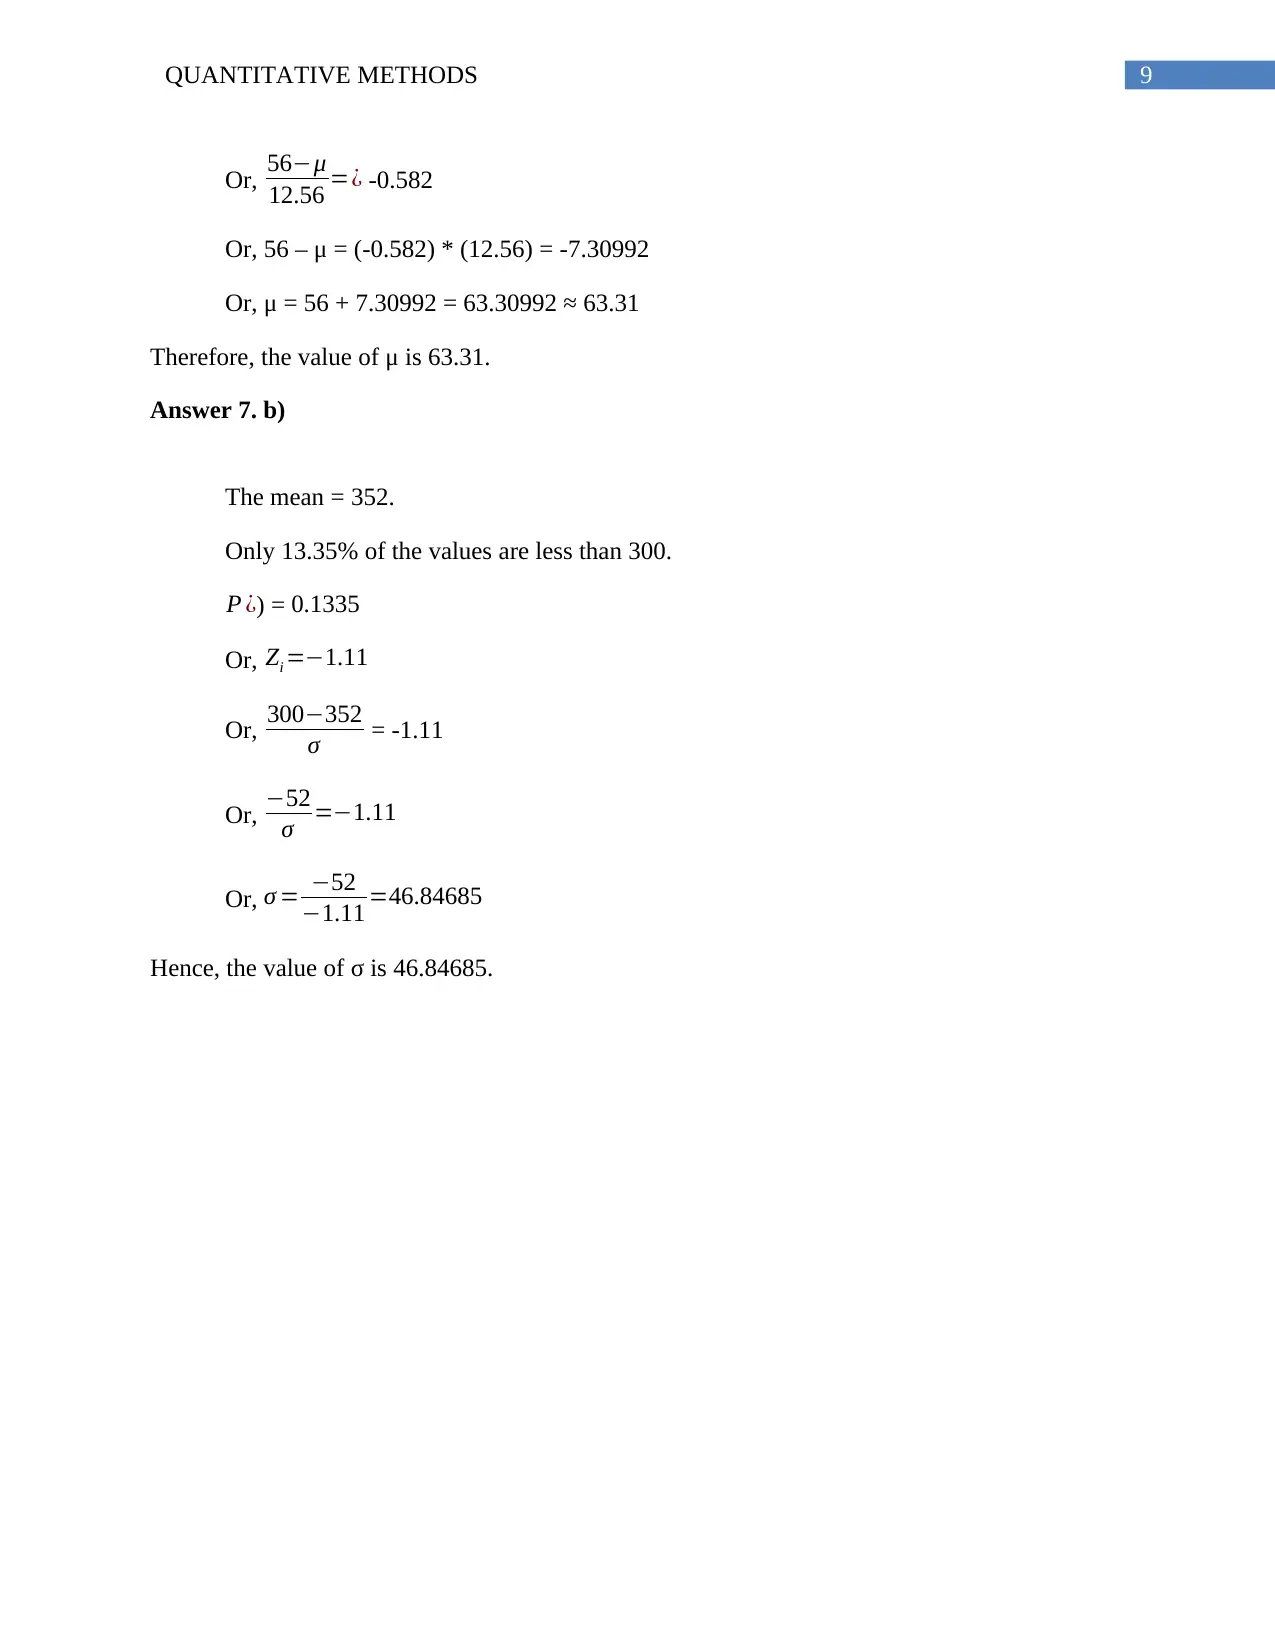
This assignment provides detailed solutions to several problems related to quantitative methods, focusing on binomial and normal probability distributions. It includes calculations for binomial probabilities given different values of n and p, such as finding P(x = 12), P(x > 8), P(x < 12), and P(4 ≤ x ≤ 9). The assignment also covers normal distribution problems, calculating probabilities for various scenarios, including finding the probability of a value being less than, greater than, or between specified limits. Furthermore, it addresses problems related to real-world scenarios such as the proportion of students studying marketing or international business, the weights of eggs, and the distribution of home mortgages in New Zealand, providing a comprehensive overview of how to apply these statistical methods. Desklib is a platform where students can find similar solved assignments and past papers.
Document Page
Running Head: QUANTITATIVE METHODS
Quantitative Methods
Name of the student:
Name of the university:
Course ID:
tabler-icon-diamond-filled.svg

Paraphrase This Document

Need a fresh take? Get an instant paraphrase of this document with our AI Paraphraser
Document Page
QUANTITATIVE METHODS 1
Table of Contents
Answer 1..........................................................................................................................................2
Answer 1. a).................................................................................................................................2
Answer 1. b).................................................................................................................................2
Answer 1. c).................................................................................................................................2
Answer 1. d).................................................................................................................................2
Answer 2..........................................................................................................................................3
Answer 2. a).................................................................................................................................3
Answer 2. a. i)..........................................................................................................................3
Answer 2. a. ii).........................................................................................................................3
Answer 2. a. iii)........................................................................................................................4
Answer 2. b).................................................................................................................................4
Answer 3..........................................................................................................................................4
Answer 4..........................................................................................................................................5
Answer 4. a).................................................................................................................................5
Answer 4. b).................................................................................................................................5
Answer 4. c).................................................................................................................................5
Answer 4. d).................................................................................................................................5
Answer 4. e).................................................................................................................................6
Answer 4. f)..................................................................................................................................6
Answer 5..........................................................................................................................................6
Answer 6..........................................................................................................................................7
Answer 6. a).................................................................................................................................7
Answer 6. b).................................................................................................................................7
Answer 7..........................................................................................................................................7
Answer 7. a).................................................................................................................................7
Answer 7. b).................................................................................................................................8
Document Page
2QUANTITATIVE METHODS
Answer 1.
Answer 1. a)
n=20 , p=0.5 .
P (x = 12) = n!
x ! ( nx ) ! px (1 p)n x
= 20!
12! ( 2012 ) ! (0.5)12 (10.5)2012
= 20 !
12! 8 ! (0.5)12 (0.5)8
= 125970*(0.5)20 = 0.1201.
Answer 1. b)
n=20 , p=0.3 .
P (x > 8) = 1P ( x 8 ) =1
x=0 ( n
x ) px(1 p)nx
= 1
x=0 ( 20
8 ) (0.3)8 (10.3)208
= 1
k=0 (20
8 )(0.3)8
(0.7)12
= 1 – 0.8866 = 0.1133.
Answer 1. c)
n=20 , p=0.7 .
P (x < 12) = P ( x 12 )P ( x=12 )
¿ [
x=0 ( n
x ) px ( 1 p ) nx
]- [ n !
x ! ( nx ) ! px (1 p)nx ]
=
x=0 (20
12 )(0.7)12 (10.7)2012 20!
12! ( 2012 ) ! (0.7)12(10.7)2012
=
k=0 ( 20
12 ) (0.7)12
(0.3)8 20 !
12! 8 ! (0.7)12(0.3)8
= 0.2277 – 0.1143 = 0.1133.
Answer 1. d)
Document Page
3QUANTITATIVE METHODS
n=15 , p=0.4 .
P (4 ≤ x ≤ 12) = P ( x 12 )P ( x< 4 )
P ( x 12 )
¿ [
x=0 ( n
x ) px ( 1 p ) nx
]
=
x=0 ( 15
12 ) (0.4)12 (10.4)1512
=
k=0 (15
12 )(0.4)12
(0.6)3
= 0.9997
P (x < 4) = P ( x 4 ) P ( x=4 )
¿ [
x=0 ( n
x ) px ( 1 p ) nx
]- [ n !
x ! ( nx ) ! px (1 p)nx ]
=
x=0 ( 15
4 ) (0.4)4 (10.4 )154 15!
4 ! ( 154 ) ! (0.4)4 (10.4)154
=
k=0 (15
4 )(0.4)
4
(0.6)11 15 !
4 ! 11 ! (0.4)4 (0.6)11
= 0.2173 – 0.1268 = 0.0905.
P (4 ≤ x ≤ 12) = P ( x 12 )P ( x< 4 )= 0.9997 - 0.0905 = 0.9092.
Answer 2.
30% (p = 0.3) students are enrolled in marketing.
18% (p = 0.18) students are enrolled in international business.
20 students (n=20) are chosen at random.
tabler-icon-diamond-filled.svg

Paraphrase This Document

Need a fresh take? Get an instant paraphrase of this document with our AI Paraphraser
Document Page
4QUANTITATIVE METHODS
Answer 2. a)
Answer 2. a. i)
The probability that at least half of the students (p = 0.5) are studying a marketing major
= P
(Zi 0.30.5
0.5 ( 10.5 )
20 )=P ¿) = P ( Zi 0.2
0.111803 ¿=P( Zi 1.78885)
= (1-0.9632) = 0.0368.
Answer 2. a. ii)
The probability that no more than a quarter of the students (p = 0.75) are studying an
international business major =
P
(Zi 0.180.75
0.75 ( 10.75 )
20 )=P ¿) = P (Zi 0.57
0.096825 ¿=P( Zi 5.88693)
= (1- 1.967*10-9).
Answer 2. a. iii)
The probability that the number of students studying a marketing major is between 10 (p
= 10
20 = 0.5) and 15 (p = 15
20 = 0.75) is given as-
P( 0.30.75
0.75( 10.25 )
20
Zi 0.30.5
0.5( 10.5 )
20
)
= P ( 0.45
0.096825 Zi 0.2
0.1118 ¿=P(4.64758 Zi 1.78885)
= P ( Zi 1.78885 ) P ( Zi 4.64758 ) = (0.03682 - 1.679* 10-6) = 0.036818.
Answer 2. b)
The mean of the number of students studying marketing major = n*p = 20*0.3 = 6.
The standard deviation of the student studying marketing major = n*p*(1-p) = 20*0.3*(1-
0.3) = 20*0.3*0.7 = 4.2 ≈ 4.
Document Page
5QUANTITATIVE METHODS
The total proportion of students studying marketing major or international business major
is ( ^p)= (0.3+0.18) = 0.48.
The mean of the number of students studying marketing major = n* ^p=200.48=9.6 10
.
The standard deviation of the number of students studying marketing major = n* ^p*(1- ^p)
= 20*0.48*(1-0.48) = 20*0.48*0.52 = 4.99 ≈ 5.
Answer 3.
The weights of eggs are normally distributed with average 55 gm. and standard deviation
1 gm.
The empirical rule of normality defines that the 95% confidence intervals are estimated
by two standard deviations. The mean of eggs lies in the interval of –
((55 gm. - 2*1 gm.), (55 gm. + 2*1 gm.)) = ((55-2) gm., (55+2) gm.) = (53 gm., 57 gm.).
Therefore, a likely chosen random egg from the farm would have the following weight of
53 gm.
Answer 4.
Answer 4. a)
μ=604 , σ =56.8 , x 635
The calculated z-statistic = Zi = xμ
σ = 635604
56.8 = 31
56.8 =¿ 0.54577464788.
The probability for the normal distribution = P (
x 635 ¿=P ( xμ
σ 635604
56.8 )=P(Zi 0.54577464788)=0.7074 .
Answer 4. b)
μ=48 , σ =12, x <20
The calculated z-statistic = Zi = xμ
σ = 4820
12 = 28
12 =¿ 2.3333.
Document Page
6QUANTITATIVE METHODS
The probability for the normal distribution = P (
x <48 ¿=P( xμ
σ < 2048
12 )=P(Zi 2.3333)=0.009815.
Answer 4. c)
μ=111, σ =33.8 ,100 x< 150
The probability for the normal distribution =
P (100 x <150 ¿=P (x<150)P(x<100)
¿ P ( xμ
σ <150111
33.8 )P ( xμ
σ < 100111
33.8 )
¿ P(Zi 1.15384615385)P (Zi 0.32544378698)=(0.87570.3724)=0.5033 .
Answer 4. d)
μ=264 , σ=10.9, 250<x <255
The probability for the normal distribution =
P (250< x <255 ¿=P (x< 255)P( x<250)
¿ P ( xμ
σ <255264
10.9 )P ( xμ
σ < 250264
10.9 )
¿ P(Zi 0.82568807339)P (Zi 1.28440366972)=(0.20450.0995)=0.105 .
Answer 4. e)
μ=37 , σ=4.35 , x >35
The calculated z-statistic = Zi = xμ
σ = 3537
4.35 = 2
4.35 =¿ -0.45977011494.
tabler-icon-diamond-filled.svg

Paraphrase This Document

Need a fresh take? Get an instant paraphrase of this document with our AI Paraphraser
Document Page
7QUANTITATIVE METHODS
The probability for the normal distribution = P (
x >35 ¿=P ( xμ
σ > 3537
4.35 )=P ( Zi >0.45977011494 )=1P ( Zi 0.45977011494 ) =10.3228=0.6772 .
Answer 4. f)
μ=156 , σ=114 , x 170
The calculated z-statistic = Zi = xμ
σ = 170156
114 = 14
114 =¿ 0.12280701754.
The probability for the normal distribution = P (
x 35 ¿=P ( x μ
σ 170156
114 )=P ( Zi 0.12280701754 ) =1P ( Zi<0.12280701754 )=10.5489=0.4511.
Answer 5.
The age of real-estate investors is normally distributed that has mean (μ) = 40 years and
standard deviation = 10 years.
The proportion of investors who are below 25 years old-
= P ( x <25 ¿ = P ( xμ
σ < 2540
10 ¿=¿P (Zi < 15
10 ¿=P ( Zi 1.5 ) =0.06681
Hence, the age of 6.681% of the real-estate investors whose age is normally distributed
are less than 25 years old.
Answer 6.
The mean of home mortgage in New Zealand = $283000
The standard deviation of home mortgage in New Zealand = $50000
The home mortgages in New Zealand is normally distributed.
Answer 6. a)
Document Page
8QUANTITATIVE METHODS
The proportion of home loans that is more than $250000 is given as-
P (x >250000 ¿ = P ( xμ
σ > 250000283000
50000 ¿=¿P ( Zi >33000
50000 ¿=1P ( Zi 0.66 )
¿ 10.2546=0.7454 .
Answer 6. b)
The proportion of home loans that are between $250000 and $300000 =
P (250000< x <300000 ¿ = P (x < 300000) – P (x ≤ 250000)
= P ( xμ
σ < 300000283000
50000 )¿P ( xμ
σ < 250000283000
50000 ¿=¿P (
Zi < 17000
50000 ¿P( Zi< 33000
50000 )
¿ P ( Zi 0.34 )- P( Zi 0.66)
¿ 0.63310.2546=0.3785 .
Answer 7.
Answer 7. a)
The standard deviation = 12.56.
71.97% of the values are greater than 56.
P ¿) = 0.7197
Or, Zi = -0.582.
Or, xμ
σ =¿ -0.582
Or, xμ
σ =¿ -0.582
Document Page
9QUANTITATIVE METHODS
Or, 56μ
12.56 =¿ -0.582
Or, 56 – μ = (-0.582) * (12.56) = -7.30992
Or, μ = 56 + 7.30992 = 63.30992 ≈ 63.31
Therefore, the value of μ is 63.31.
Answer 7. b)
The mean = 352.
Only 13.35% of the values are less than 300.
P ¿) = 0.1335
Or, Zi =1.11
Or, 300352
σ = -1.11
Or, 52
σ =1.11
Or, σ = 52
1.11 =46.84685
Hence, the value of σ is 46.84685.
chevron_up_icon
1 out of 10
circle_padding
hide_on_mobile
zoom_out_icon
[object Object]