Health Data Analysis: Glucose Levels and Associated Factors
VerifiedAdded on 2023/06/11
|21
|3839
|459
Homework Assignment
AI Summary
This assignment provides a comprehensive statistical analysis of health data collected from 3950 individuals. The analysis includes descriptive statistics of baseline characteristics such as sex, education level, age, serum total cholesterol, systolic and diastolic blood pressure, smoking habits, BMI, antihypertensive medication use, and casual serum glucose. The study characterizes individuals with casual serum glucose levels above 200 mg/dL and compares them to those with levels at or below 200 mg/dL, considering factors like age, BMI, education, and blood pressure medication use. Multivariable analysis is conducted to identify variables significantly associated with casual serum glucose levels, focusing on individuals with levels below 200 mg/dL and determining the 'minimum model' for predicting glucose levels. Finally, the assignment examines whether casual serum glucose levels changed significantly between baseline and follow-up examinations, both categorically (above or below 200 mg/dL) and continuously, utilizing paired t-tests to assess the statistical significance of these changes.
1. Describe the characteristics of the people included in the sample at the baseline
examination.
At the baseline examination, data from 3950 people were collected in terms of sex, education
level, age, Serum total cholesterol, Systolic blood pressure, Diastolic blood pressure, Current
cigarette smoking, Number of cigarettes smoked each day, Body mass index, use of anti-
hypertensive medication, Casual serum glucose. Out of 3950, 1725 are male and 2225 are
female. 41.1 % people are education level 0-11 years where as 28.6% are diploma holder. 49.1
% people are currently smoker at baseline examination whereas 50.1% are not currently smoker.
Only 3.1% people use anti hyper tension mediation. At baseline examination, mean serum total
cholesterol is 237.41mmg/dL with standard deviation 44.779. Mean age of people at baseline
examination is 49.95 years with standard deviation 8.644 years. Mean systolic blood pressure is
132.838 mmHg with standard deviation 22.3993. Mean systolic blood pressure is 83.047 mm/Hg
with standard deviation 12.0522. People averagely smoke 8.87 cigarettes every day with
standard deviation 11.844. At baseline examination people have average BMI 25.8523 Kg/m2
with standard deviation 4.07827. Mean casual serum glucose is observed as 82.18 mmg/dL with
standard deviation 24.485.
2. Characterize the people who had casual serum glucose >200 mg/dL at the baseline
examination and compare them to people who had ≤200 mg/dL casual serum glucose at the
baseline examination in terms of age, body mass index (BMI), education and whether they
were taking blood pressure medication at the time of the baseline examination.
We group the variable in two categories:
1: casual serum glucose >200 mg/dL at the baseline examination
2 : casual serum glucose ≤ 200 mg/dL at the baseline examination
Paraphrase This Document
Need a fresh take? Get an instant paraphrase of this document with our AI Paraphraser
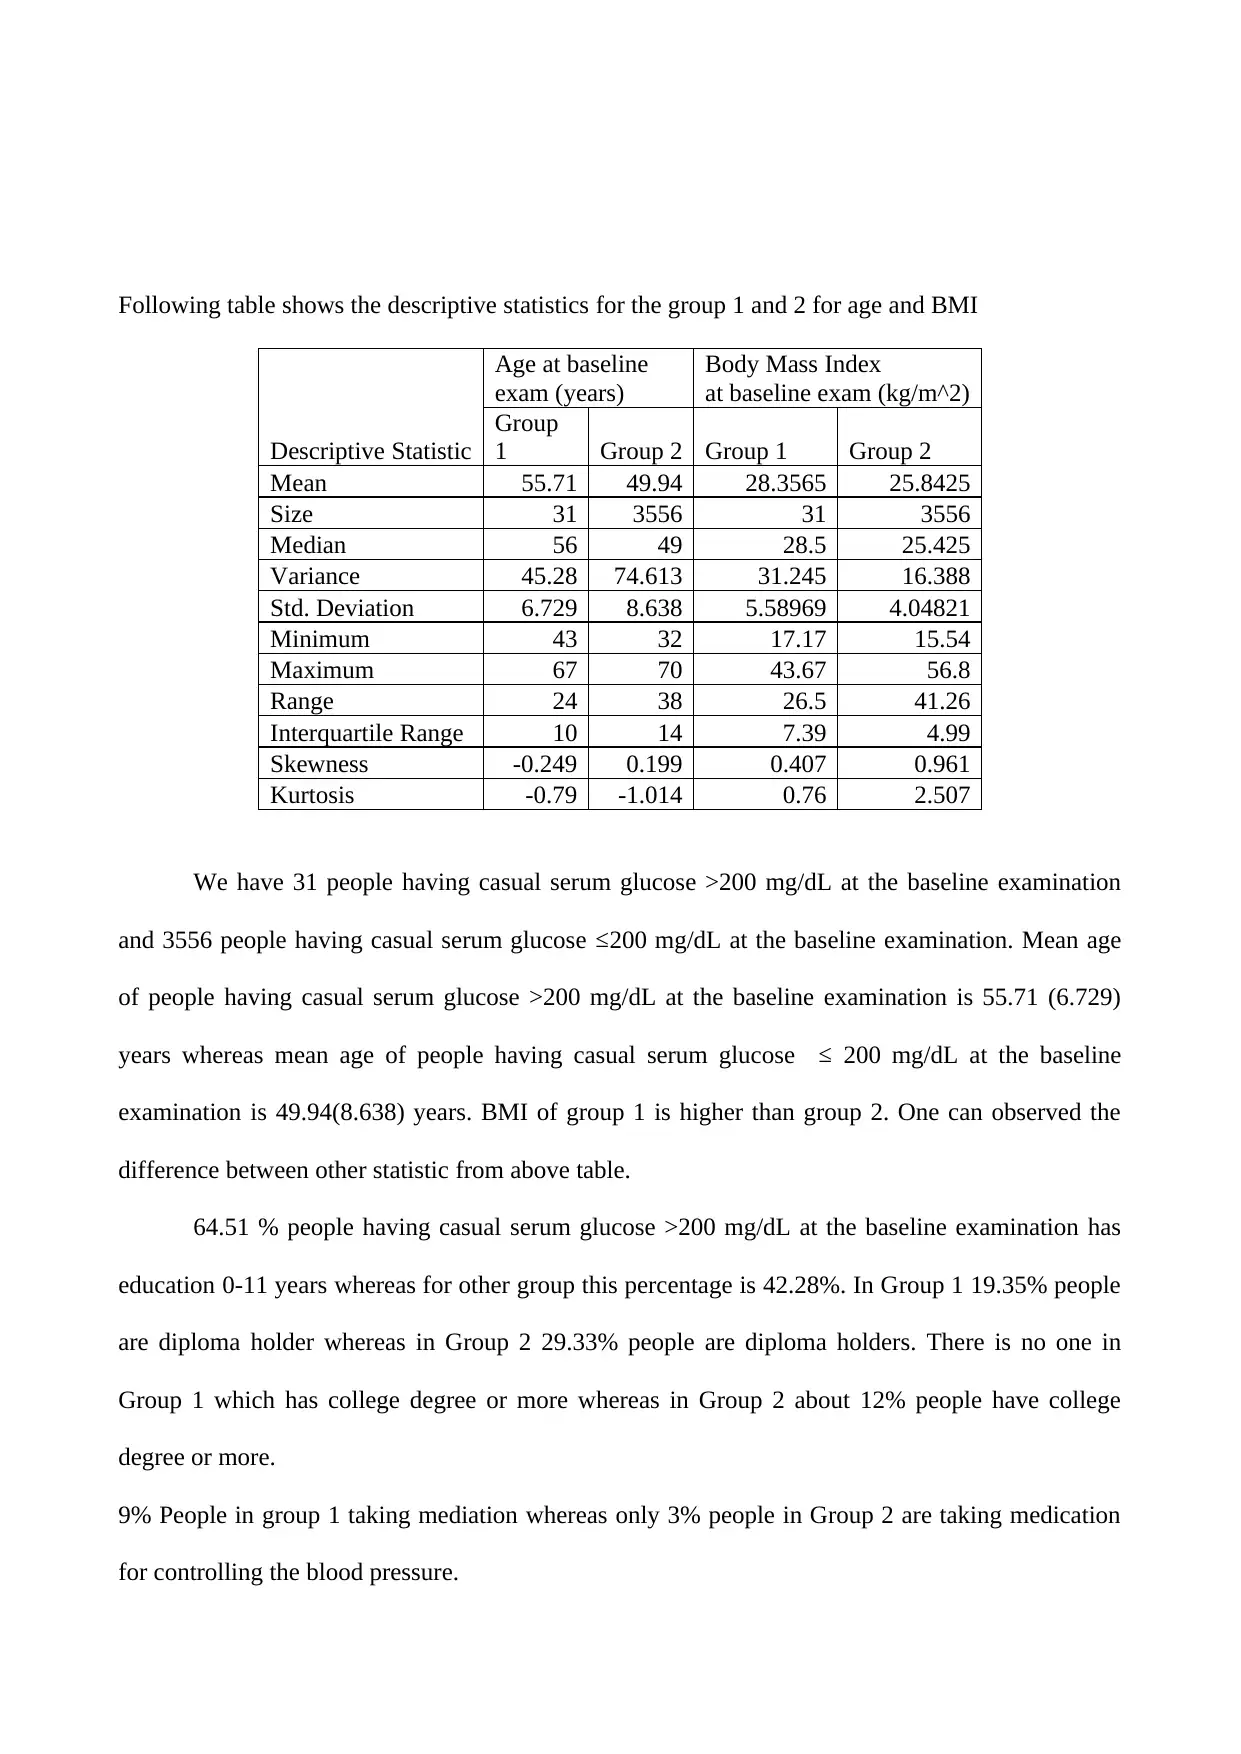
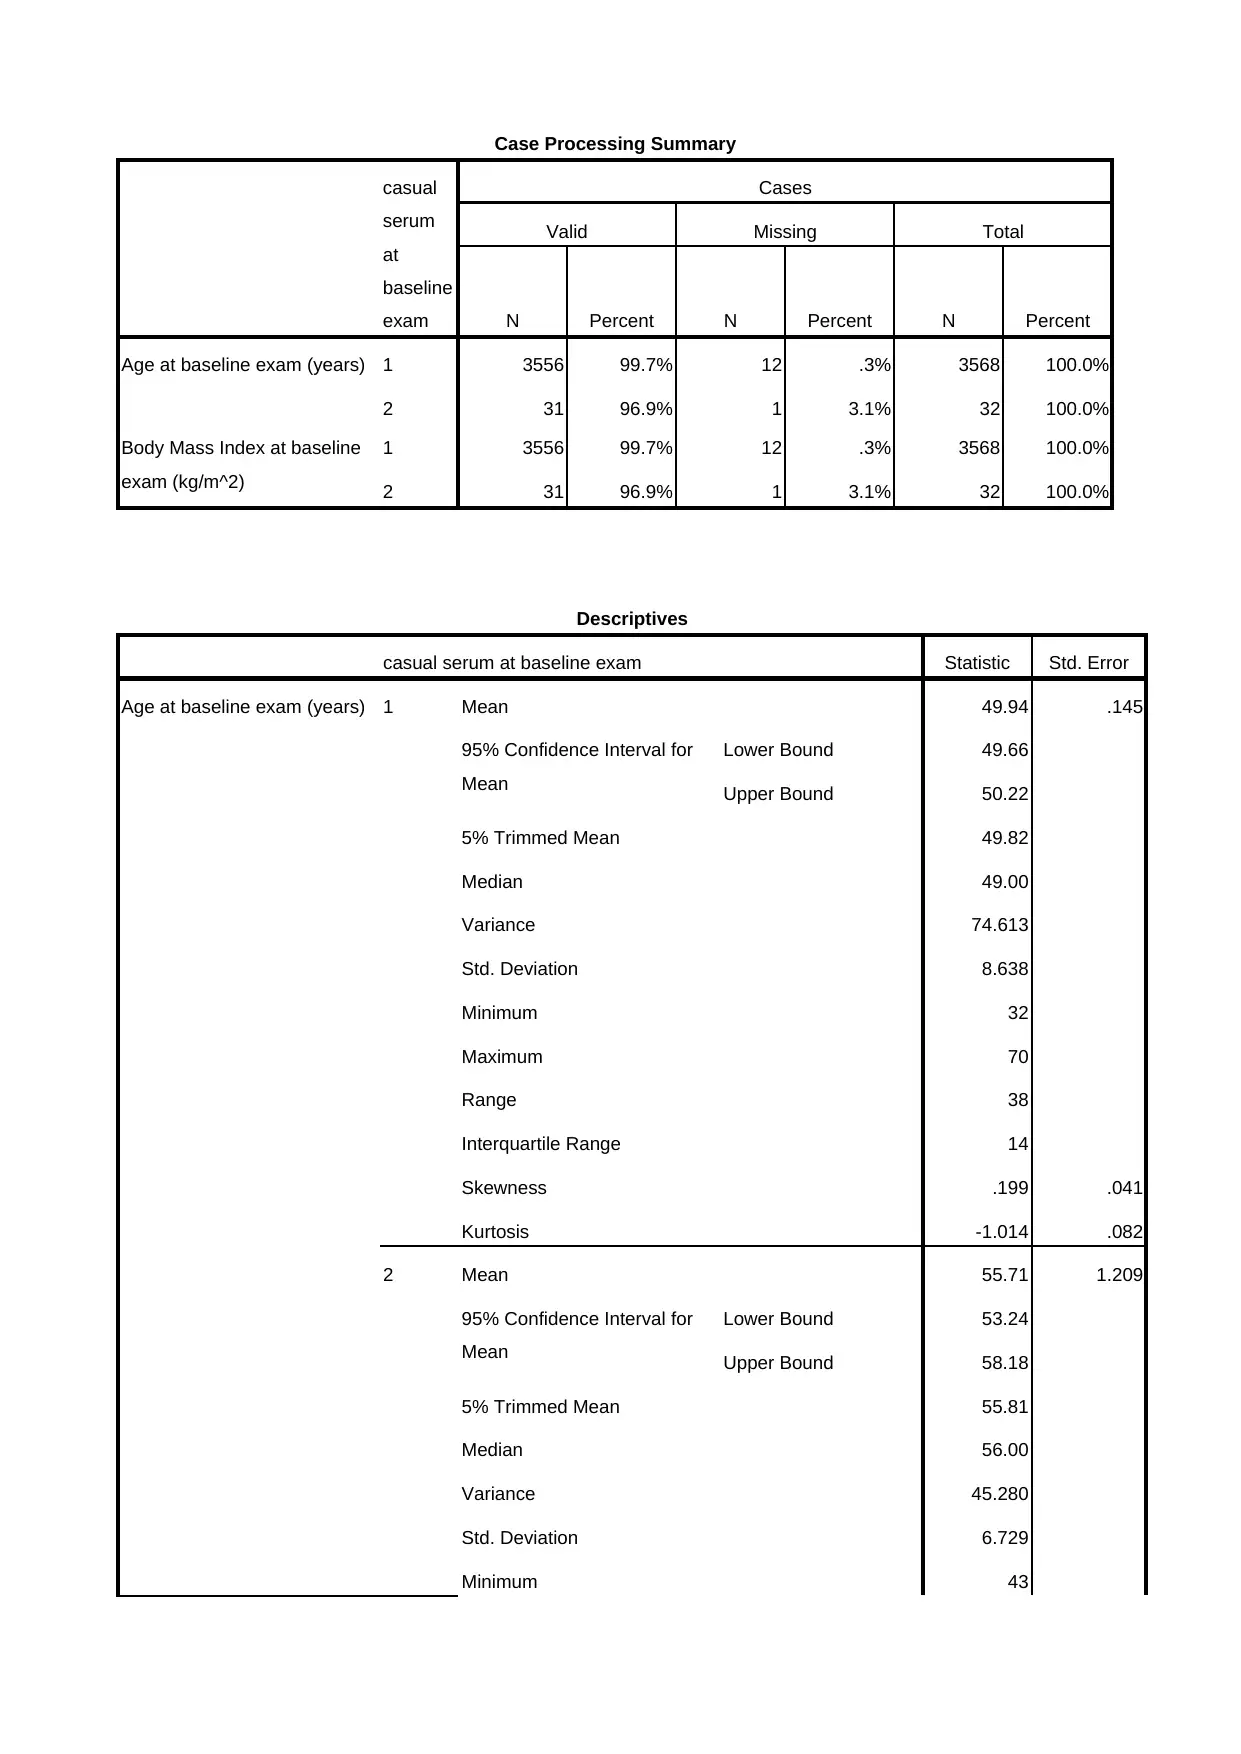
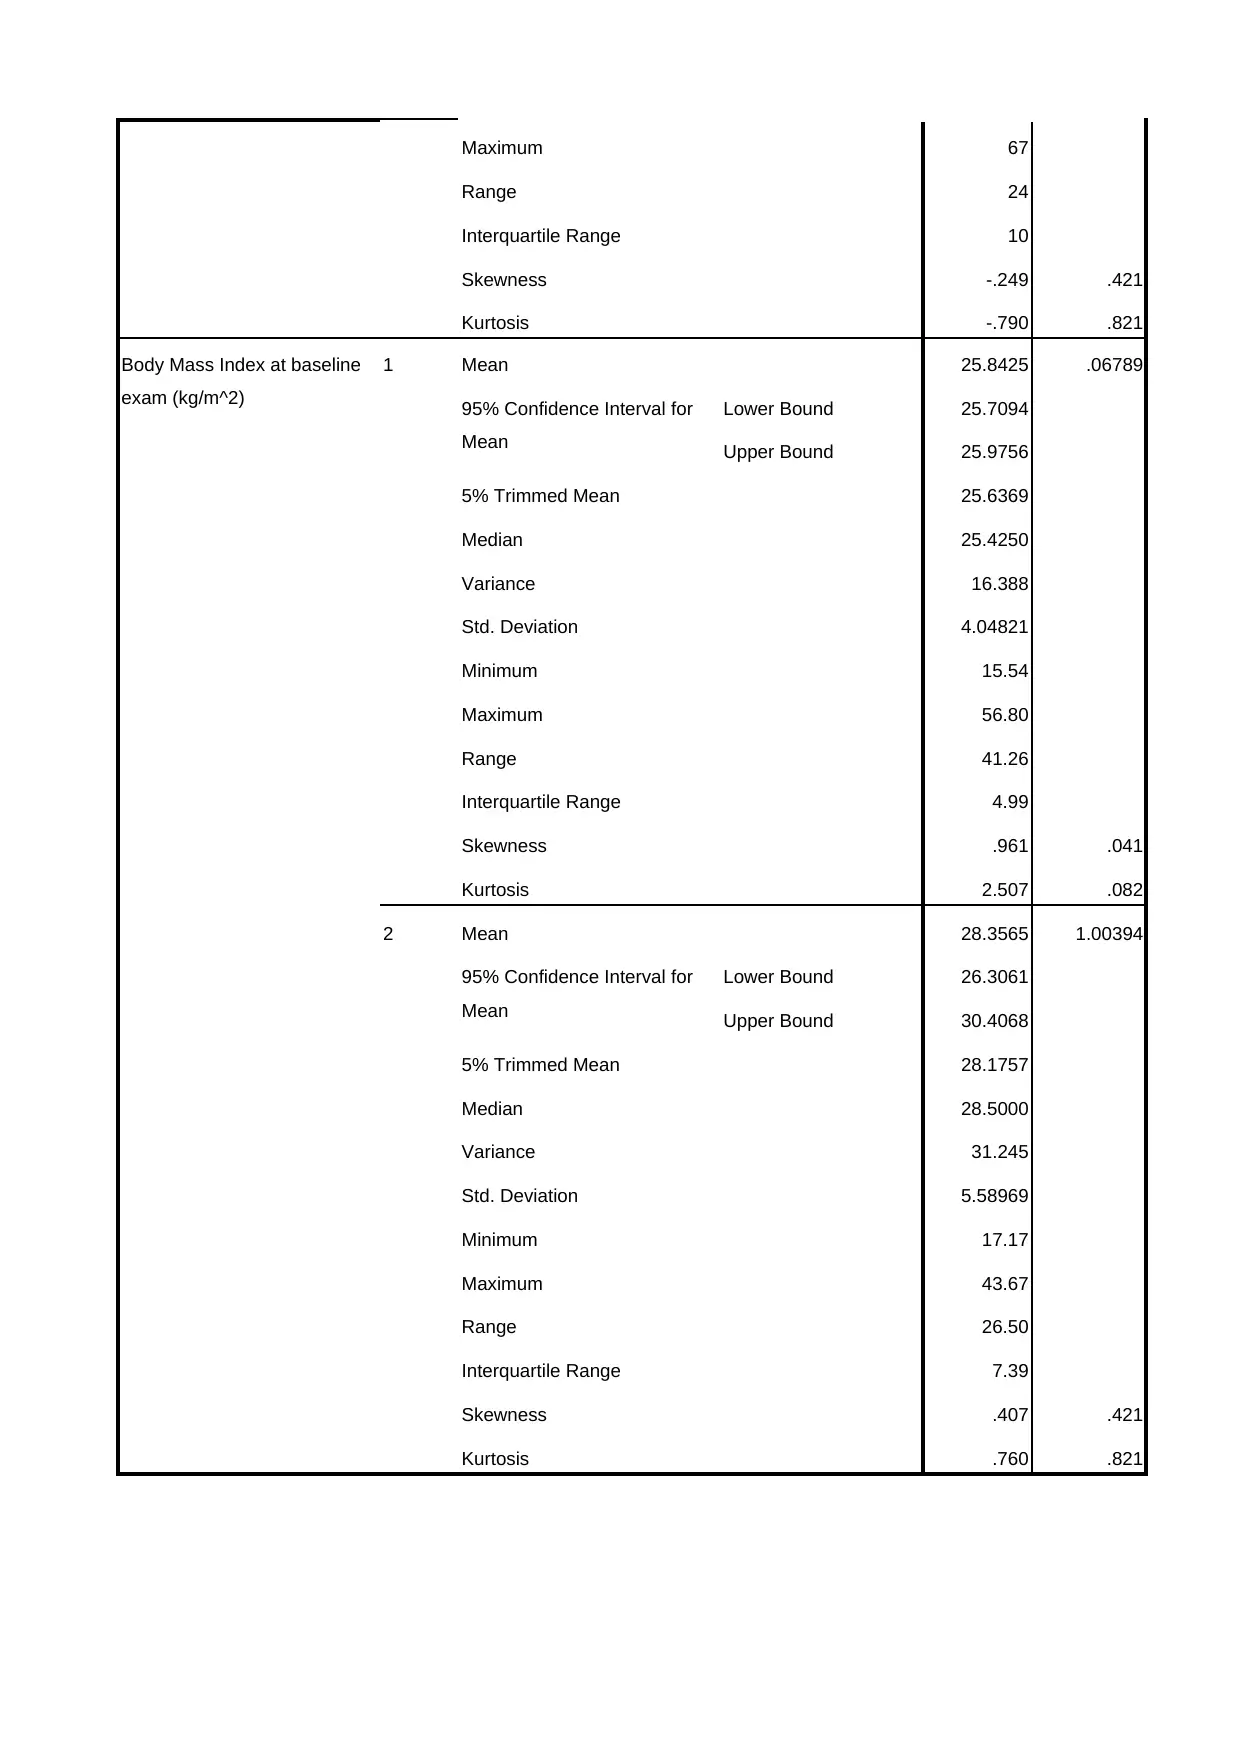
Following table shows the descriptive statistics for the group 1 and 2 for age and BMI
Descriptive Statistic
Age at baseline
exam (years)
Body Mass Index
at baseline exam (kg/m^2)
Group
1 Group 2 Group 1 Group 2
Mean 55.71 49.94 28.3565 25.8425
Size 31 3556 31 3556
Median 56 49 28.5 25.425
Variance 45.28 74.613 31.245 16.388
Std. Deviation 6.729 8.638 5.58969 4.04821
Minimum 43 32 17.17 15.54
Maximum 67 70 43.67 56.8
Range 24 38 26.5 41.26
Interquartile Range 10 14 7.39 4.99
Skewness -0.249 0.199 0.407 0.961
Kurtosis -0.79 -1.014 0.76 2.507
We have 31 people having casual serum glucose >200 mg/dL at the baseline examination
and 3556 people having casual serum glucose ≤200 mg/dL at the baseline examination. Mean age
of people having casual serum glucose >200 mg/dL at the baseline examination is 55.71 (6.729)
years whereas mean age of people having casual serum glucose ≤ 200 mg/dL at the baseline
examination is 49.94(8.638) years. BMI of group 1 is higher than group 2. One can observed the
difference between other statistic from above table.
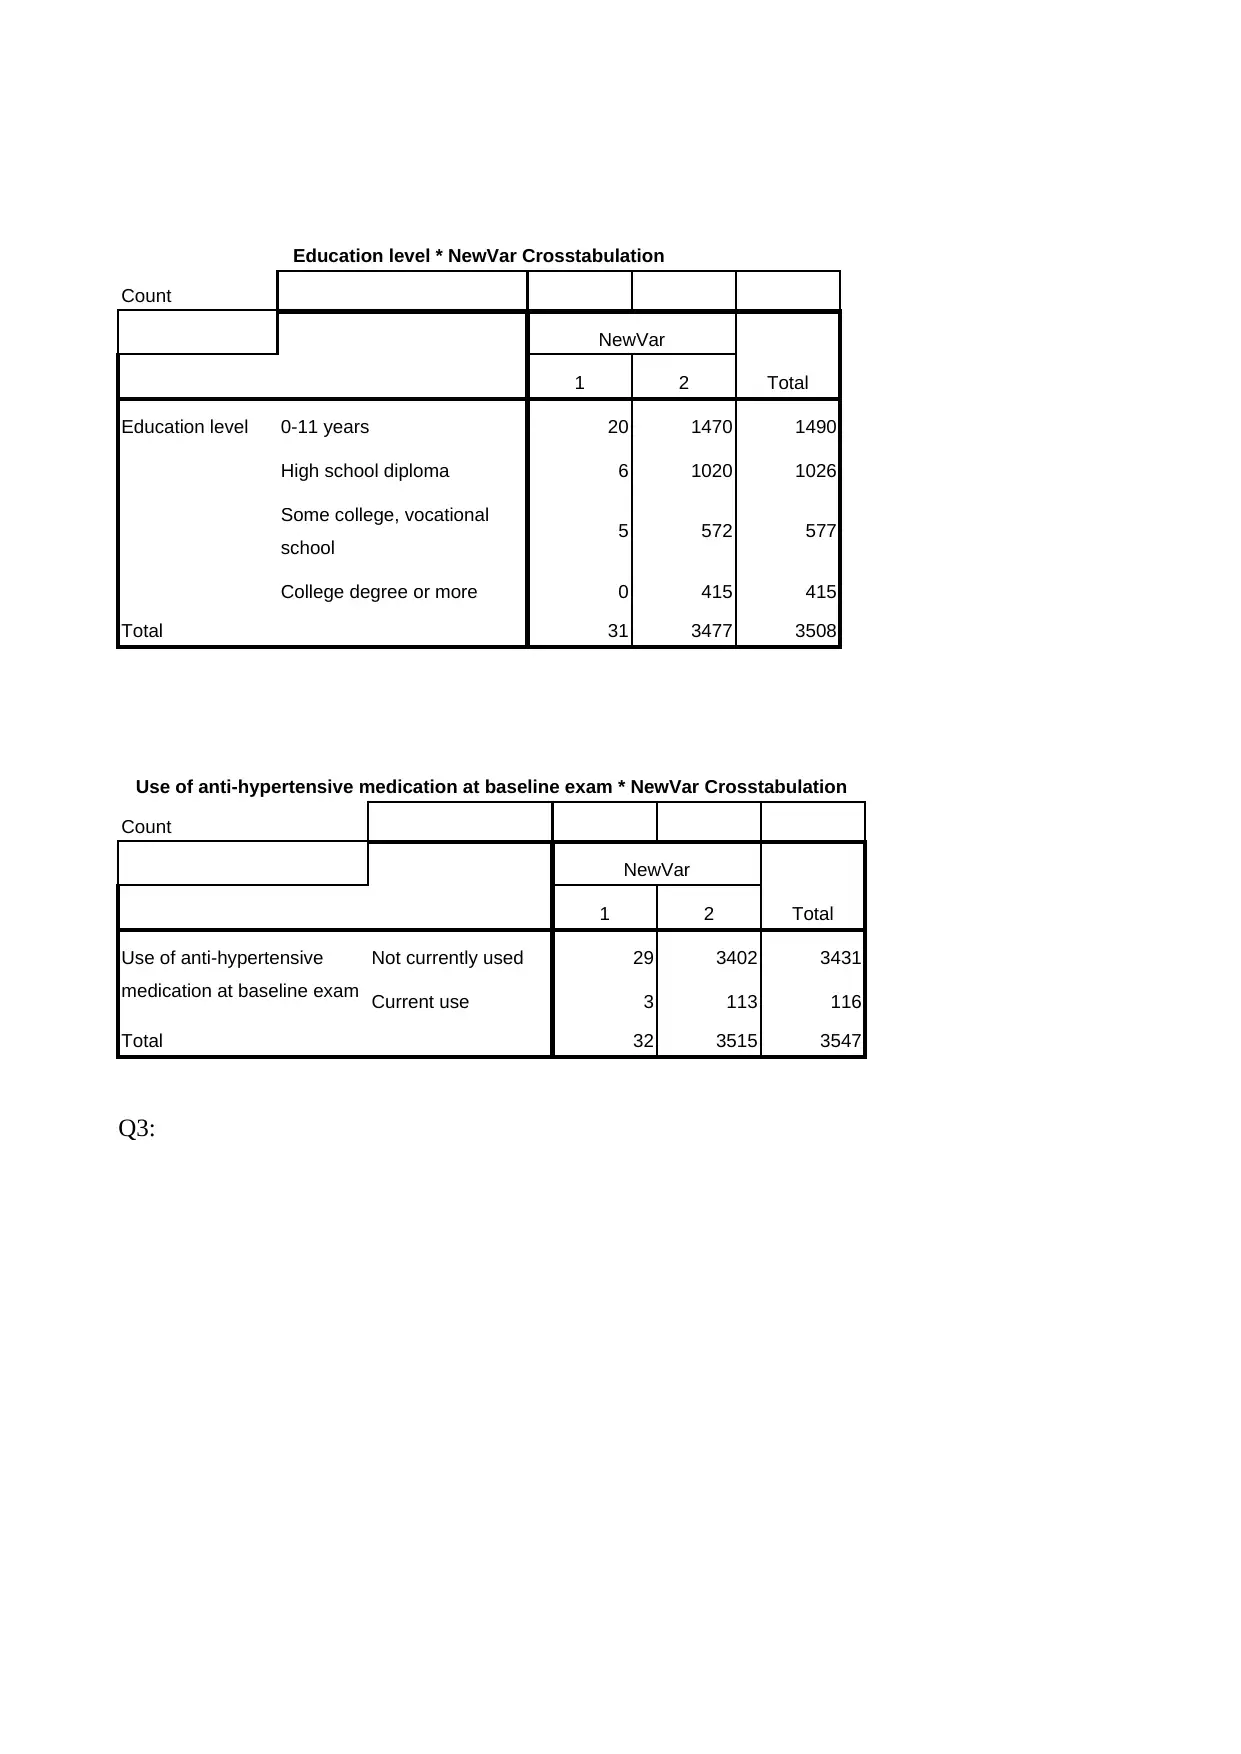
64.51 % people having casual serum glucose >200 mg/dL at the baseline examination has
education 0-11 years whereas for other group this percentage is 42.28%. In Group 1 19.35% people
are diploma holder whereas in Group 2 29.33% people are diploma holders. There is no one in
Group 1 which has college degree or more whereas in Group 2 about 12% people have college
degree or more.
9% People in group 1 taking mediation whereas only 3% people in Group 2 are taking medication
for controlling the blood pressure.
Descriptive Statistic
Age at baseline
exam (years)
Body Mass Index
at baseline exam (kg/m^2)
Group
1 Group 2 Group 1 Group 2
Mean 55.71 49.94 28.3565 25.8425
Size 31 3556 31 3556
Median 56 49 28.5 25.425
Variance 45.28 74.613 31.245 16.388
Std. Deviation 6.729 8.638 5.58969 4.04821
Minimum 43 32 17.17 15.54
Maximum 67 70 43.67 56.8
Range 24 38 26.5 41.26
Interquartile Range 10 14 7.39 4.99
Skewness -0.249 0.199 0.407 0.961
Kurtosis -0.79 -1.014 0.76 2.507
We have 31 people having casual serum glucose >200 mg/dL at the baseline examination
and 3556 people having casual serum glucose ≤200 mg/dL at the baseline examination. Mean age
of people having casual serum glucose >200 mg/dL at the baseline examination is 55.71 (6.729)
years whereas mean age of people having casual serum glucose ≤ 200 mg/dL at the baseline
examination is 49.94(8.638) years. BMI of group 1 is higher than group 2. One can observed the
difference between other statistic from above table.
64.51 % people having casual serum glucose >200 mg/dL at the baseline examination has
education 0-11 years whereas for other group this percentage is 42.28%. In Group 1 19.35% people
are diploma holder whereas in Group 2 29.33% people are diploma holders. There is no one in
Group 1 which has college degree or more whereas in Group 2 about 12% people have college
degree or more.
9% People in group 1 taking mediation whereas only 3% people in Group 2 are taking medication
for controlling the blood pressure.
3. Are the results from the bivariate comparisons above (point 2) different if the actual casual
serum glucose level at baseline examination is analysed, rather than the dichotomized
glucose variable?
No, the results from the bivariate comparisons above (point 2) different if the actual casual
serum glucose level at baseline examination is analysed, rather than the dichotomized glucose
variable.
4. Considering only individuals with casual serum glucose level at baseline below 200 mg/dL,
which of these variables (age, BMI, education and whether they were taking blood pressure
medication) are significantly associated with casual serum glucose level at baseline in a
multivariable analysis? Describe their relationship with casual serum glucose level,
including which variables explain the most variation in casual serum glucose level. Report
the ‘minimum model’ obtained. Explain any differences you observe between the results of
the bivariate analysis in point 3 above and multivariable analysis.
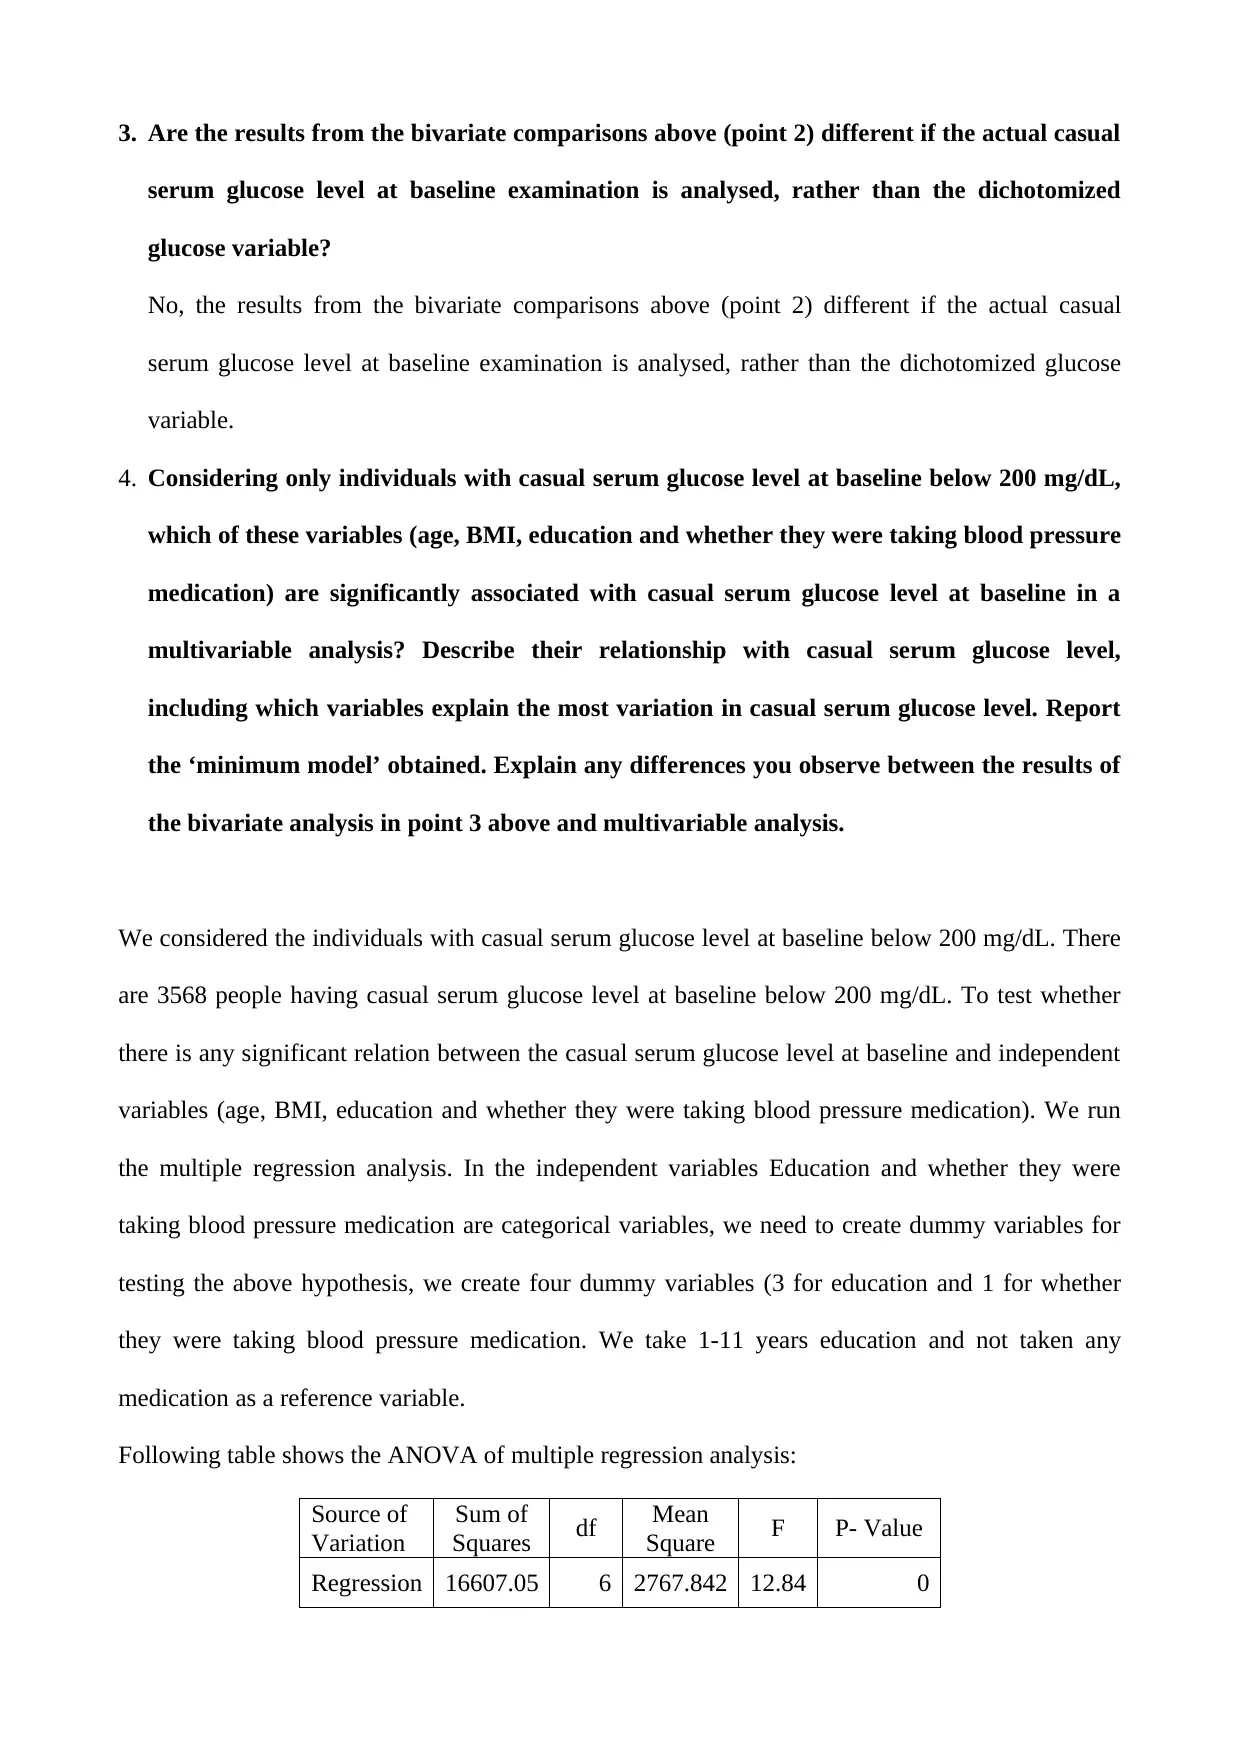
We considered the individuals with casual serum glucose level at baseline below 200 mg/dL. There
are 3568 people having casual serum glucose level at baseline below 200 mg/dL. To test whether
there is any significant relation between the casual serum glucose level at baseline and independent
variables (age, BMI, education and whether they were taking blood pressure medication). We run
the multiple regression analysis. In the independent variables Education and whether they were
taking blood pressure medication are categorical variables, we need to create dummy variables for
testing the above hypothesis, we create four dummy variables (3 for education and 1 for whether
they were taking blood pressure medication. We take 1-11 years education and not taken any
medication as a reference variable.
Following table shows the ANOVA of multiple regression analysis:
Source of
Variation
Sum of
Squares df Mean
Square F P- Value
Regression 16607.05 6 2767.842 12.84 0
serum glucose level at baseline examination is analysed, rather than the dichotomized
glucose variable?
No, the results from the bivariate comparisons above (point 2) different if the actual casual
serum glucose level at baseline examination is analysed, rather than the dichotomized glucose
variable.
4. Considering only individuals with casual serum glucose level at baseline below 200 mg/dL,
which of these variables (age, BMI, education and whether they were taking blood pressure
medication) are significantly associated with casual serum glucose level at baseline in a
multivariable analysis? Describe their relationship with casual serum glucose level,
including which variables explain the most variation in casual serum glucose level. Report
the ‘minimum model’ obtained. Explain any differences you observe between the results of
the bivariate analysis in point 3 above and multivariable analysis.
We considered the individuals with casual serum glucose level at baseline below 200 mg/dL. There
are 3568 people having casual serum glucose level at baseline below 200 mg/dL. To test whether
there is any significant relation between the casual serum glucose level at baseline and independent
variables (age, BMI, education and whether they were taking blood pressure medication). We run
the multiple regression analysis. In the independent variables Education and whether they were
taking blood pressure medication are categorical variables, we need to create dummy variables for
testing the above hypothesis, we create four dummy variables (3 for education and 1 for whether
they were taking blood pressure medication. We take 1-11 years education and not taken any
medication as a reference variable.
Following table shows the ANOVA of multiple regression analysis:
Source of
Variation
Sum of
Squares df Mean
Square F P- Value
Regression 16607.05 6 2767.842 12.84 0
⊘ This is a preview!⊘
Do you want full access?
Subscribe today to unlock all pages.
Trusted by 1+ million students worldwide
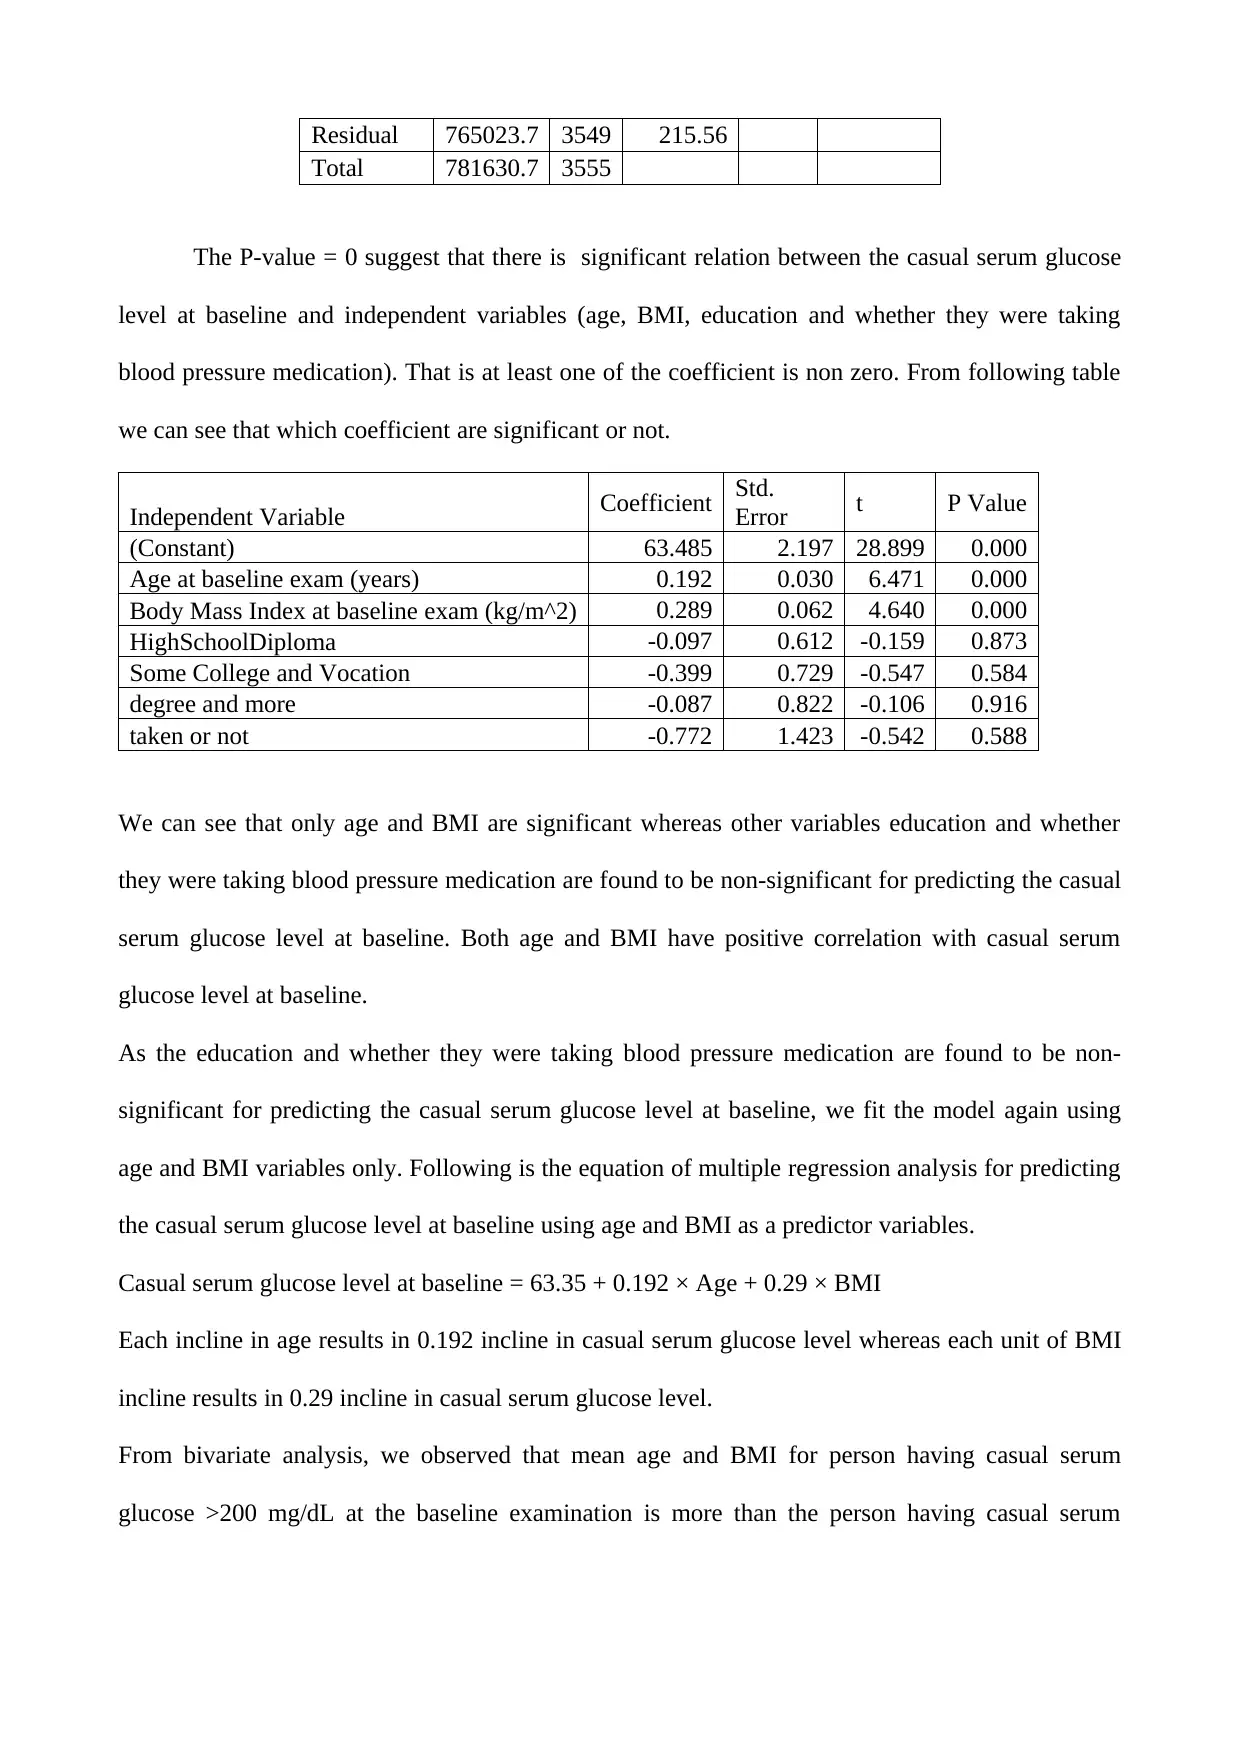
Residual 765023.7 3549 215.56
Total 781630.7 3555
The P-value = 0 suggest that there is significant relation between the casual serum glucose
level at baseline and independent variables (age, BMI, education and whether they were taking
blood pressure medication). That is at least one of the coefficient is non zero. From following table
we can see that which coefficient are significant or not.
Independent Variable Coefficient Std.
Error t P Value
(Constant) 63.485 2.197 28.899 0.000
Age at baseline exam (years) 0.192 0.030 6.471 0.000
Body Mass Index at baseline exam (kg/m^2) 0.289 0.062 4.640 0.000
HighSchoolDiploma -0.097 0.612 -0.159 0.873
Some College and Vocation -0.399 0.729 -0.547 0.584
degree and more -0.087 0.822 -0.106 0.916
taken or not -0.772 1.423 -0.542 0.588
We can see that only age and BMI are significant whereas other variables education and whether
they were taking blood pressure medication are found to be non-significant for predicting the casual
serum glucose level at baseline. Both age and BMI have positive correlation with casual serum
glucose level at baseline.
As the education and whether they were taking blood pressure medication are found to be non-
significant for predicting the casual serum glucose level at baseline, we fit the model again using
age and BMI variables only. Following is the equation of multiple regression analysis for predicting
the casual serum glucose level at baseline using age and BMI as a predictor variables.
Casual serum glucose level at baseline = 63.35 + 0.192 × Age + 0.29 × BMI
Each incline in age results in 0.192 incline in casual serum glucose level whereas each unit of BMI
incline results in 0.29 incline in casual serum glucose level.
From bivariate analysis, we observed that mean age and BMI for person having casual serum
glucose >200 mg/dL at the baseline examination is more than the person having casual serum
Paraphrase This Document
Need a fresh take? Get an instant paraphrase of this document with our AI Paraphraser
glucose ≤ 200 mg/dL at the baseline examination. And from the multivariate analysis we observed
that each icline in age and BMI results in incline in the casual serum glucose level.
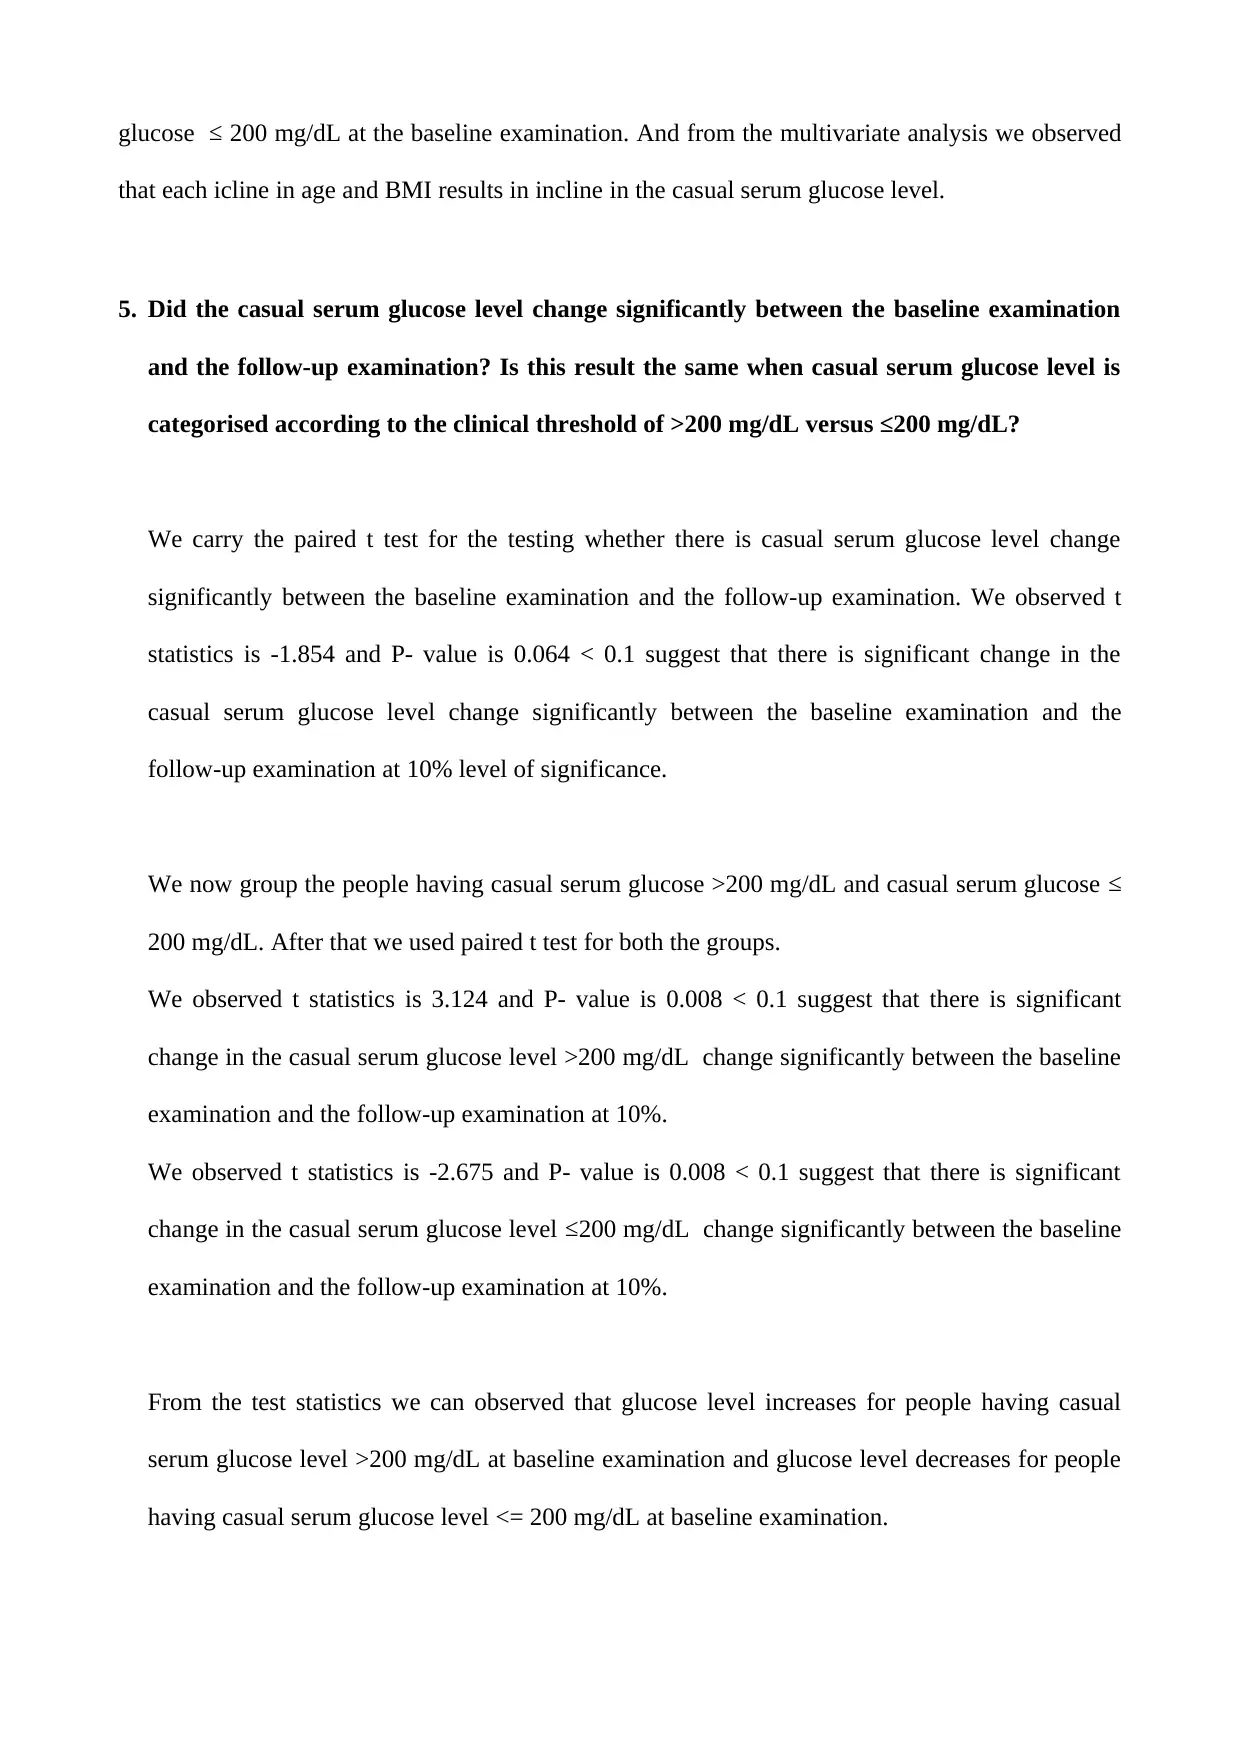
5. Did the casual serum glucose level change significantly between the baseline examination
and the follow-up examination? Is this result the same when casual serum glucose level is
categorised according to the clinical threshold of >200 mg/dL versus ≤200 mg/dL?
We carry the paired t test for the testing whether there is casual serum glucose level change
significantly between the baseline examination and the follow-up examination. We observed t
statistics is -1.854 and P- value is 0.064 < 0.1 suggest that there is significant change in the
casual serum glucose level change significantly between the baseline examination and the
follow-up examination at 10% level of significance.
We now group the people having casual serum glucose >200 mg/dL and casual serum glucose ≤
200 mg/dL. After that we used paired t test for both the groups.
We observed t statistics is 3.124 and P- value is 0.008 < 0.1 suggest that there is significant
change in the casual serum glucose level >200 mg/dL change significantly between the baseline
examination and the follow-up examination at 10%.
We observed t statistics is -2.675 and P- value is 0.008 < 0.1 suggest that there is significant
change in the casual serum glucose level ≤200 mg/dL change significantly between the baseline
examination and the follow-up examination at 10%.
From the test statistics we can observed that glucose level increases for people having casual
serum glucose level >200 mg/dL at baseline examination and glucose level decreases for people
having casual serum glucose level <= 200 mg/dL at baseline examination.
that each icline in age and BMI results in incline in the casual serum glucose level.
5. Did the casual serum glucose level change significantly between the baseline examination
and the follow-up examination? Is this result the same when casual serum glucose level is
categorised according to the clinical threshold of >200 mg/dL versus ≤200 mg/dL?
We carry the paired t test for the testing whether there is casual serum glucose level change
significantly between the baseline examination and the follow-up examination. We observed t
statistics is -1.854 and P- value is 0.064 < 0.1 suggest that there is significant change in the
casual serum glucose level change significantly between the baseline examination and the
follow-up examination at 10% level of significance.
We now group the people having casual serum glucose >200 mg/dL and casual serum glucose ≤
200 mg/dL. After that we used paired t test for both the groups.
We observed t statistics is 3.124 and P- value is 0.008 < 0.1 suggest that there is significant
change in the casual serum glucose level >200 mg/dL change significantly between the baseline
examination and the follow-up examination at 10%.
We observed t statistics is -2.675 and P- value is 0.008 < 0.1 suggest that there is significant
change in the casual serum glucose level ≤200 mg/dL change significantly between the baseline
examination and the follow-up examination at 10%.
From the test statistics we can observed that glucose level increases for people having casual
serum glucose level >200 mg/dL at baseline examination and glucose level decreases for people
having casual serum glucose level <= 200 mg/dL at baseline examination.

⊘ This is a preview!⊘
Do you want full access?
Subscribe today to unlock all pages.
Trusted by 1+ million students worldwide
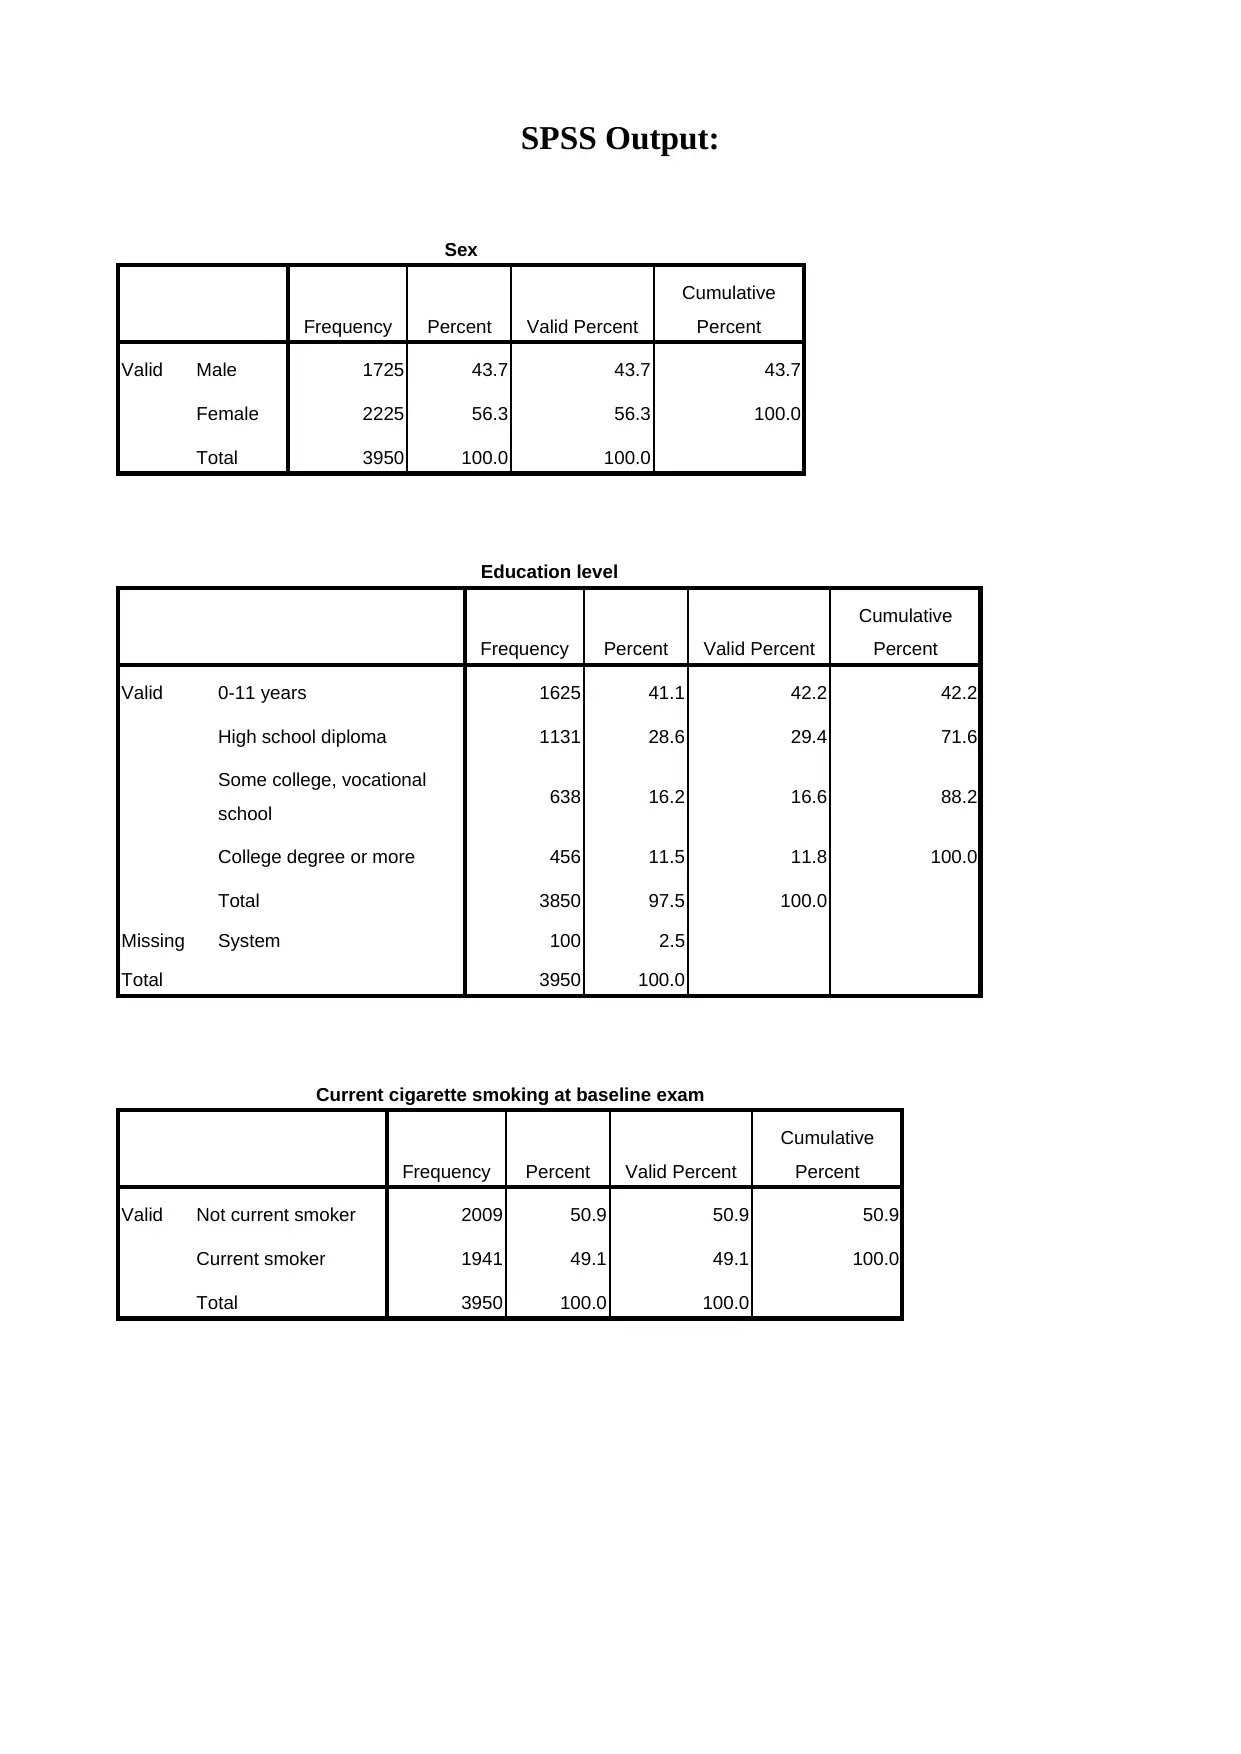
SPSS Output:
Sex
Frequency Percent Valid Percent
Cumulative
Percent
Valid Male 1725 43.7 43.7 43.7
Female 2225 56.3 56.3 100.0
Total 3950 100.0 100.0
Education level
Frequency Percent Valid Percent
Cumulative
Percent
Valid 0-11 years 1625 41.1 42.2 42.2
High school diploma 1131 28.6 29.4 71.6
Some college, vocational
school 638 16.2 16.6 88.2
College degree or more 456 11.5 11.8 100.0
Total 3850 97.5 100.0
Missing System 100 2.5
Total 3950 100.0
Current cigarette smoking at baseline exam
Frequency Percent Valid Percent
Cumulative
Percent
Valid Not current smoker 2009 50.9 50.9 50.9
Current smoker 1941 49.1 49.1 100.0
Total 3950 100.0 100.0
Paraphrase This Document
Need a fresh take? Get an instant paraphrase of this document with our AI Paraphraser
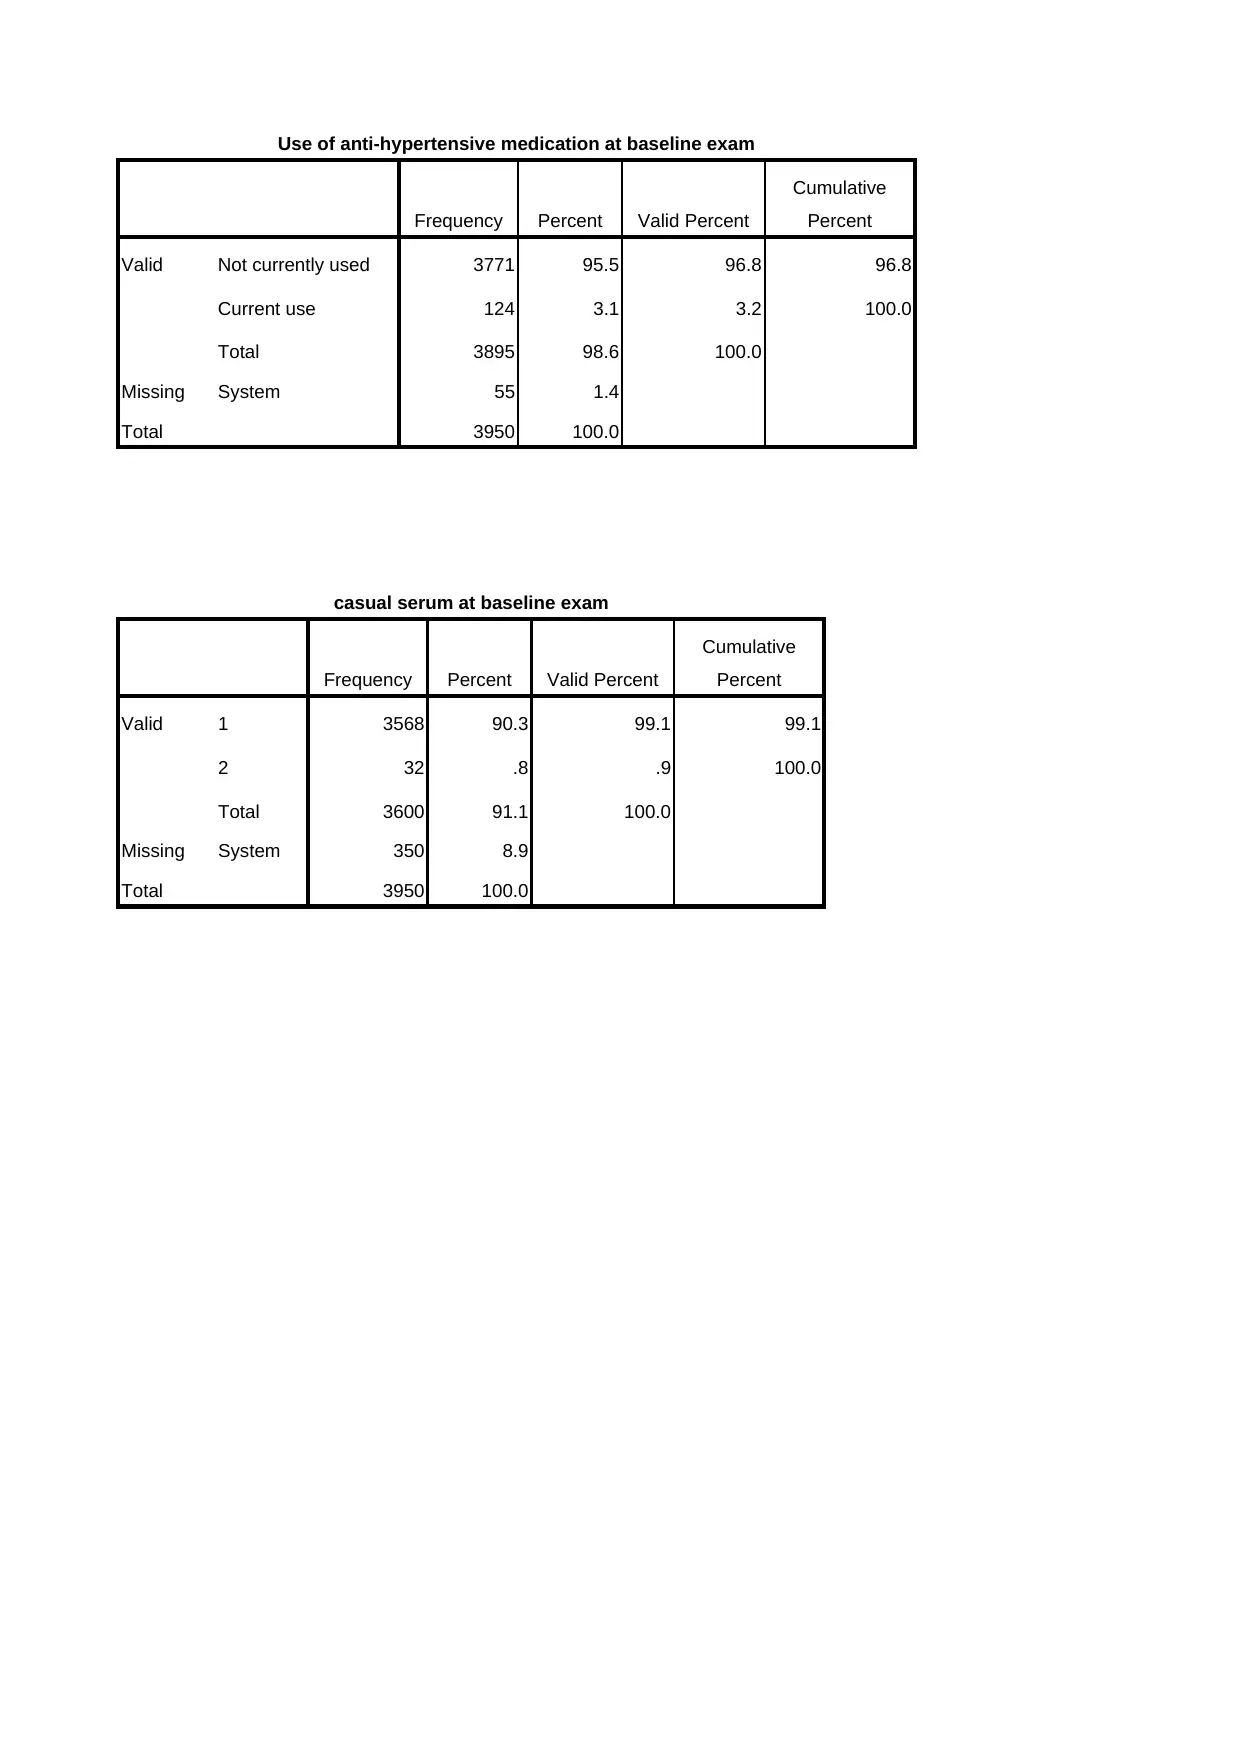
Use of anti-hypertensive medication at baseline exam
Frequency Percent Valid Percent
Cumulative
Percent
Valid Not currently used 3771 95.5 96.8 96.8
Current use 124 3.1 3.2 100.0
Total 3895 98.6 100.0
Missing System 55 1.4
Total 3950 100.0
casual serum at baseline exam
Frequency Percent Valid Percent
Cumulative
Percent
Valid 1 3568 90.3 99.1 99.1
2 32 .8 .9 100.0
Total 3600 91.1 100.0
Missing System 350 8.9
Total 3950 100.0
Frequency Percent Valid Percent
Cumulative
Percent
Valid Not currently used 3771 95.5 96.8 96.8
Current use 124 3.1 3.2 100.0
Total 3895 98.6 100.0
Missing System 55 1.4
Total 3950 100.0
casual serum at baseline exam
Frequency Percent Valid Percent
Cumulative
Percent
Valid 1 3568 90.3 99.1 99.1
2 32 .8 .9 100.0
Total 3600 91.1 100.0
Missing System 350 8.9
Total 3950 100.0
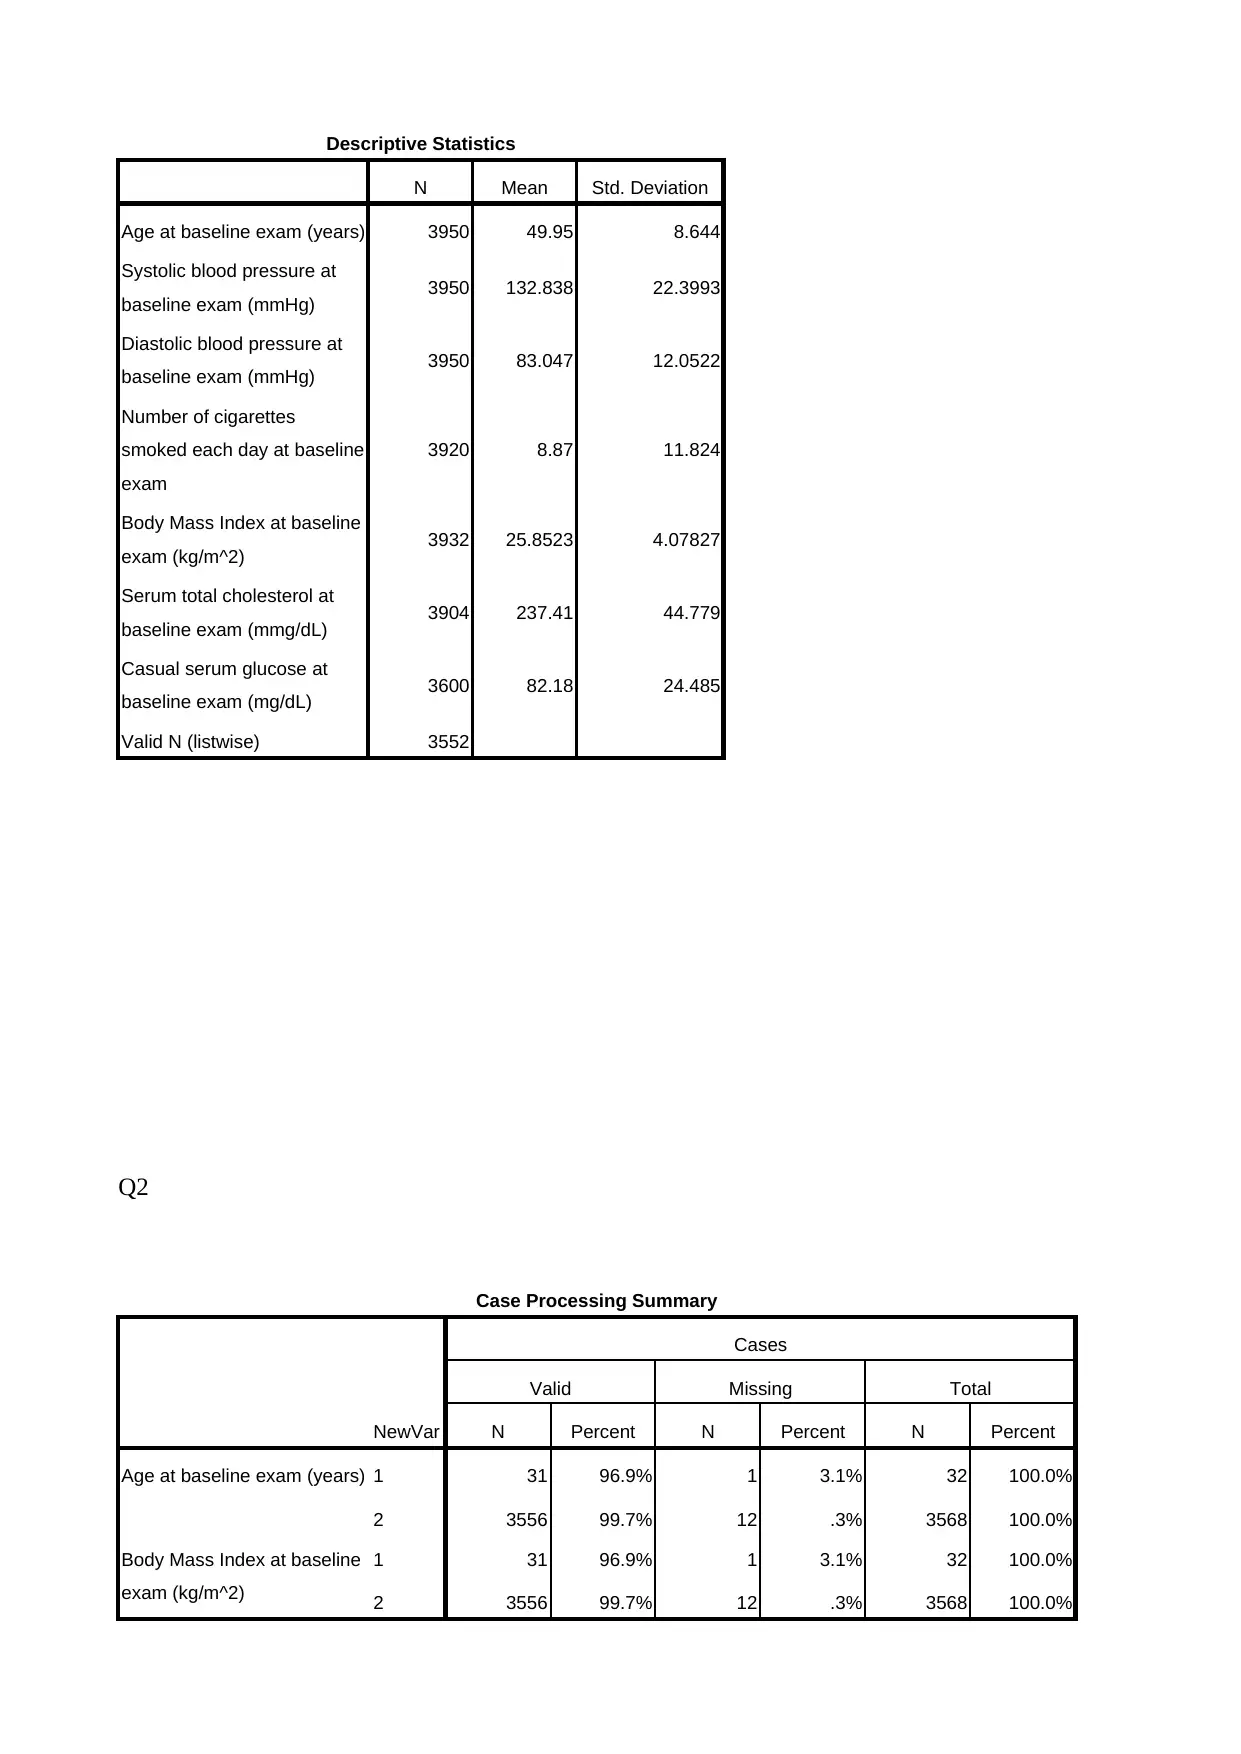
Descriptive Statistics
N Mean Std. Deviation
Age at baseline exam (years) 3950 49.95 8.644
Systolic blood pressure at
baseline exam (mmHg) 3950 132.838 22.3993
Diastolic blood pressure at
baseline exam (mmHg) 3950 83.047 12.0522
Number of cigarettes
smoked each day at baseline
exam
3920 8.87 11.824
Body Mass Index at baseline
exam (kg/m^2) 3932 25.8523 4.07827
Serum total cholesterol at
baseline exam (mmg/dL) 3904 237.41 44.779
Casual serum glucose at
baseline exam (mg/dL) 3600 82.18 24.485
Valid N (listwise) 3552
Q2
Case Processing Summary
NewVar
Cases
Valid Missing Total
N Percent N Percent N Percent
Age at baseline exam (years) 1 31 96.9% 1 3.1% 32 100.0%
2 3556 99.7% 12 .3% 3568 100.0%
Body Mass Index at baseline
exam (kg/m^2)
1 31 96.9% 1 3.1% 32 100.0%
2 3556 99.7% 12 .3% 3568 100.0%
⊘ This is a preview!⊘
Do you want full access?
Subscribe today to unlock all pages.
Trusted by 1+ million students worldwide
Education level * NewVar Crosstabulation
Count
NewVar
Total1 2
Education level 0-11 years 20 1470 1490
High school diploma 6 1020 1026
Some college, vocational
school 5 572 577
College degree or more 0 415 415
Total 31 3477 3508
Use of anti-hypertensive medication at baseline exam * NewVar Crosstabulation
Count
NewVar
Total1 2
Use of anti-hypertensive
medication at baseline exam
Not currently used 29 3402 3431
Current use 3 113 116
Total 32 3515 3547
Q3:
Count
NewVar
Total1 2
Education level 0-11 years 20 1470 1490
High school diploma 6 1020 1026
Some college, vocational
school 5 572 577
College degree or more 0 415 415
Total 31 3477 3508
Use of anti-hypertensive medication at baseline exam * NewVar Crosstabulation
Count
NewVar
Total1 2
Use of anti-hypertensive
medication at baseline exam
Not currently used 29 3402 3431
Current use 3 113 116
Total 32 3515 3547
Q3:
Paraphrase This Document
Need a fresh take? Get an instant paraphrase of this document with our AI Paraphraser
Case Processing Summary
casual
serum
at
baseline
exam
Cases
Valid Missing Total
N Percent N Percent N Percent
Age at baseline exam (years) 1 3556 99.7% 12 .3% 3568 100.0%
2 31 96.9% 1 3.1% 32 100.0%
Body Mass Index at baseline
exam (kg/m^2)
1 3556 99.7% 12 .3% 3568 100.0%
2 31 96.9% 1 3.1% 32 100.0%
Descriptives
casual serum at baseline exam Statistic Std. Error
Age at baseline exam (years) 1 Mean 49.94 .145
95% Confidence Interval for
Mean
Lower Bound 49.66
Upper Bound 50.22
5% Trimmed Mean 49.82
Median 49.00
Variance 74.613
Std. Deviation 8.638
Minimum 32
Maximum 70
Range 38
Interquartile Range 14
Skewness .199 .041
Kurtosis -1.014 .082
2 Mean 55.71 1.209
95% Confidence Interval for
Mean
Lower Bound 53.24
Upper Bound 58.18
5% Trimmed Mean 55.81
Median 56.00
Variance 45.280
Std. Deviation 6.729
Minimum 43
Maximum 67
Range 24
Interquartile Range 10
Skewness -.249 .421
Kurtosis -.790 .821
Body Mass Index at baseline
exam (kg/m^2)
1 Mean 25.8425 .06789
95% Confidence Interval for
Mean
Lower Bound 25.7094
Upper Bound 25.9756
5% Trimmed Mean 25.6369
Median 25.4250
Variance 16.388
Std. Deviation 4.04821
Minimum 15.54
Maximum 56.80
Range 41.26
Interquartile Range 4.99
Skewness .961 .041
Kurtosis 2.507 .082
2 Mean 28.3565 1.00394
95% Confidence Interval for
Mean
Lower Bound 26.3061
Upper Bound 30.4068
5% Trimmed Mean 28.1757
Median 28.5000
Variance 31.245
Std. Deviation 5.58969
Minimum 17.17
Maximum 43.67
Range 26.50
Interquartile Range 7.39
Skewness .407 .421
Kurtosis .760 .821
⊘ This is a preview!⊘
Do you want full access?
Subscribe today to unlock all pages.
Trusted by 1+ million students worldwide
1 out of 21


Your All-in-One AI-Powered Toolkit for Academic Success.
+13062052269
info@desklib.com
Available 24*7 on WhatsApp / Email
![[object Object]](/_next/static/media/star-bottom.7253800d.svg)
Unlock your academic potential
Copyright © 2020–2025 A2Z Services. All Rights Reserved. Developed and managed by ZUCOL.