Analyzing Regression Models and Statistical Tests: Assignment
VerifiedAdded on 2023/06/03
|3
|608
|213
Homework Assignment
AI Summary
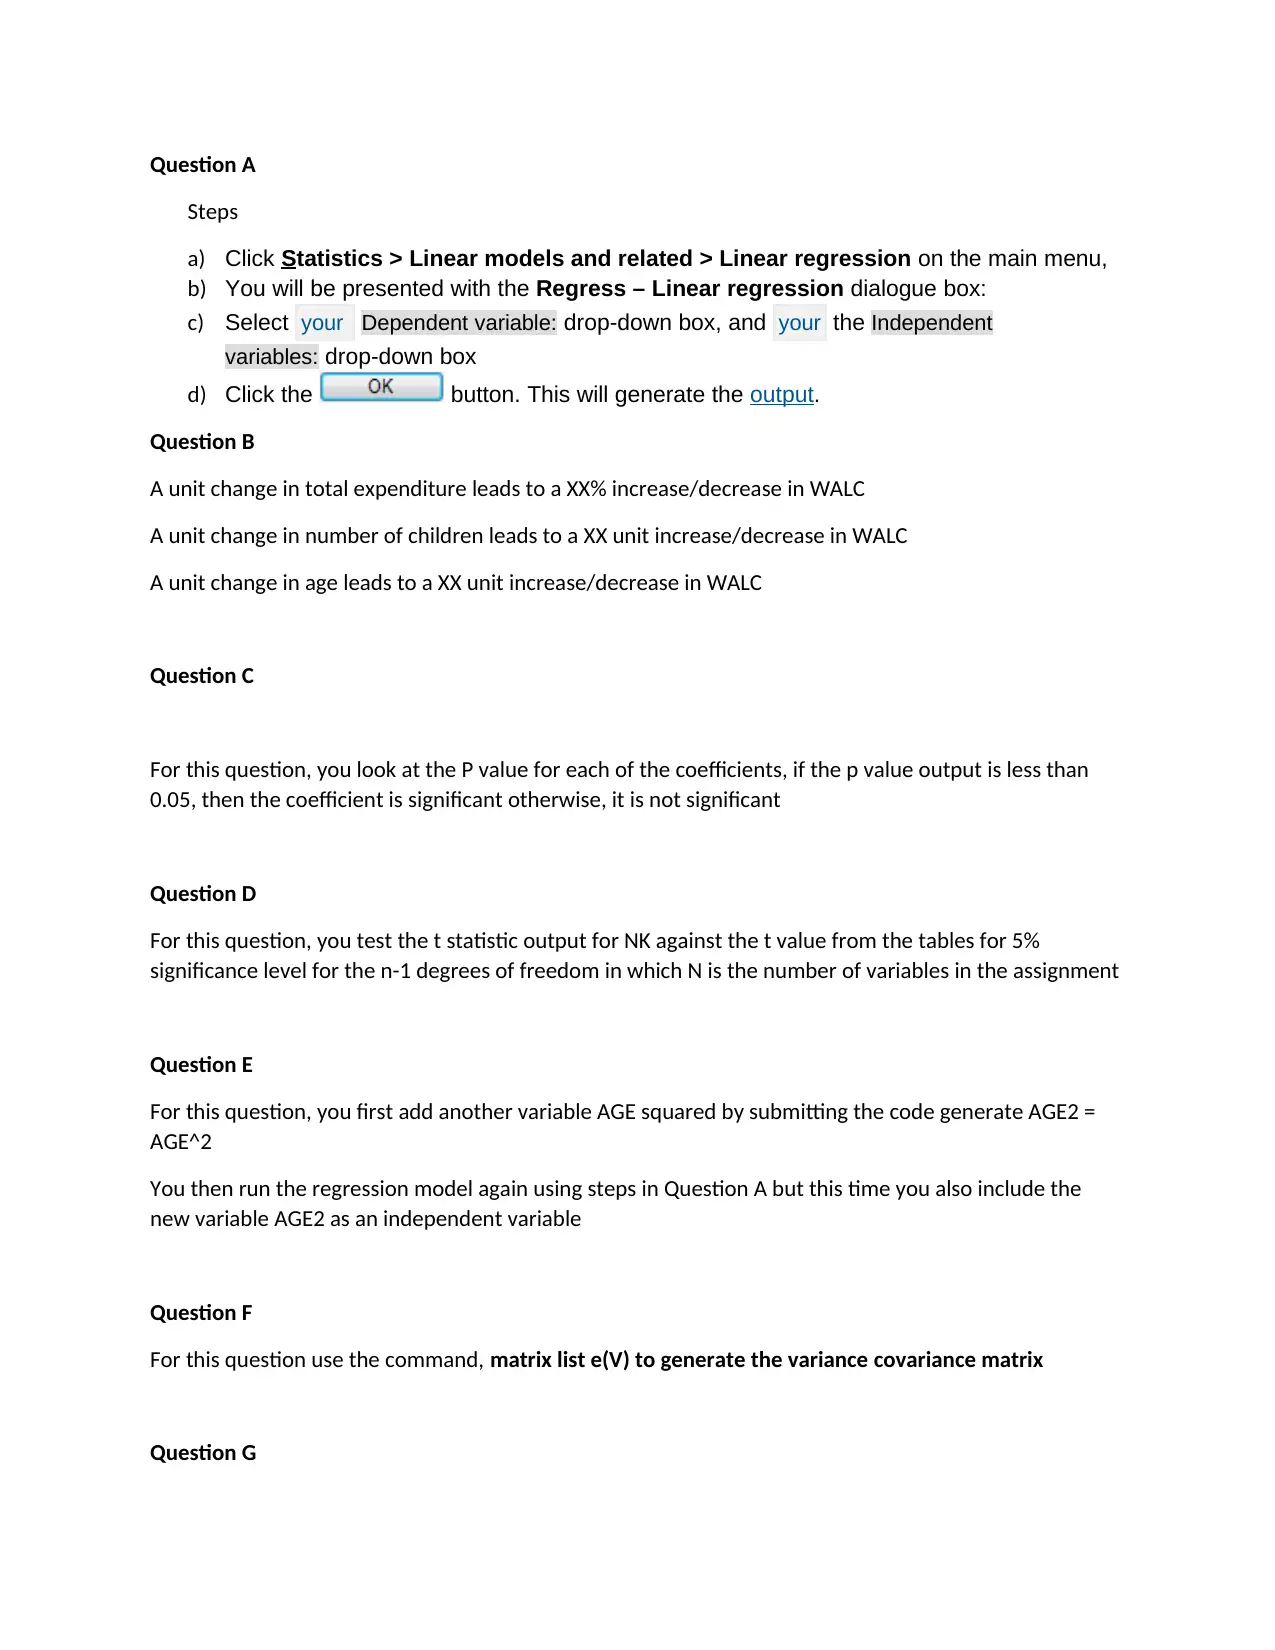
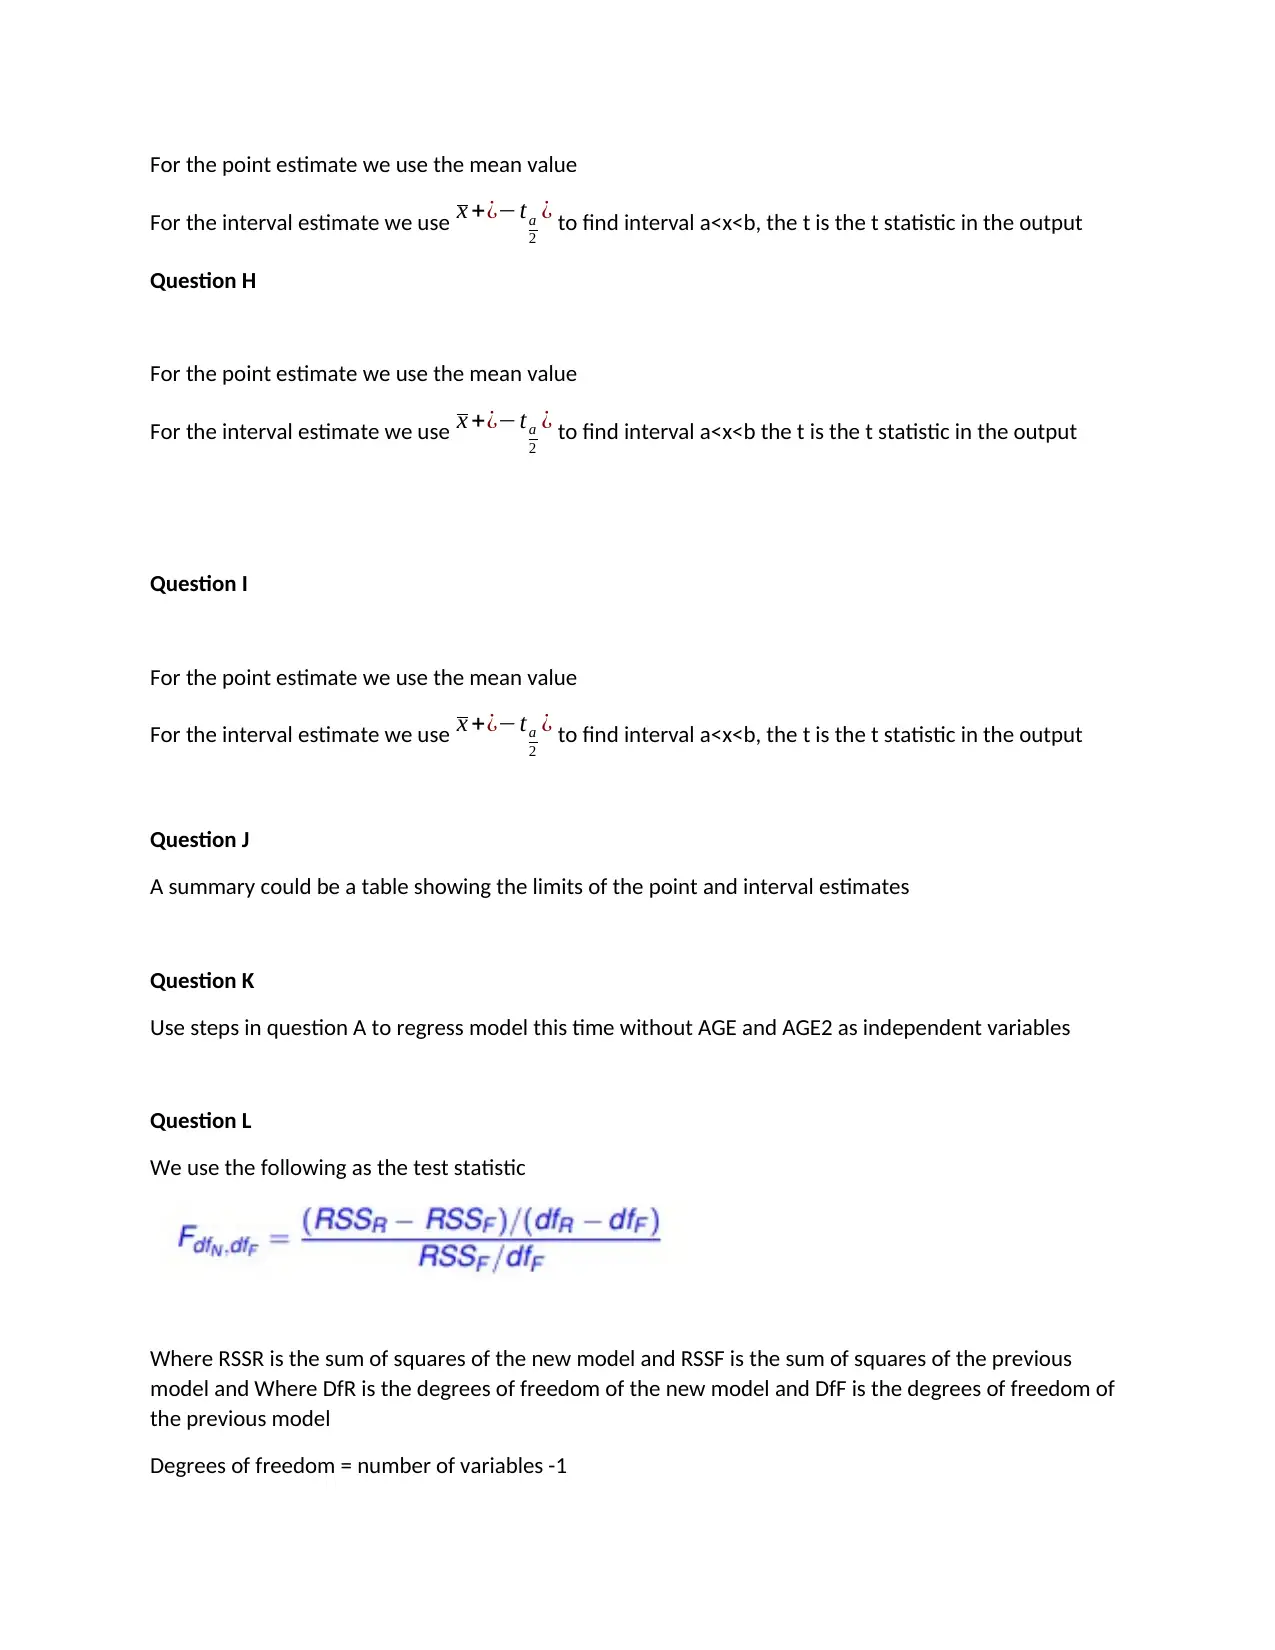
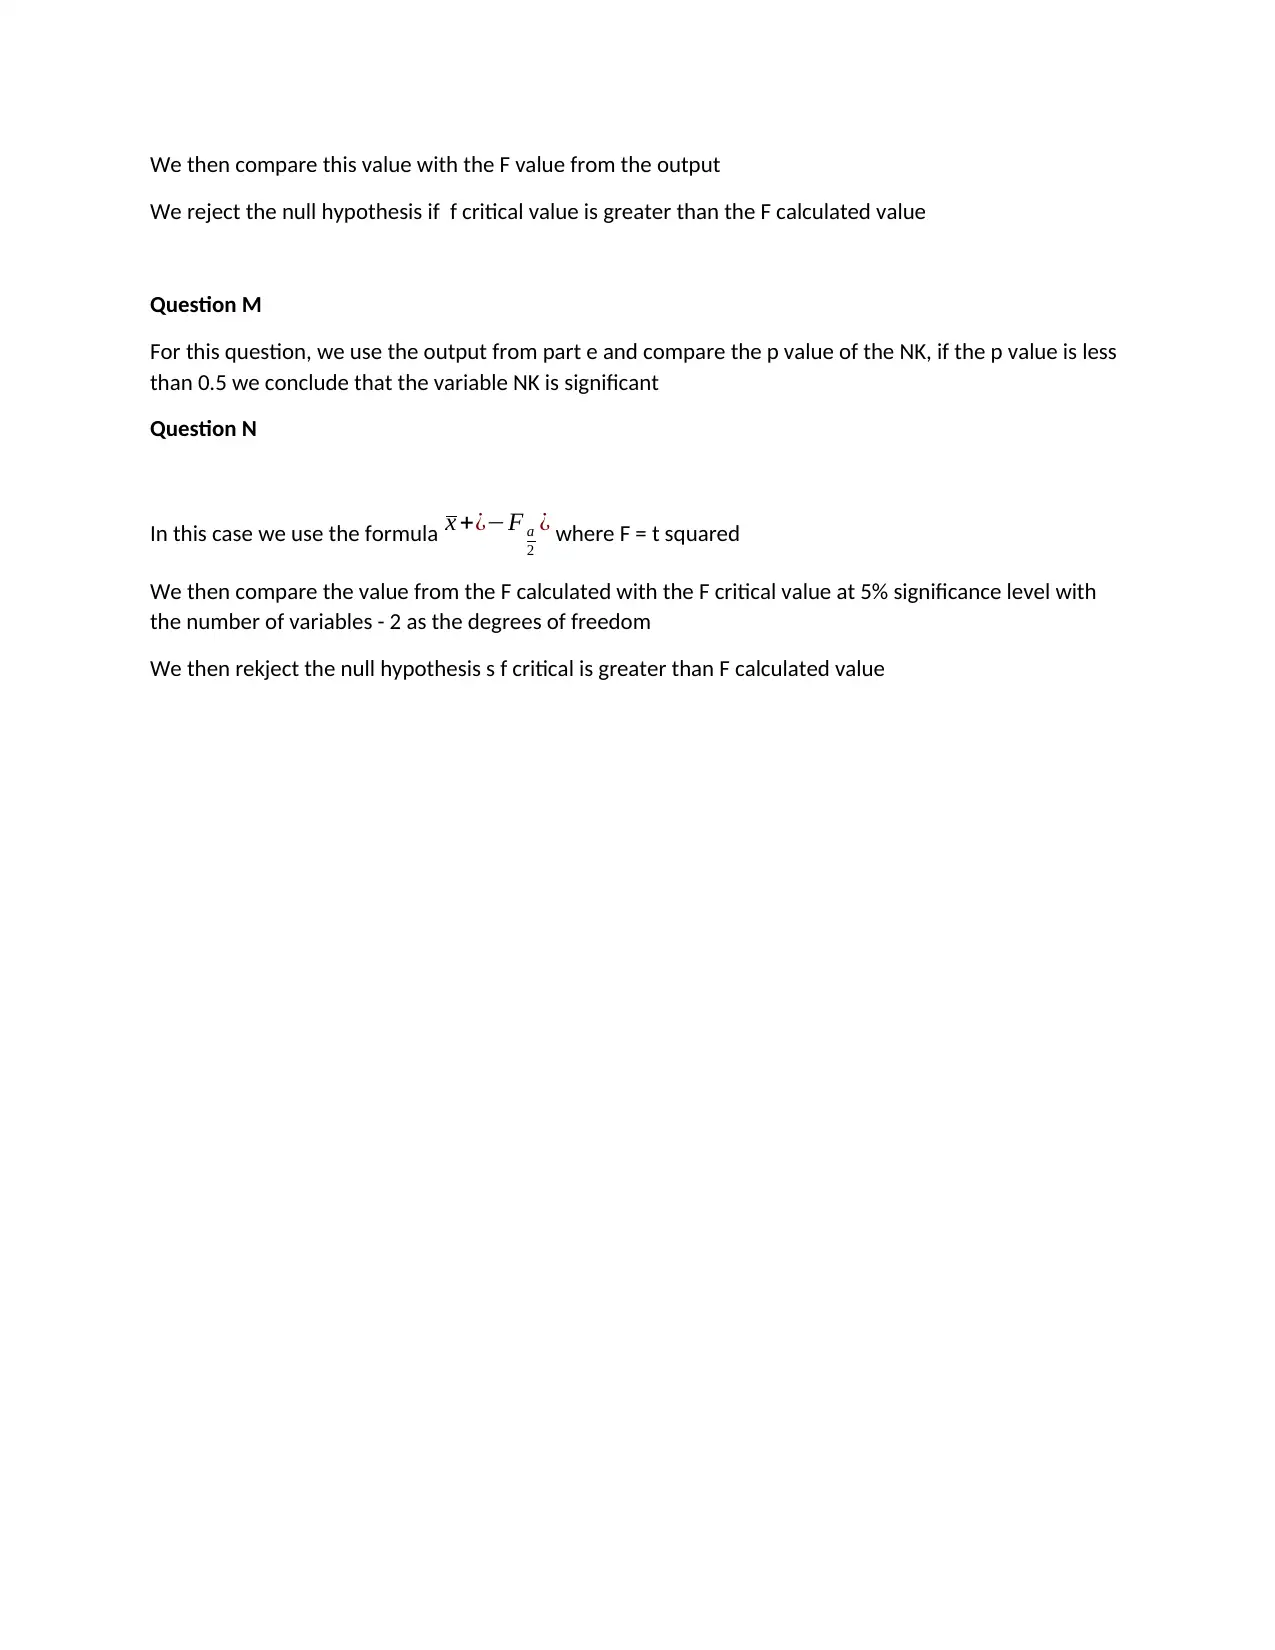
This document provides a comprehensive solution to a statistics assignment focusing on regression analysis and hypothesis testing. The assignment covers a range of statistical concepts and techniques, including linear regression, t-statistics, p-values, F-statistics, and variance-covariance matrices. The solution details step-by-step instructions and explanations for each question, from interpreting coefficients and determining statistical significance to constructing point and interval estimates and performing hypothesis tests. The assignment involves the analysis of data using statistical software, requiring the application of various formulas and the interpretation of statistical outputs. The document also includes instructions on how to use statistical software to perform the analysis and interpret the results. The solutions provided are designed to guide students through the process of understanding and applying statistical methods to real-world problems. This assignment covers a wide range of topics within statistics, from basic regression models to more complex hypothesis testing and inference techniques.
1 out of 3
Related Documents


Your All-in-One AI-Powered Toolkit for Academic Success.
+13062052269
info@desklib.com
Available 24*7 on WhatsApp / Email
![[object Object]](/_next/static/media/star-bottom.7253800d.svg)
Copyright © 2020–2026 A2Z Services. All Rights Reserved. Developed and managed by ZUCOL.