FR2202 Financial Econometrics: Determinants of Apple Stock Returns
VerifiedAdded on 2023/05/29
|21
|5257
|86
Report
AI Summary
This report investigates the determinants of Apple Inc.'s stock returns using financial econometrics, focusing on the impact of the S&P 500 composite and the S&P 500 Information Technology sector indices. The analysis covers a two-year period from October 2016 to October 2018, using daily returns data. Simple and multiple regression models are employed to assess the relationship between Apple's stock returns and the market indices, including tests for structural breaks. The findings suggest a significant correlation between S&P 500 indices and Apple's stock performance, with some evidence of structural changes during the analyzed period. The report includes descriptive statistics, plots of daily returns, and detailed regression results, providing a comprehensive econometric analysis of Apple Inc.'s stock market behavior.
FR2202: Financial Econometrics
An investigation of the determinants of the stock returns of
Apple Inc.
Group
Abstract
We examine the effects of S&P 500 returns on the Apple Inc. stock, and how it is influenced
by the performance of the market in the information technology sector. In addition, this
article takes into account the correlation between Apple Inc. and the capital indicators of S&P
500 composite and S&P 500 for Information Technology sector. Daily returns are for a
period of two years, from October 2016 to 2018 in October. The persistent variation of the
S&P500 compound is understandable, but the rapid change in daily returns in the first quarter
of 2018 is an observation is also taken into account. The fluctuation of the S&P 500 for
information technology stocks are also identified in the first and second quarter of 2018. We
made two simple regression models or daily returns of capital of Apple Inc. on the market
profitability for the index S&P 500 compound and the daily market return for the S&P 500
sector index. The S&P 500 market indexes were considered as predictors and the output
variables are tasks such as the daily market returns for Apple Inc. shares. The models from
the previous section were improved to a multiple linear regression model with S&P500
composite and S&P 500 IT sectors as joint predictors. The multiple-regression model is later
modified by entering a fictitious index for the period of the two-year return period of the data.
A structural fracture was investigated for the chow test with the structural test. The S & P 500
IT composite index in the multiple-regression model had an adverse effect on Apple Inc.
daily returns due to the multi co-linearity of the daily returns of S & P 500 IT shares. The
structural interruptions were not significant in the modified regression model.
Paraphrase This Document
Need a fresh take? Get an instant paraphrase of this document with our AI Paraphraser
Table of Contents
Introduction...........................................................................................................3
Data: plots and summary statistics.......................................................................4
Simple Regression models....................................................................................8
OLS Regression Model 1:.................................................................................8
OLS Regression Model 2:...............................................................................11
Multiple regression Model..................................................................................11
Modified Model of Regression........................................................................15
Conclusion..........................................................................................................18
References...........................................................................................................20
Introduction
Apple Inc. is a marketing unit of an American multinational headquartered in Cupertino,
California, which develops, develops and sells consumer electronics, software, and online
services. Apple is founded in April 1976 by Steve Jobs, Steve Wozniak, and Ronald Wayne
to develop and sell the Apple Wozniak computer I. It is recorded in January 1977 under the
name Apple Computer, Inc., and the sales of its computers, including Apple II, have
increased rapidly (ENGELBERG, and Gao, 2011; Adjasi, Harvey, and Agyapong, 2008).
Stock trading is an economic activity that requires a high degree of precision in its
application. Many methods are used in stock trading to maximize returns. Of the many
methods used, there are sometimes methods that do not offer the maximum benefit or even
the disadvantages. Trading in shares is bound to the country where the company's shares are
located. Technical indicators relating to the stock movement curve. The most important part
of the formation of stock movements consists of 5 price components: open, high, low, final
and transaction volumes.
In this report, we will examine how the effects on stock Apple Inc. is influenced by market
returns and returns on the information technology sector. In addition in this article, we
consider the correlation between the Apple Inc. and the Standard and Poor 500 (S&P 500)
stocks and information technology sector S&P 500 stock indicators. Our research is
conducted at four different levels, from the descriptive analysis of daily returns of Apple
stock to the impact of S&P indicators’ daily returns on the daily returns of Apple Inc. within
a time period of 26th October 2016 to 26th October 2018.
We find that the movement of share prices of Apple Inc. reflected the change in trend starting
from the second quarter of 2018. The S&P500 indicators, when compared with the Apple
stock price were found to have marked the difference in daily prices. At the stock market
level, we find that the daily returns of the S&P500 composite are significantly correlated with
the daily return of the Apple prices (Mao, Counts, and Bollen, 2011)
In a final experiment, we investigate whether a new variable, S&P500 information sector
index will have a significant impact we also used a linear regression model to predict market
returns for Apple Inc. that use the S&P data as an exogenous input. Specifically, we identify
couples in each level and we expect the stock indicators according to the model. Our findings
⊘ This is a preview!⊘
Do you want full access?
Subscribe today to unlock all pages.
Trusted by 1+ million students worldwide
show that S&P indices are useful in predicting the price of Apple shares, and the impact of
any structural break in the OLS regression model.
Data: plots and summary statistics
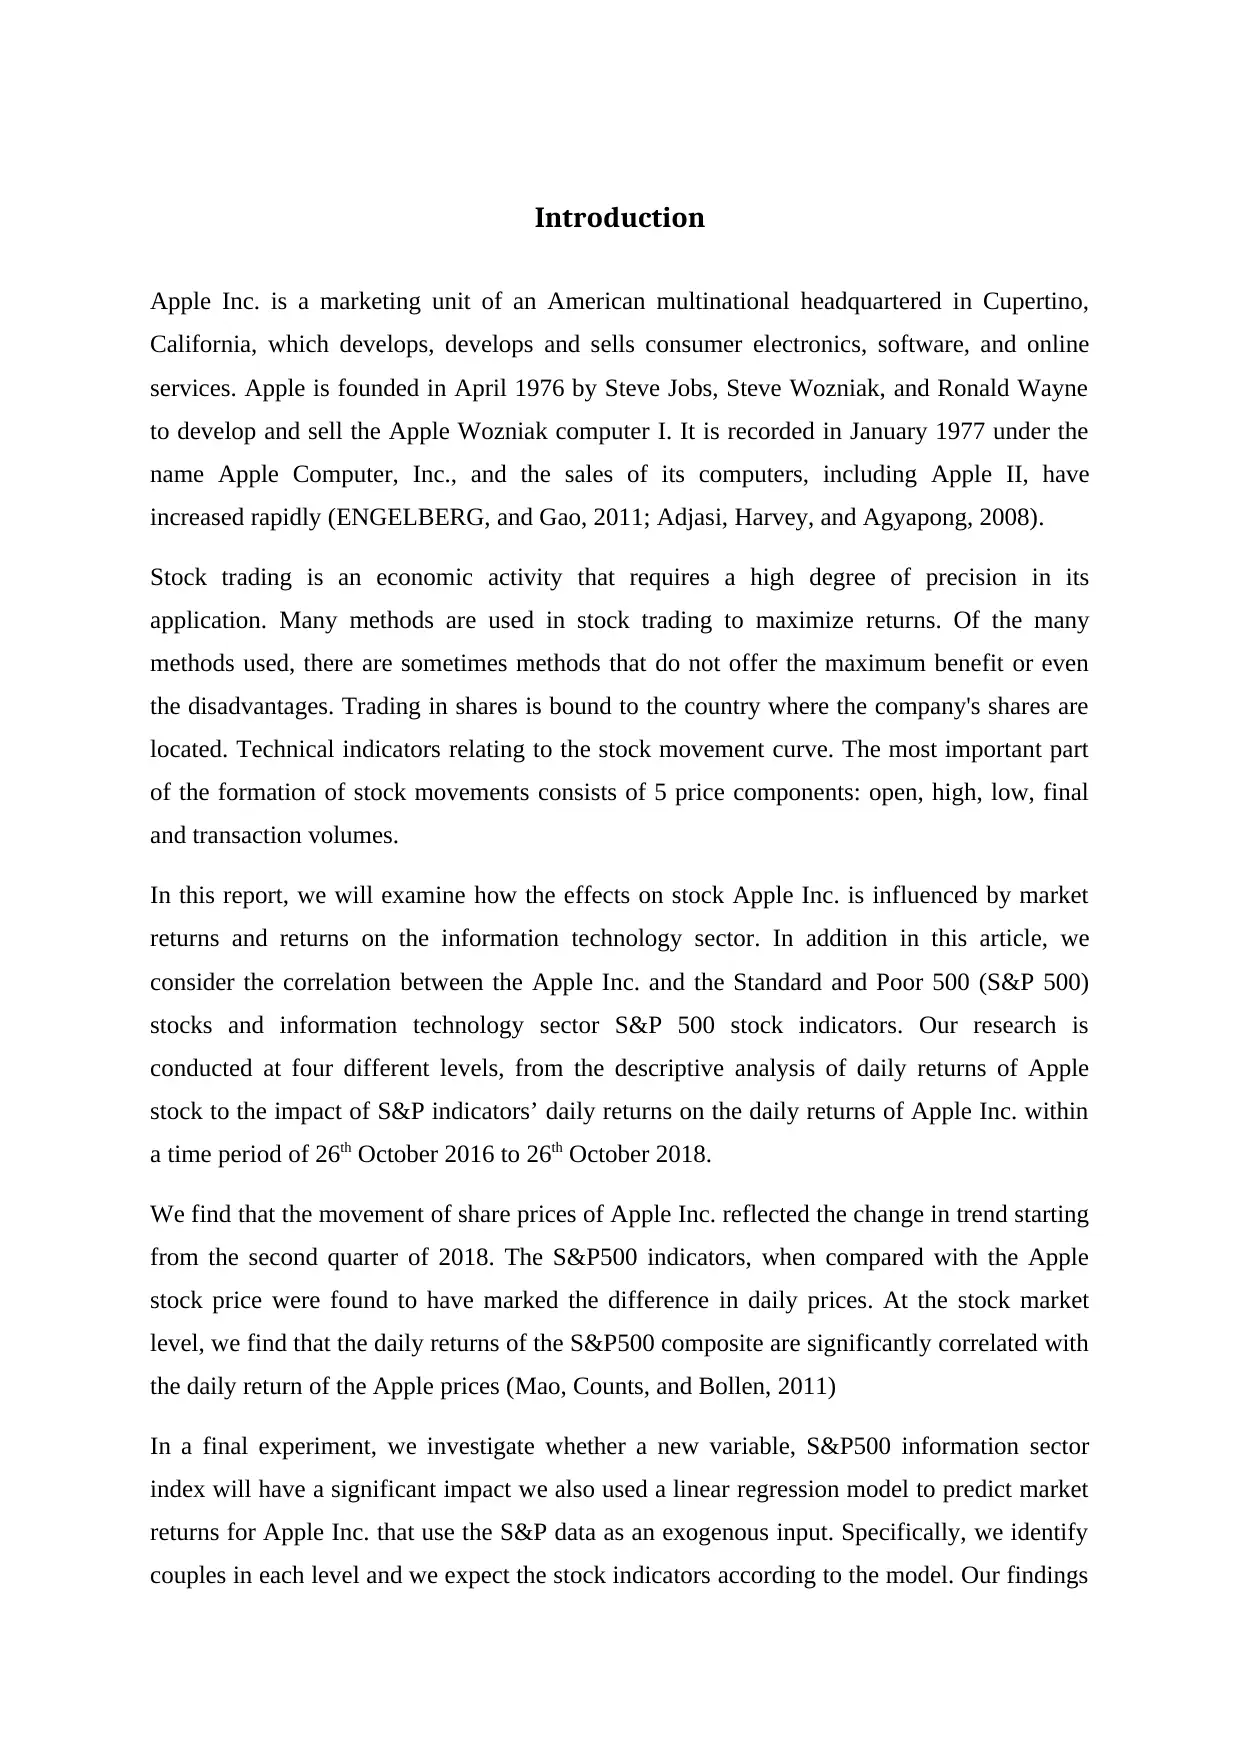
Task -3: Figure 1 shows that the ever-increasing share trend of Apple Inc. and the
comparative analysis with S&P500 composite and S&P500 information technology sector
share prices is done in the second graph. The normalized values of daily share values have
been plotted in the comparative analysis, whereas Apple Inc. daily share values have used in
the raw form in the first graph. From the first quarter of 2018, the variation in the
standardized curves is noted, where the Apple Inc stock is observed to take an upswing
instead of downtrend of S&P Indices. People were probably buying more I-phones, I-pads, or
other Apple products with a downward trend of the market.
Figure 1: Apple Inc. Share prices and Comparative Graph with S&P Indices
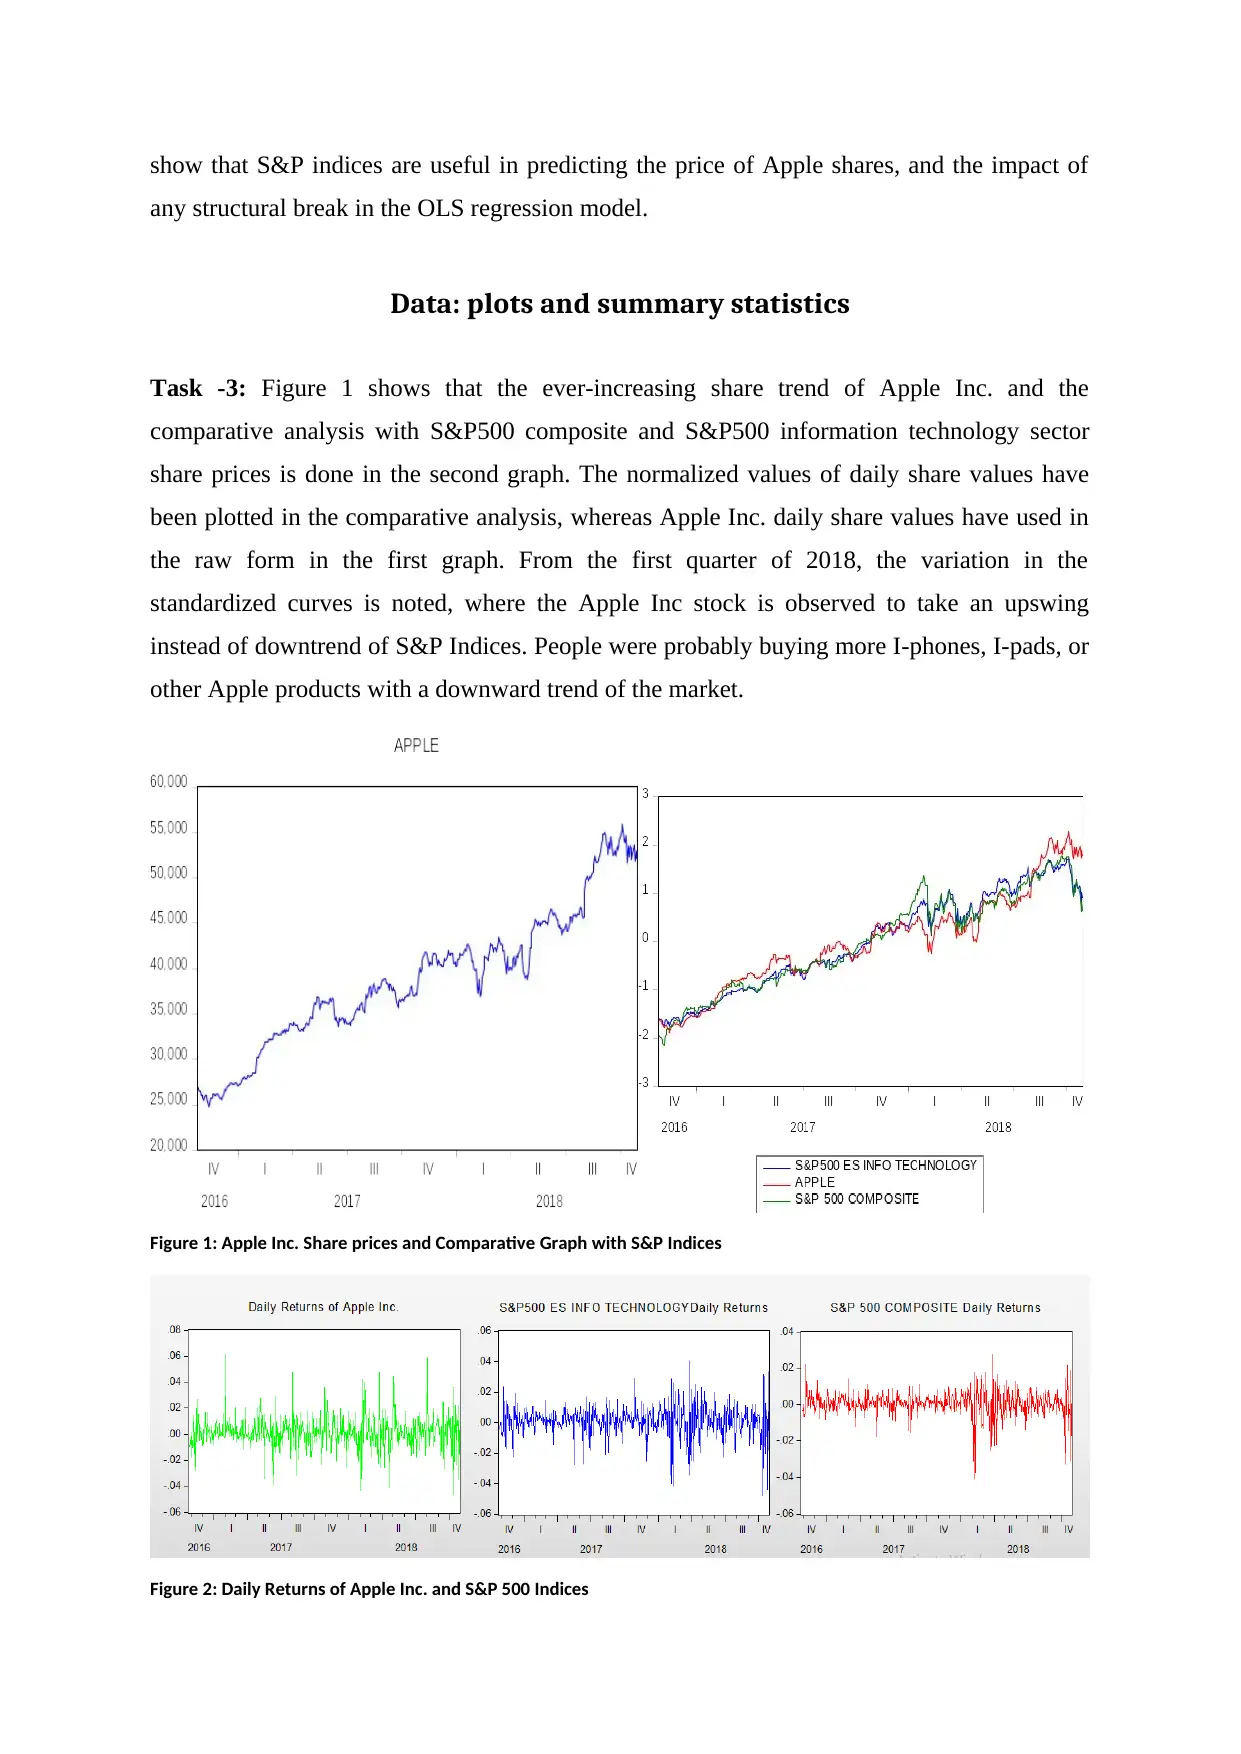
Figure 2: Daily Returns of Apple Inc. and S&P 500 Indices
any structural break in the OLS regression model.
Data: plots and summary statistics
Task -3: Figure 1 shows that the ever-increasing share trend of Apple Inc. and the
comparative analysis with S&P500 composite and S&P500 information technology sector
share prices is done in the second graph. The normalized values of daily share values have
been plotted in the comparative analysis, whereas Apple Inc. daily share values have used in
the raw form in the first graph. From the first quarter of 2018, the variation in the
standardized curves is noted, where the Apple Inc stock is observed to take an upswing
instead of downtrend of S&P Indices. People were probably buying more I-phones, I-pads, or
other Apple products with a downward trend of the market.
Figure 1: Apple Inc. Share prices and Comparative Graph with S&P Indices
Figure 2: Daily Returns of Apple Inc. and S&P 500 Indices
Paraphrase This Document
Need a fresh take? Get an instant paraphrase of this document with our AI Paraphraser
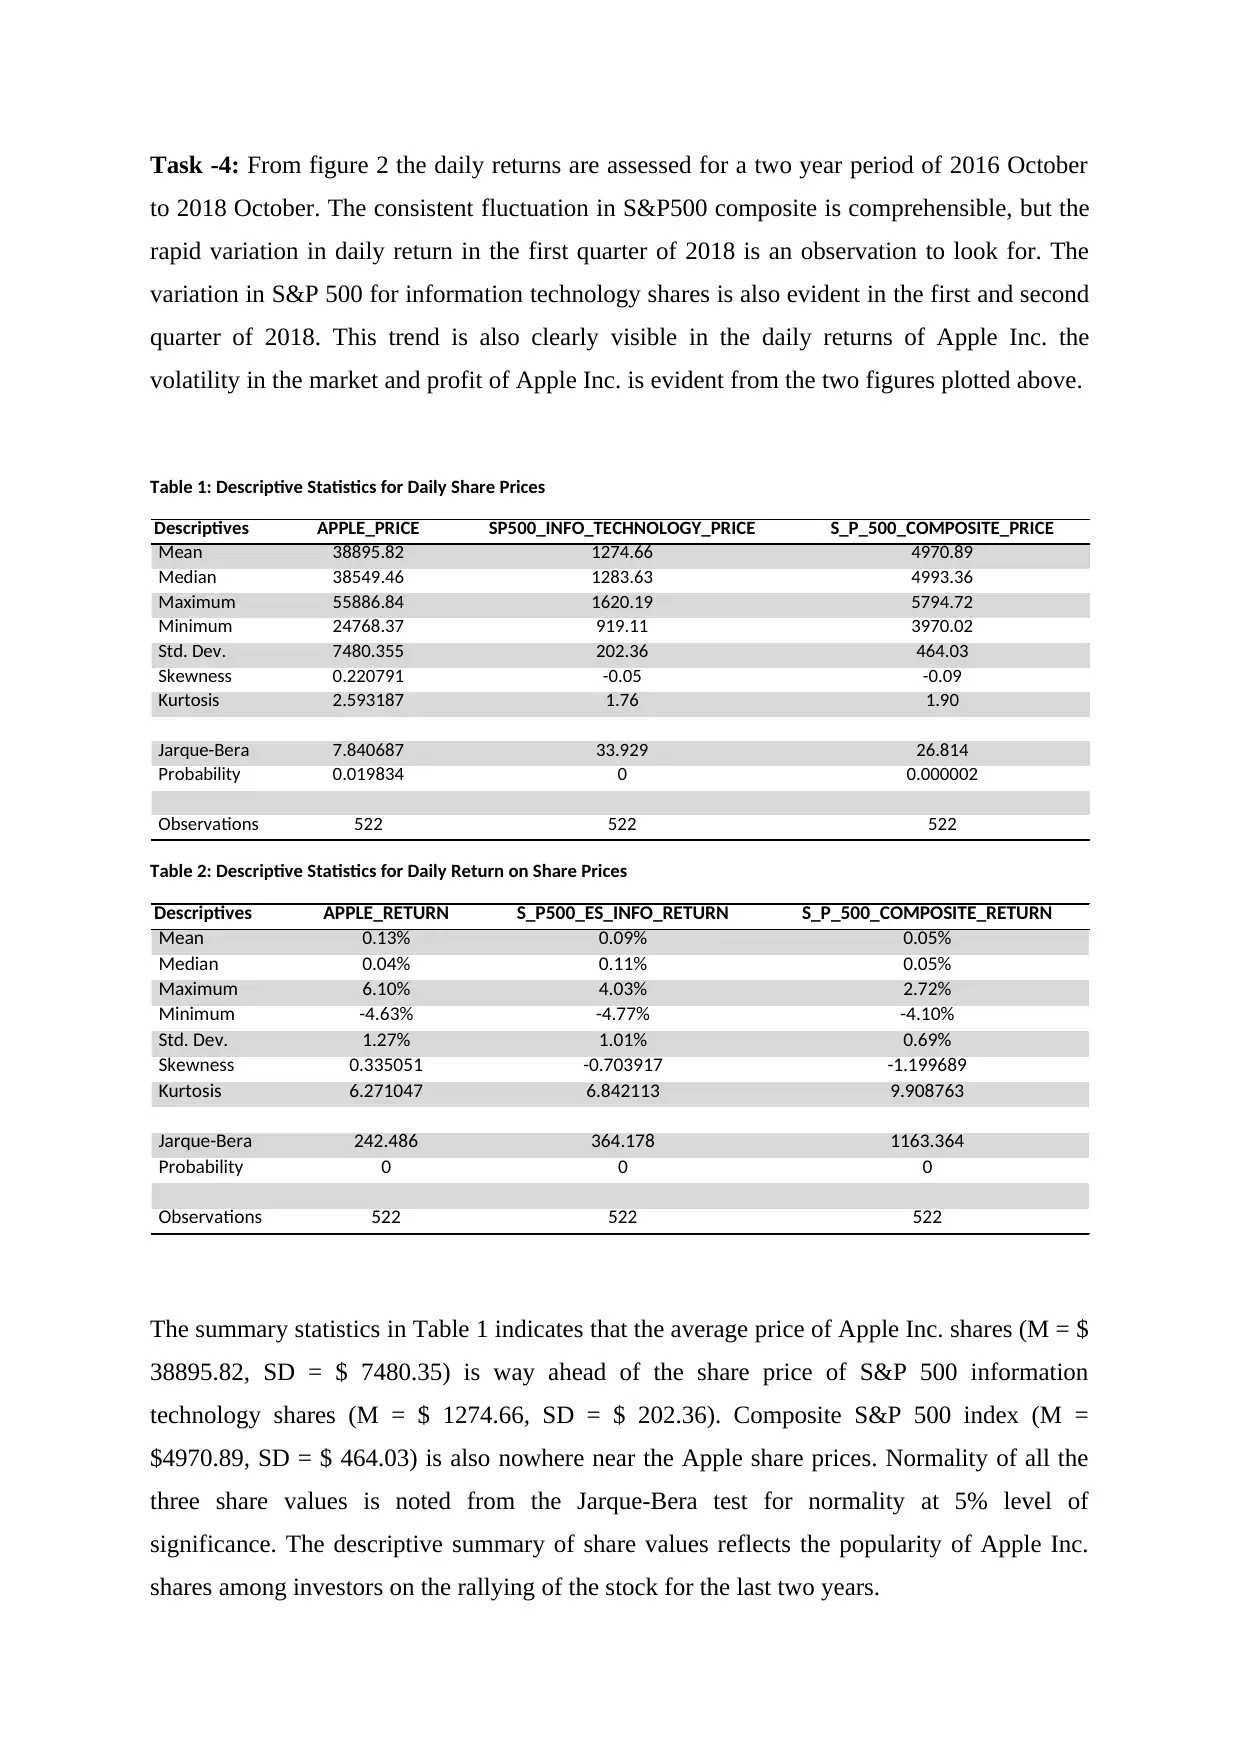
Task -4: From figure 2 the daily returns are assessed for a two year period of 2016 October
to 2018 October. The consistent fluctuation in S&P500 composite is comprehensible, but the
rapid variation in daily return in the first quarter of 2018 is an observation to look for. The
variation in S&P 500 for information technology shares is also evident in the first and second
quarter of 2018. This trend is also clearly visible in the daily returns of Apple Inc. the
volatility in the market and profit of Apple Inc. is evident from the two figures plotted above.
Table 1: Descriptive Statistics for Daily Share Prices
Descriptives APPLE_PRICE SP500_INFO_TECHNOLOGY_PRICE S_P_500_COMPOSITE_PRICE
Mean 38895.82 1274.66 4970.89
Median 38549.46 1283.63 4993.36
Maximum 55886.84 1620.19 5794.72
Minimum 24768.37 919.11 3970.02
Std. Dev. 7480.355 202.36 464.03
Skewness 0.220791 -0.05 -0.09
Kurtosis 2.593187 1.76 1.90
Jarque-Bera 7.840687 33.929 26.814
Probability 0.019834 0 0.000002
Observations 522 522 522
Table 2: Descriptive Statistics for Daily Return on Share Prices
Descriptives APPLE_RETURN S_P500_ES_INFO_RETURN S_P_500_COMPOSITE_RETURN
Mean 0.13% 0.09% 0.05%
Median 0.04% 0.11% 0.05%
Maximum 6.10% 4.03% 2.72%
Minimum -4.63% -4.77% -4.10%
Std. Dev. 1.27% 1.01% 0.69%
Skewness 0.335051 -0.703917 -1.199689
Kurtosis 6.271047 6.842113 9.908763
Jarque-Bera 242.486 364.178 1163.364
Probability 0 0 0
Observations 522 522 522
The summary statistics in Table 1 indicates that the average price of Apple Inc. shares (M = $
38895.82, SD = $ 7480.35) is way ahead of the share price of S&P 500 information
technology shares (M = $ 1274.66, SD = $ 202.36). Composite S&P 500 index (M =
$4970.89, SD = $ 464.03) is also nowhere near the Apple share prices. Normality of all the
three share values is noted from the Jarque-Bera test for normality at 5% level of
significance. The descriptive summary of share values reflects the popularity of Apple Inc.
shares among investors on the rallying of the stock for the last two years.
The summary statistics in Table 2 indicates that the average daily return on Apple Inc. (M =
0.13%, SD =1.27%) the stock is way ahead of the share price of S&P 500 information
technology shares (M =0.09%, SD =1.01%). Composite S&P 500 index (M = 0.05%, SD =
0.69%) is also nowhere near the Apple share prices. Normality of all the three share values is
noted from the Jarque-Bera test for normality at 5% level of significance. The descriptive
summary of share values reflects that the daily returns for the last two years on Apple Inc.
shares have been very encouraging, considering the fact that the trade happens at such high
daily stock prices. The market volatility of 1.27% is well understood at that level of share
price, where the minimum daily return is observed to be as low as - 4.63% and the highest
return as 6.10%. The popularity of Apple Inc. shares among investors is also evident due to
that fact that the composite S&P 500 and information technology sector S&P 500 were able
to provide daily returns maximum up to 2.72% and 4.03% respectively.
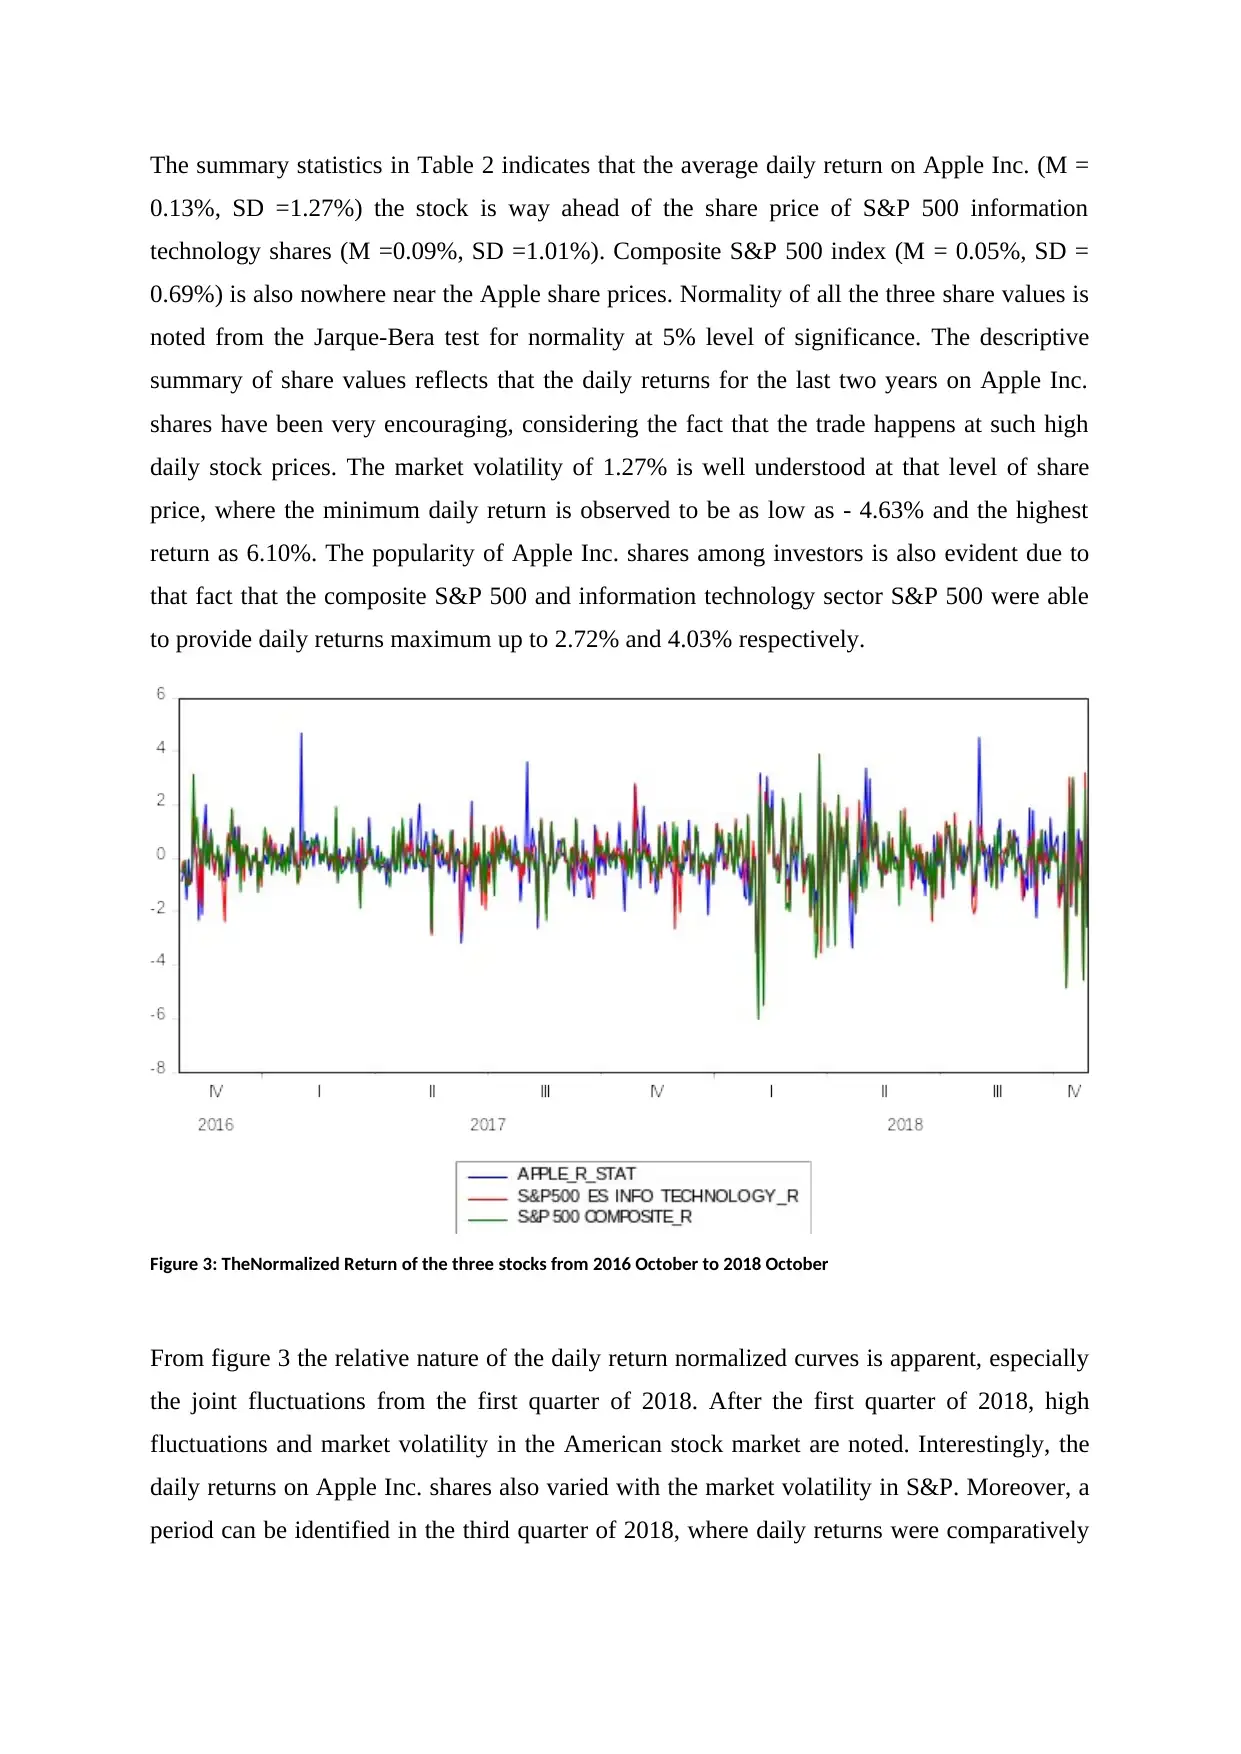
Figure 3: TheNormalized Return of the three stocks from 2016 October to 2018 October
From figure 3 the relative nature of the daily return normalized curves is apparent, especially
the joint fluctuations from the first quarter of 2018. After the first quarter of 2018, high
fluctuations and market volatility in the American stock market are noted. Interestingly, the
daily returns on Apple Inc. shares also varied with the market volatility in S&P. Moreover, a
period can be identified in the third quarter of 2018, where daily returns were comparatively
0.13%, SD =1.27%) the stock is way ahead of the share price of S&P 500 information
technology shares (M =0.09%, SD =1.01%). Composite S&P 500 index (M = 0.05%, SD =
0.69%) is also nowhere near the Apple share prices. Normality of all the three share values is
noted from the Jarque-Bera test for normality at 5% level of significance. The descriptive
summary of share values reflects that the daily returns for the last two years on Apple Inc.
shares have been very encouraging, considering the fact that the trade happens at such high
daily stock prices. The market volatility of 1.27% is well understood at that level of share
price, where the minimum daily return is observed to be as low as - 4.63% and the highest
return as 6.10%. The popularity of Apple Inc. shares among investors is also evident due to
that fact that the composite S&P 500 and information technology sector S&P 500 were able
to provide daily returns maximum up to 2.72% and 4.03% respectively.
Figure 3: TheNormalized Return of the three stocks from 2016 October to 2018 October
From figure 3 the relative nature of the daily return normalized curves is apparent, especially
the joint fluctuations from the first quarter of 2018. After the first quarter of 2018, high
fluctuations and market volatility in the American stock market are noted. Interestingly, the
daily returns on Apple Inc. shares also varied with the market volatility in S&P. Moreover, a
period can be identified in the third quarter of 2018, where daily returns were comparatively
⊘ This is a preview!⊘
Do you want full access?
Subscribe today to unlock all pages.
Trusted by 1+ million students worldwide
higher than market returns. At the last quarter of 2018, Apple stocks are noted to provide
better returns compared to highly volatile S&P 500 stocks,
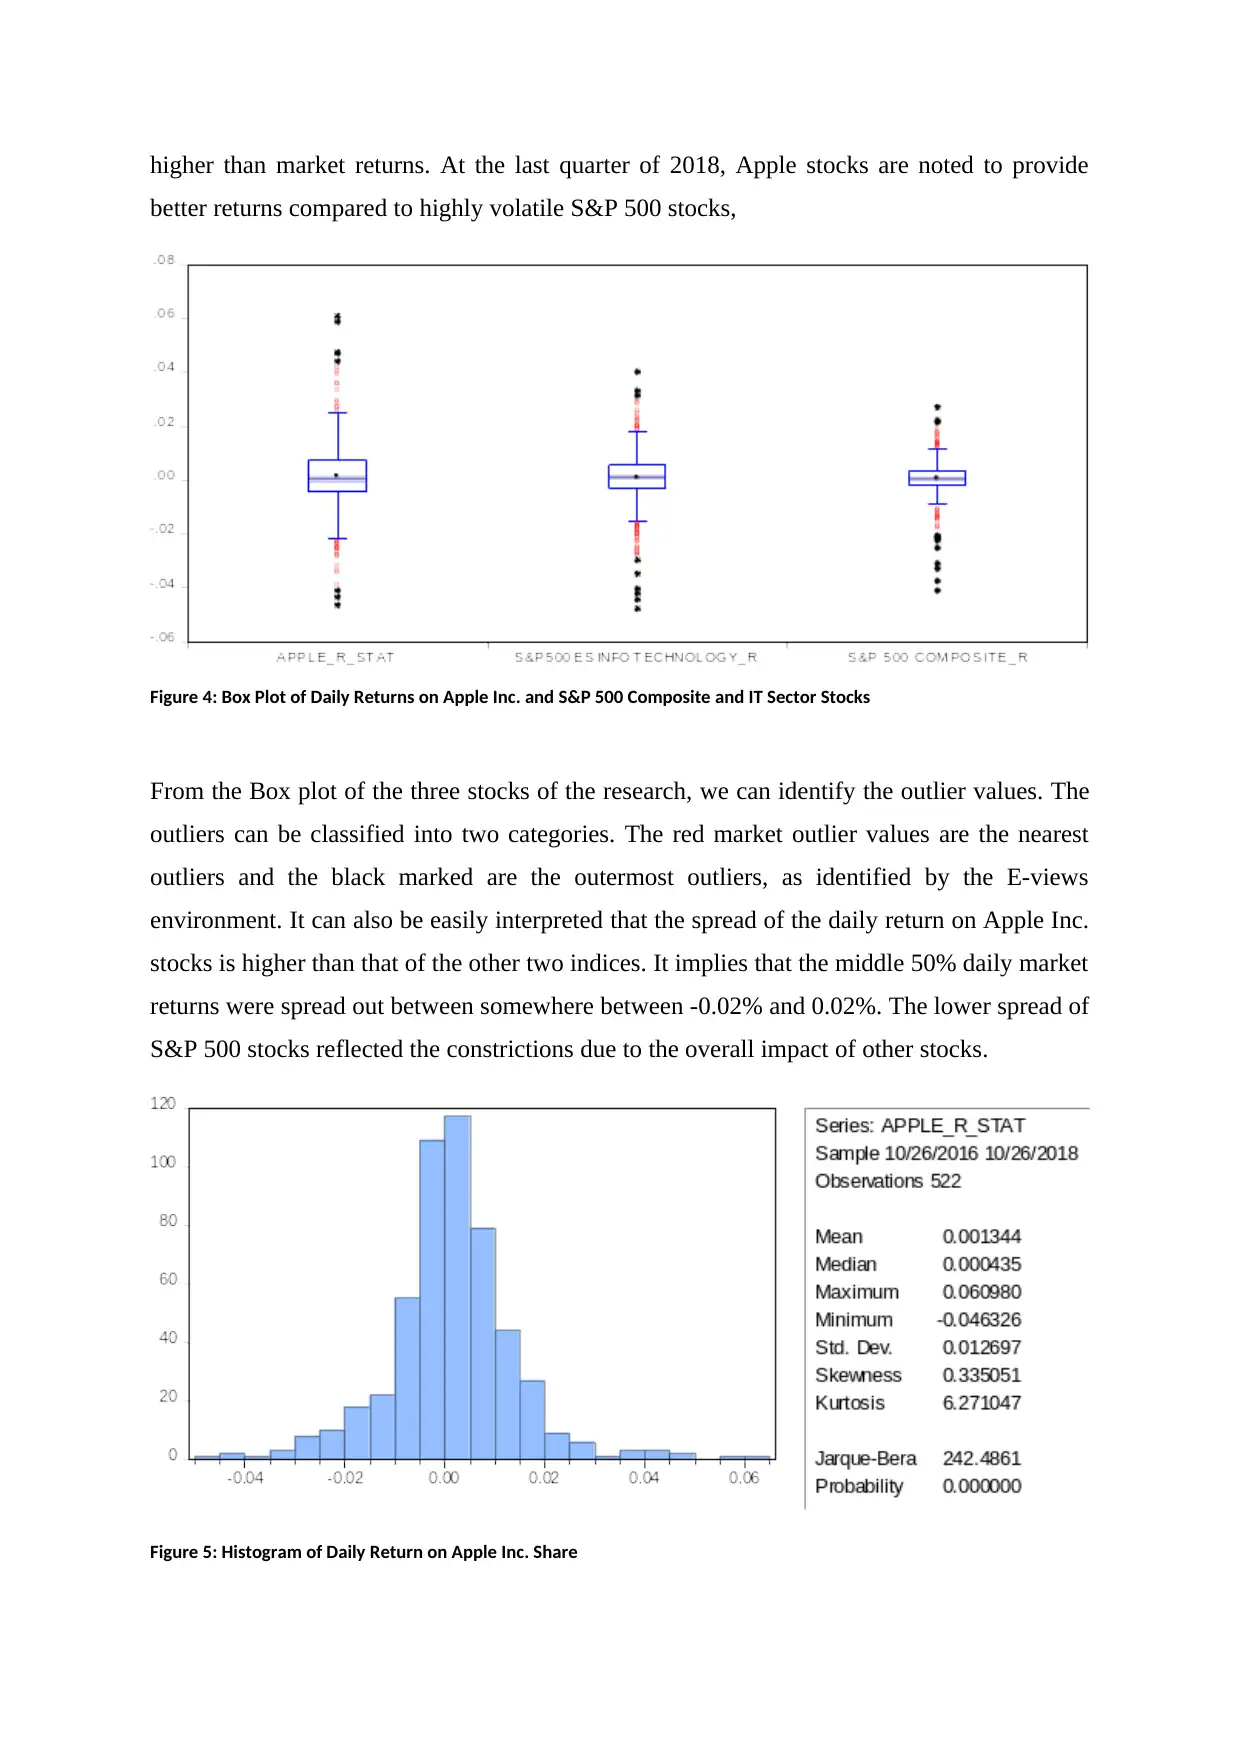
Figure 4: Box Plot of Daily Returns on Apple Inc. and S&P 500 Composite and IT Sector Stocks
From the Box plot of the three stocks of the research, we can identify the outlier values. The
outliers can be classified into two categories. The red market outlier values are the nearest
outliers and the black marked are the outermost outliers, as identified by the E-views
environment. It can also be easily interpreted that the spread of the daily return on Apple Inc.
stocks is higher than that of the other two indices. It implies that the middle 50% daily market
returns were spread out between somewhere between -0.02% and 0.02%. The lower spread of
S&P 500 stocks reflected the constrictions due to the overall impact of other stocks.
Figure 5: Histogram of Daily Return on Apple Inc. Share
better returns compared to highly volatile S&P 500 stocks,
Figure 4: Box Plot of Daily Returns on Apple Inc. and S&P 500 Composite and IT Sector Stocks
From the Box plot of the three stocks of the research, we can identify the outlier values. The
outliers can be classified into two categories. The red market outlier values are the nearest
outliers and the black marked are the outermost outliers, as identified by the E-views
environment. It can also be easily interpreted that the spread of the daily return on Apple Inc.
stocks is higher than that of the other two indices. It implies that the middle 50% daily market
returns were spread out between somewhere between -0.02% and 0.02%. The lower spread of
S&P 500 stocks reflected the constrictions due to the overall impact of other stocks.
Figure 5: Histogram of Daily Return on Apple Inc. Share
Paraphrase This Document
Need a fresh take? Get an instant paraphrase of this document with our AI Paraphraser
Simple Regression models
OLS Regression Model 1:
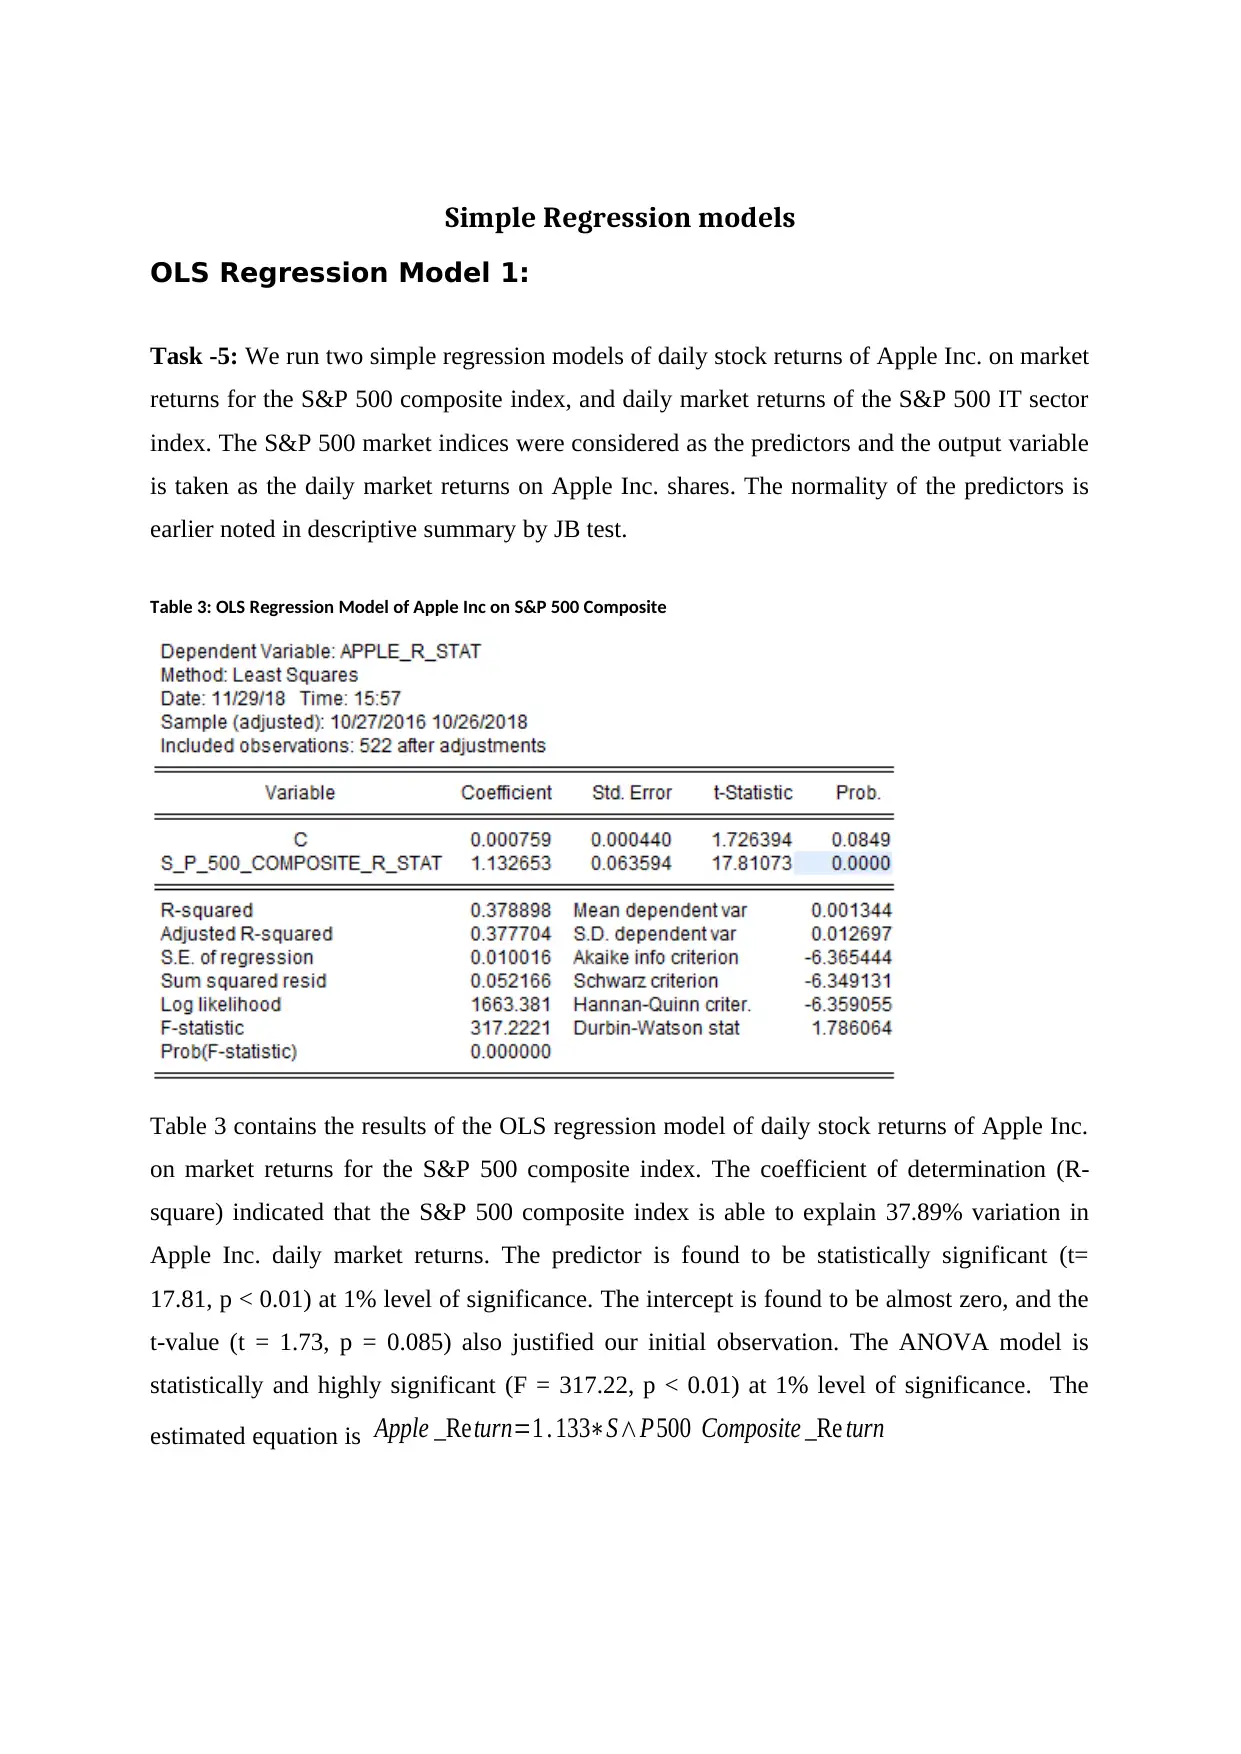
Task -5: We run two simple regression models of daily stock returns of Apple Inc. on market
returns for the S&P 500 composite index, and daily market returns of the S&P 500 IT sector
index. The S&P 500 market indices were considered as the predictors and the output variable
is taken as the daily market returns on Apple Inc. shares. The normality of the predictors is
earlier noted in descriptive summary by JB test.
Table 3: OLS Regression Model of Apple Inc on S&P 500 Composite
Table 3 contains the results of the OLS regression model of daily stock returns of Apple Inc.
on market returns for the S&P 500 composite index. The coefficient of determination (R-
square) indicated that the S&P 500 composite index is able to explain 37.89% variation in
Apple Inc. daily market returns. The predictor is found to be statistically significant (t=
17.81, p < 0.01) at 1% level of significance. The intercept is found to be almost zero, and the
t-value (t = 1.73, p = 0.085) also justified our initial observation. The ANOVA model is
statistically and highly significant (F = 317.22, p < 0.01) at 1% level of significance. The
estimated equation is Apple _Return=1 . 133∗S∧P500 Composite _Re turn
OLS Regression Model 1:
Task -5: We run two simple regression models of daily stock returns of Apple Inc. on market
returns for the S&P 500 composite index, and daily market returns of the S&P 500 IT sector
index. The S&P 500 market indices were considered as the predictors and the output variable
is taken as the daily market returns on Apple Inc. shares. The normality of the predictors is
earlier noted in descriptive summary by JB test.
Table 3: OLS Regression Model of Apple Inc on S&P 500 Composite
Table 3 contains the results of the OLS regression model of daily stock returns of Apple Inc.
on market returns for the S&P 500 composite index. The coefficient of determination (R-
square) indicated that the S&P 500 composite index is able to explain 37.89% variation in
Apple Inc. daily market returns. The predictor is found to be statistically significant (t=
17.81, p < 0.01) at 1% level of significance. The intercept is found to be almost zero, and the
t-value (t = 1.73, p = 0.085) also justified our initial observation. The ANOVA model is
statistically and highly significant (F = 317.22, p < 0.01) at 1% level of significance. The
estimated equation is Apple _Return=1 . 133∗S∧P500 Composite _Re turn
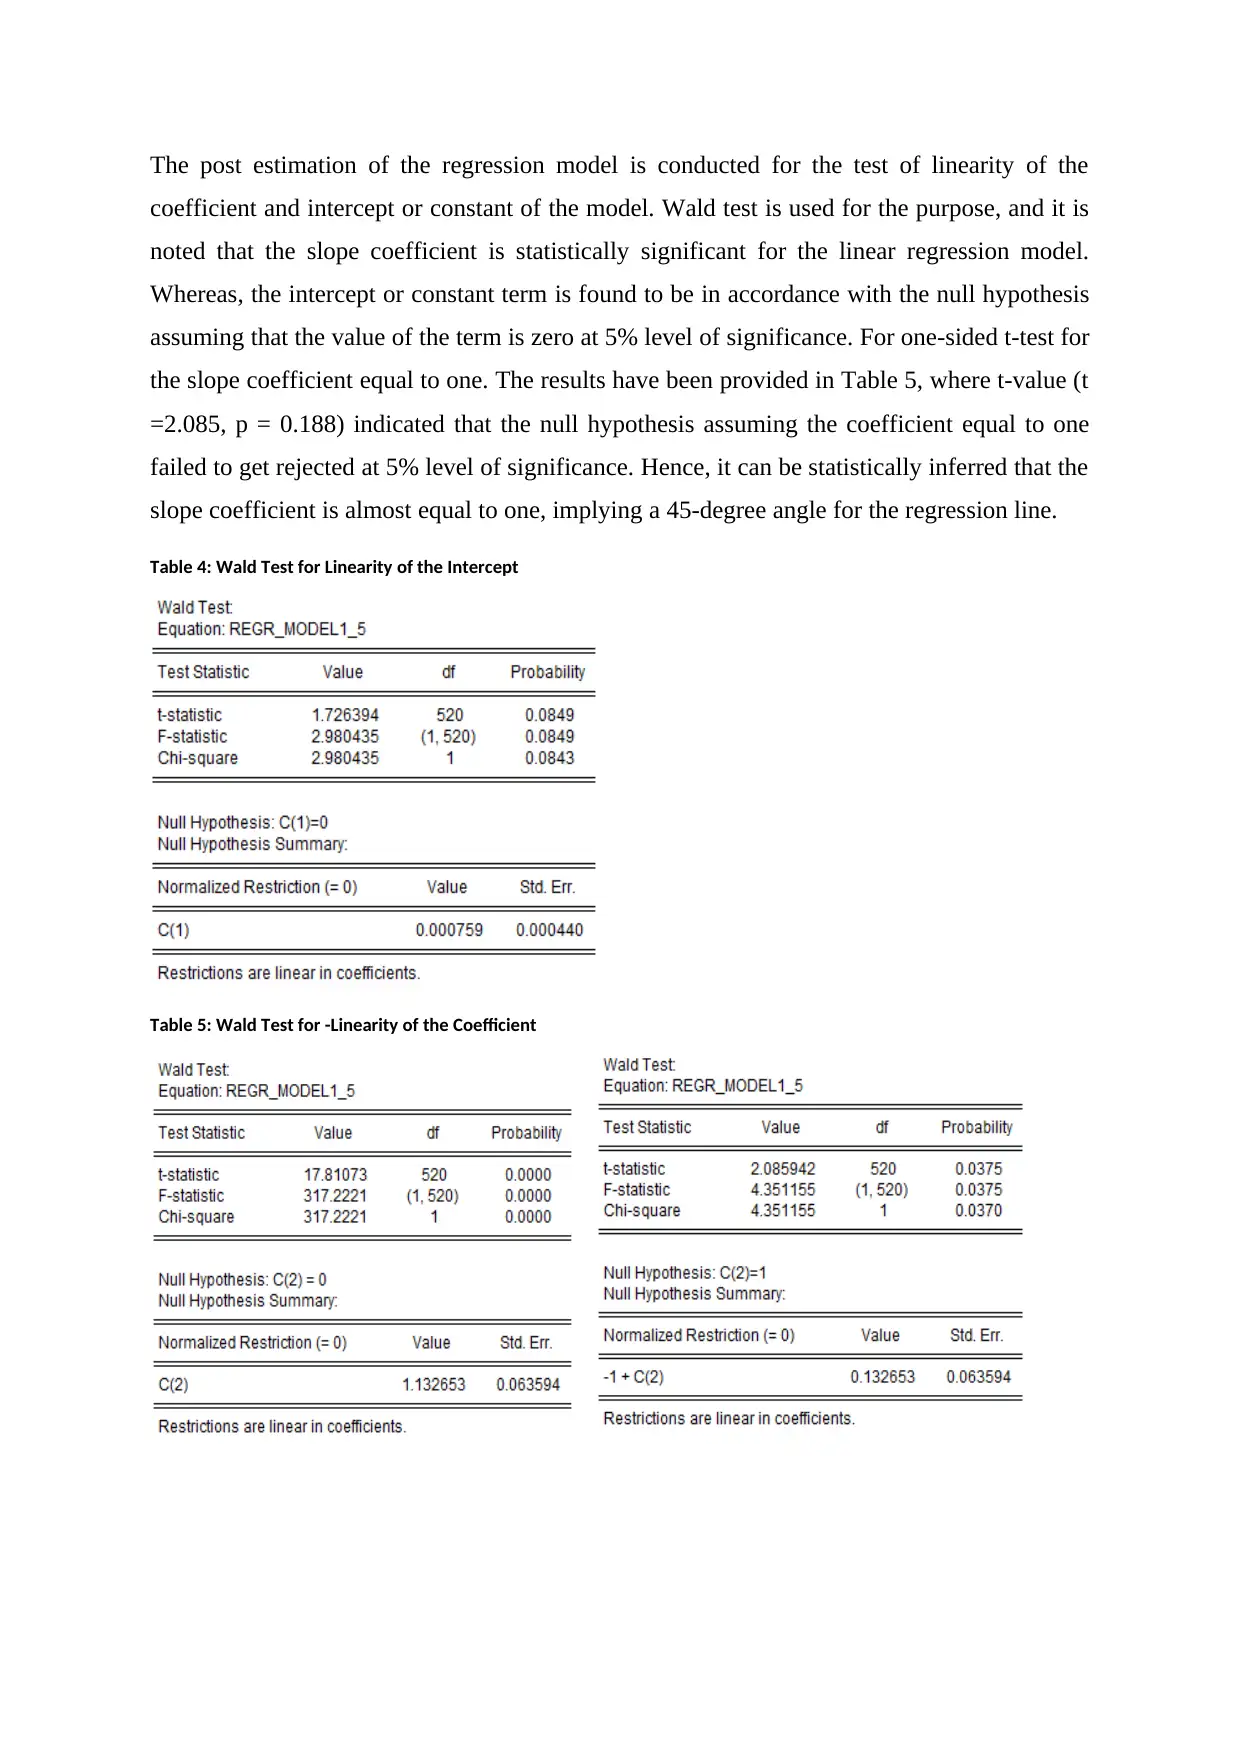
The post estimation of the regression model is conducted for the test of linearity of the
coefficient and intercept or constant of the model. Wald test is used for the purpose, and it is
noted that the slope coefficient is statistically significant for the linear regression model.
Whereas, the intercept or constant term is found to be in accordance with the null hypothesis
assuming that the value of the term is zero at 5% level of significance. For one-sided t-test for
the slope coefficient equal to one. The results have been provided in Table 5, where t-value (t
=2.085, p = 0.188) indicated that the null hypothesis assuming the coefficient equal to one
failed to get rejected at 5% level of significance. Hence, it can be statistically inferred that the
slope coefficient is almost equal to one, implying a 45-degree angle for the regression line.
Table 4: Wald Test for Linearity of the Intercept
Table 5: Wald Test for -Linearity of the Coefficient
⊘ This is a preview!⊘
Do you want full access?
Subscribe today to unlock all pages.
Trusted by 1+ million students worldwide
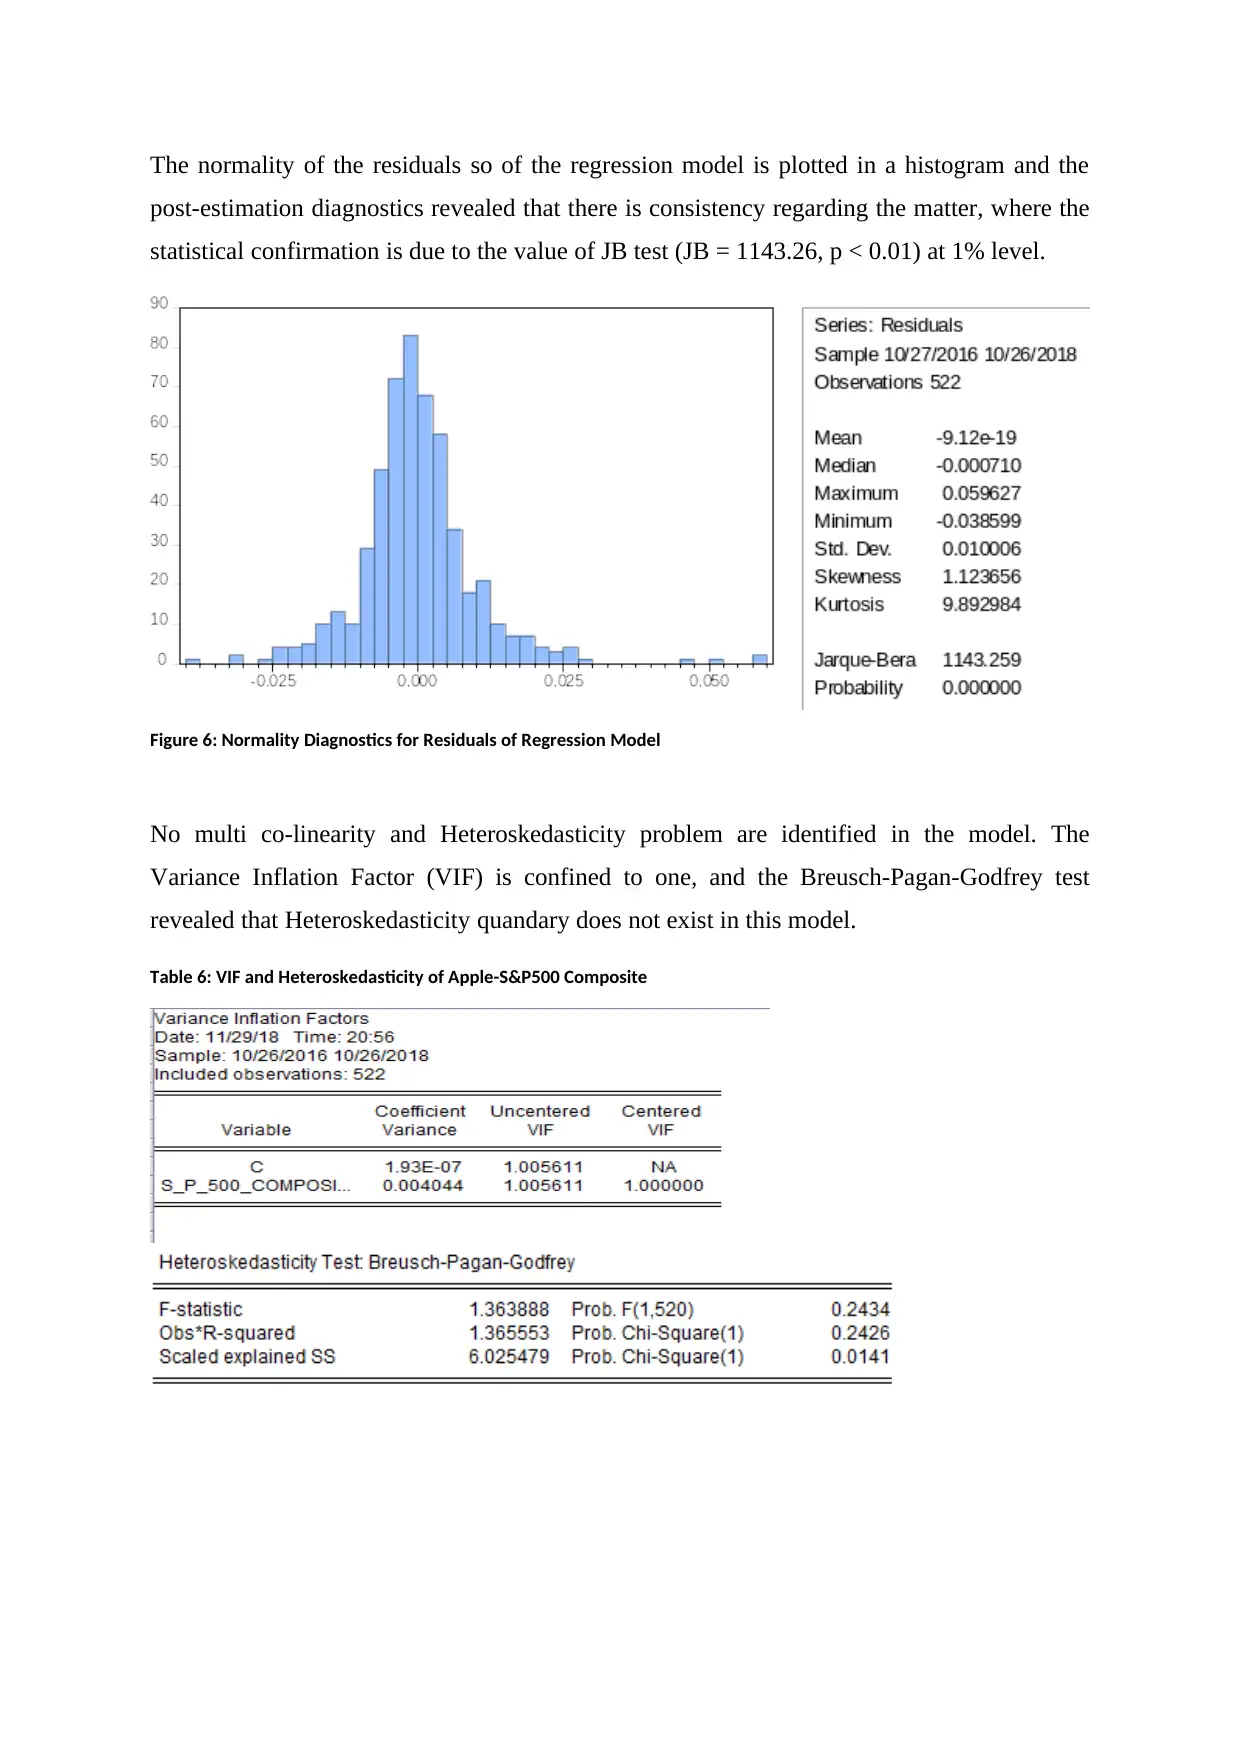
The normality of the residuals so of the regression model is plotted in a histogram and the
post-estimation diagnostics revealed that there is consistency regarding the matter, where the
statistical confirmation is due to the value of JB test (JB = 1143.26, p < 0.01) at 1% level.
Figure 6: Normality Diagnostics for Residuals of Regression Model
No multi co-linearity and Heteroskedasticity problem are identified in the model. The
Variance Inflation Factor (VIF) is confined to one, and the Breusch-Pagan-Godfrey test
revealed that Heteroskedasticity quandary does not exist in this model.
Table 6: VIF and Heteroskedasticity of Apple-S&P500 Composite
Paraphrase This Document
Need a fresh take? Get an instant paraphrase of this document with our AI Paraphraser
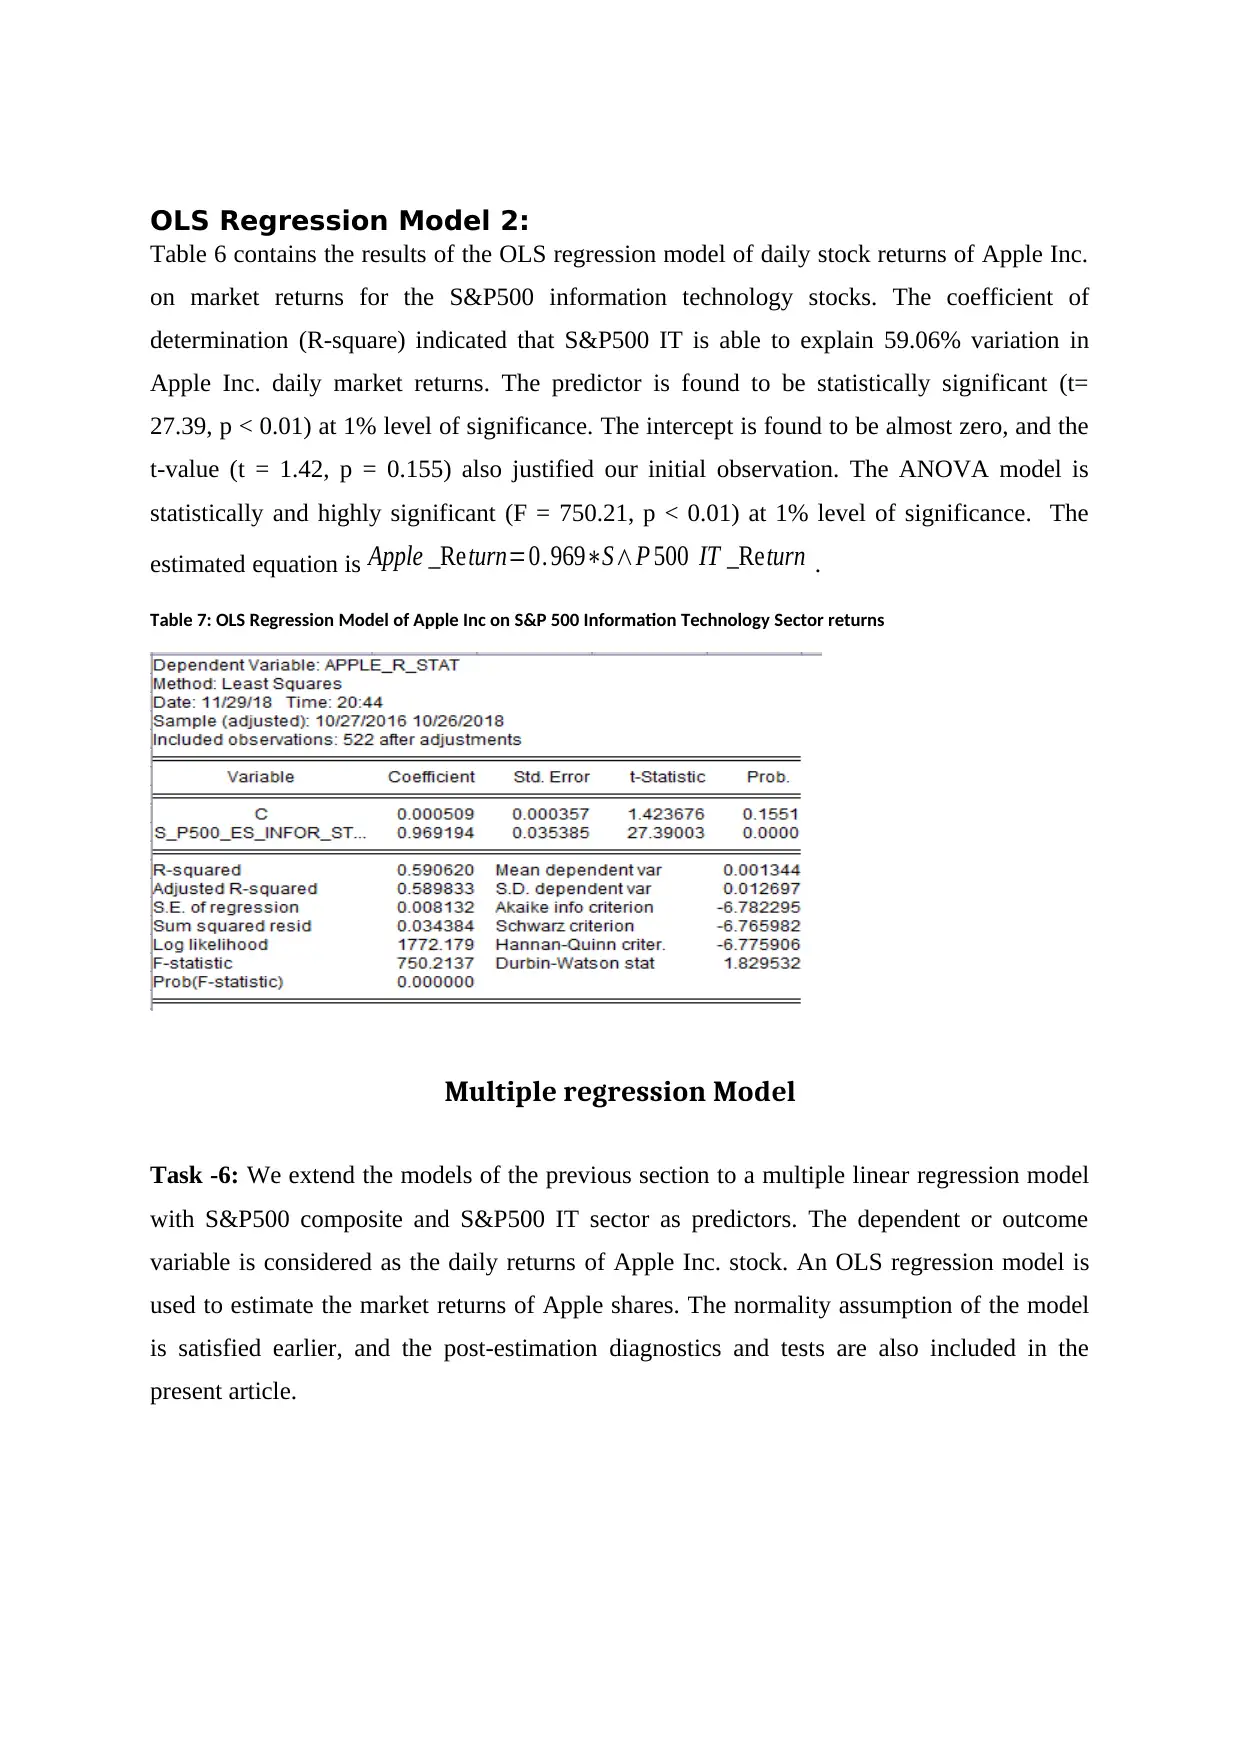
OLS Regression Model 2:
Table 6 contains the results of the OLS regression model of daily stock returns of Apple Inc.
on market returns for the S&P500 information technology stocks. The coefficient of
determination (R-square) indicated that S&P500 IT is able to explain 59.06% variation in
Apple Inc. daily market returns. The predictor is found to be statistically significant (t=
27.39, p < 0.01) at 1% level of significance. The intercept is found to be almost zero, and the
t-value (t = 1.42, p = 0.155) also justified our initial observation. The ANOVA model is
statistically and highly significant (F = 750.21, p < 0.01) at 1% level of significance. The
estimated equation is Apple _Return=0. 969∗S∧P 500 IT _Return .
Table 7: OLS Regression Model of Apple Inc on S&P 500 Information Technology Sector returns
Multiple regression Model
Task -6: We extend the models of the previous section to a multiple linear regression model
with S&P500 composite and S&P500 IT sector as predictors. The dependent or outcome
variable is considered as the daily returns of Apple Inc. stock. An OLS regression model is
used to estimate the market returns of Apple shares. The normality assumption of the model
is satisfied earlier, and the post-estimation diagnostics and tests are also included in the
present article.
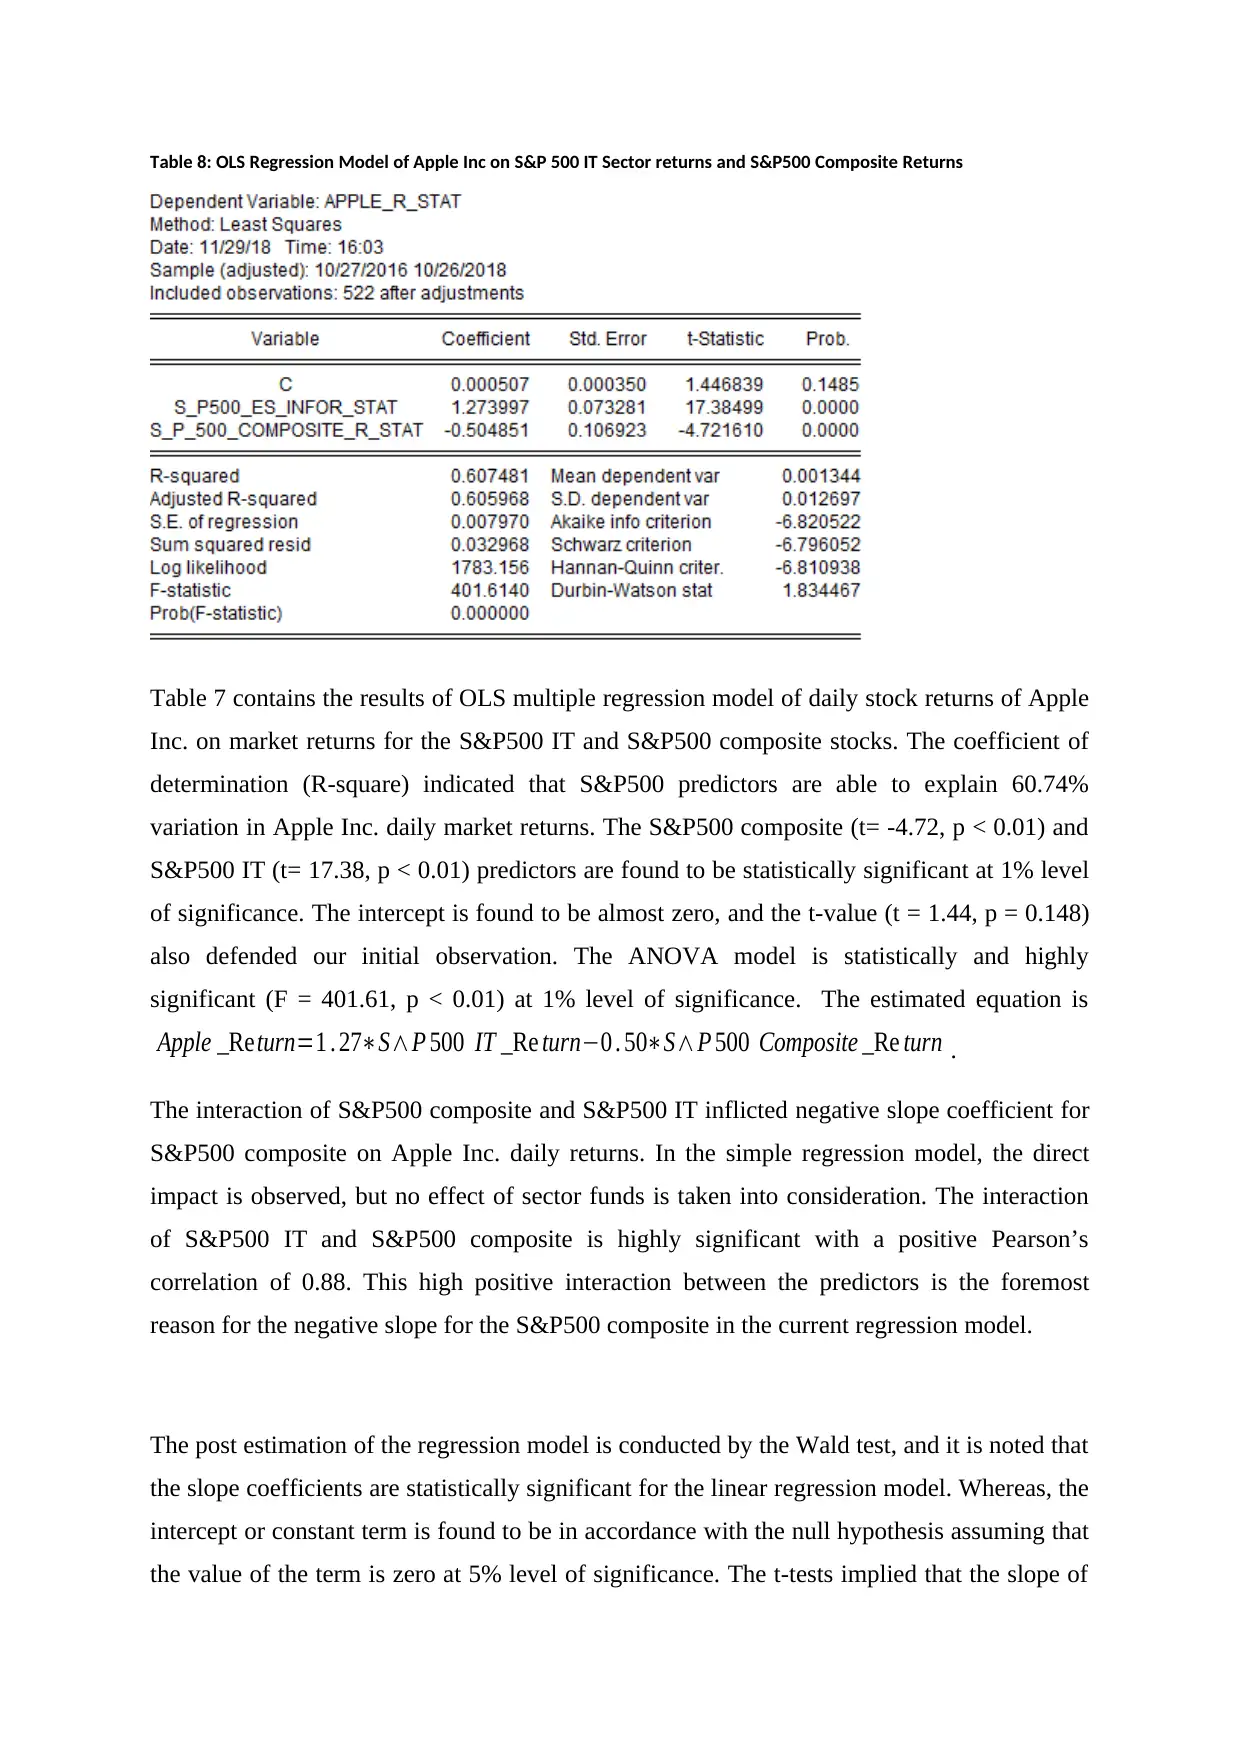
Table 8: OLS Regression Model of Apple Inc on S&P 500 IT Sector returns and S&P500 Composite Returns
Table 7 contains the results of OLS multiple regression model of daily stock returns of Apple
Inc. on market returns for the S&P500 IT and S&P500 composite stocks. The coefficient of
determination (R-square) indicated that S&P500 predictors are able to explain 60.74%
variation in Apple Inc. daily market returns. The S&P500 composite (t= -4.72, p < 0.01) and
S&P500 IT (t= 17.38, p < 0.01) predictors are found to be statistically significant at 1% level
of significance. The intercept is found to be almost zero, and the t-value (t = 1.44, p = 0.148)
also defended our initial observation. The ANOVA model is statistically and highly
significant (F = 401.61, p < 0.01) at 1% level of significance. The estimated equation is
Apple _Return=1 . 27∗S∧P 500 IT _Re turn−0 . 50∗S∧P 500 Composite _Re turn .
The interaction of S&P500 composite and S&P500 IT inflicted negative slope coefficient for
S&P500 composite on Apple Inc. daily returns. In the simple regression model, the direct
impact is observed, but no effect of sector funds is taken into consideration. The interaction
of S&P500 IT and S&P500 composite is highly significant with a positive Pearson’s
correlation of 0.88. This high positive interaction between the predictors is the foremost
reason for the negative slope for the S&P500 composite in the current regression model.
The post estimation of the regression model is conducted by the Wald test, and it is noted that
the slope coefficients are statistically significant for the linear regression model. Whereas, the
intercept or constant term is found to be in accordance with the null hypothesis assuming that
the value of the term is zero at 5% level of significance. The t-tests implied that the slope of
⊘ This is a preview!⊘
Do you want full access?
Subscribe today to unlock all pages.
Trusted by 1+ million students worldwide
1 out of 21
Related Documents


Your All-in-One AI-Powered Toolkit for Academic Success.
+13062052269
info@desklib.com
Available 24*7 on WhatsApp / Email
![[object Object]](/_next/static/media/star-bottom.7253800d.svg)
Unlock your academic potential
Copyright © 2020–2026 A2Z Services. All Rights Reserved. Developed and managed by ZUCOL.