HCS630 Final Project: Epidemiological Analysis and Risk Assessment
VerifiedAdded on 2021/04/17
|17
|1595
|87
Homework Assignment
AI Summary
This HCS630 final project analyzes various aspects of public health, including attack rates, morbidity and mortality measures, and diagnostic test validity and reliability. The assignment calculates and interprets incidence and prevalence rates, mortality rates, case fatality rates, and years of potential life lost (YPLL). It also examines sensitivity, specificity, predictive values, and likelihood ratios of diagnostic tests. Furthermore, the project addresses infant mortality rates and conducts risk assessments, calculating relative risk, odds ratios, attributable risk, and percentage of attributable risk. The analysis includes calculations and interpretations based on provided data, with references to relevant epidemiological literature.

Running head: HCS630 FINAL PROJECT
HCS630 Final Project
Name of Student
Name of University
Author Note
HCS630 Final Project
Name of Student
Name of University
Author Note
Paraphrase This Document
Need a fresh take? Get an instant paraphrase of this document with our AI Paraphraser

1HCS630 FINAL PROJECT
Table of Contents
Attack Rate.................................................................................................................................2
1..............................................................................................................................................2
2..............................................................................................................................................2
3..............................................................................................................................................3
4..............................................................................................................................................3
5..............................................................................................................................................3
Morbidity Measures...................................................................................................................4
1..............................................................................................................................................4
2..............................................................................................................................................4
1..............................................................................................................................................5
2..............................................................................................................................................5
3..............................................................................................................................................6
4..............................................................................................................................................6
5..............................................................................................................................................6
YPLL..........................................................................................................................................6
1..............................................................................................................................................6
2..............................................................................................................................................7
Diagnostic and Screening Tests: Validity and Reliability.........................................................7
1..............................................................................................................................................9
2..............................................................................................................................................9
3..............................................................................................................................................9

2HCS630 FINAL PROJECT
4..............................................................................................................................................9
5..............................................................................................................................................9
6..............................................................................................................................................9
Infant Mortality Rates in US in 2011.........................................................................................9
1............................................................................................................................................10
2............................................................................................................................................10
3............................................................................................................................................10
Risk Assessment.......................................................................................................................11
Step 1: Relative risk.............................................................................................................12
1........................................................................................................................................12
Step 2: Odds Ratio...............................................................................................................12
1........................................................................................................................................12
2........................................................................................................................................13
Step 3: Attributable Risk, Percentage of Attributable Risk.................................................13
1........................................................................................................................................13
2........................................................................................................................................13
References................................................................................................................................14
⊘ This is a preview!⊘
Do you want full access?
Subscribe today to unlock all pages.
Trusted by 1+ million students worldwide
3HCS630 FINAL PROJECT
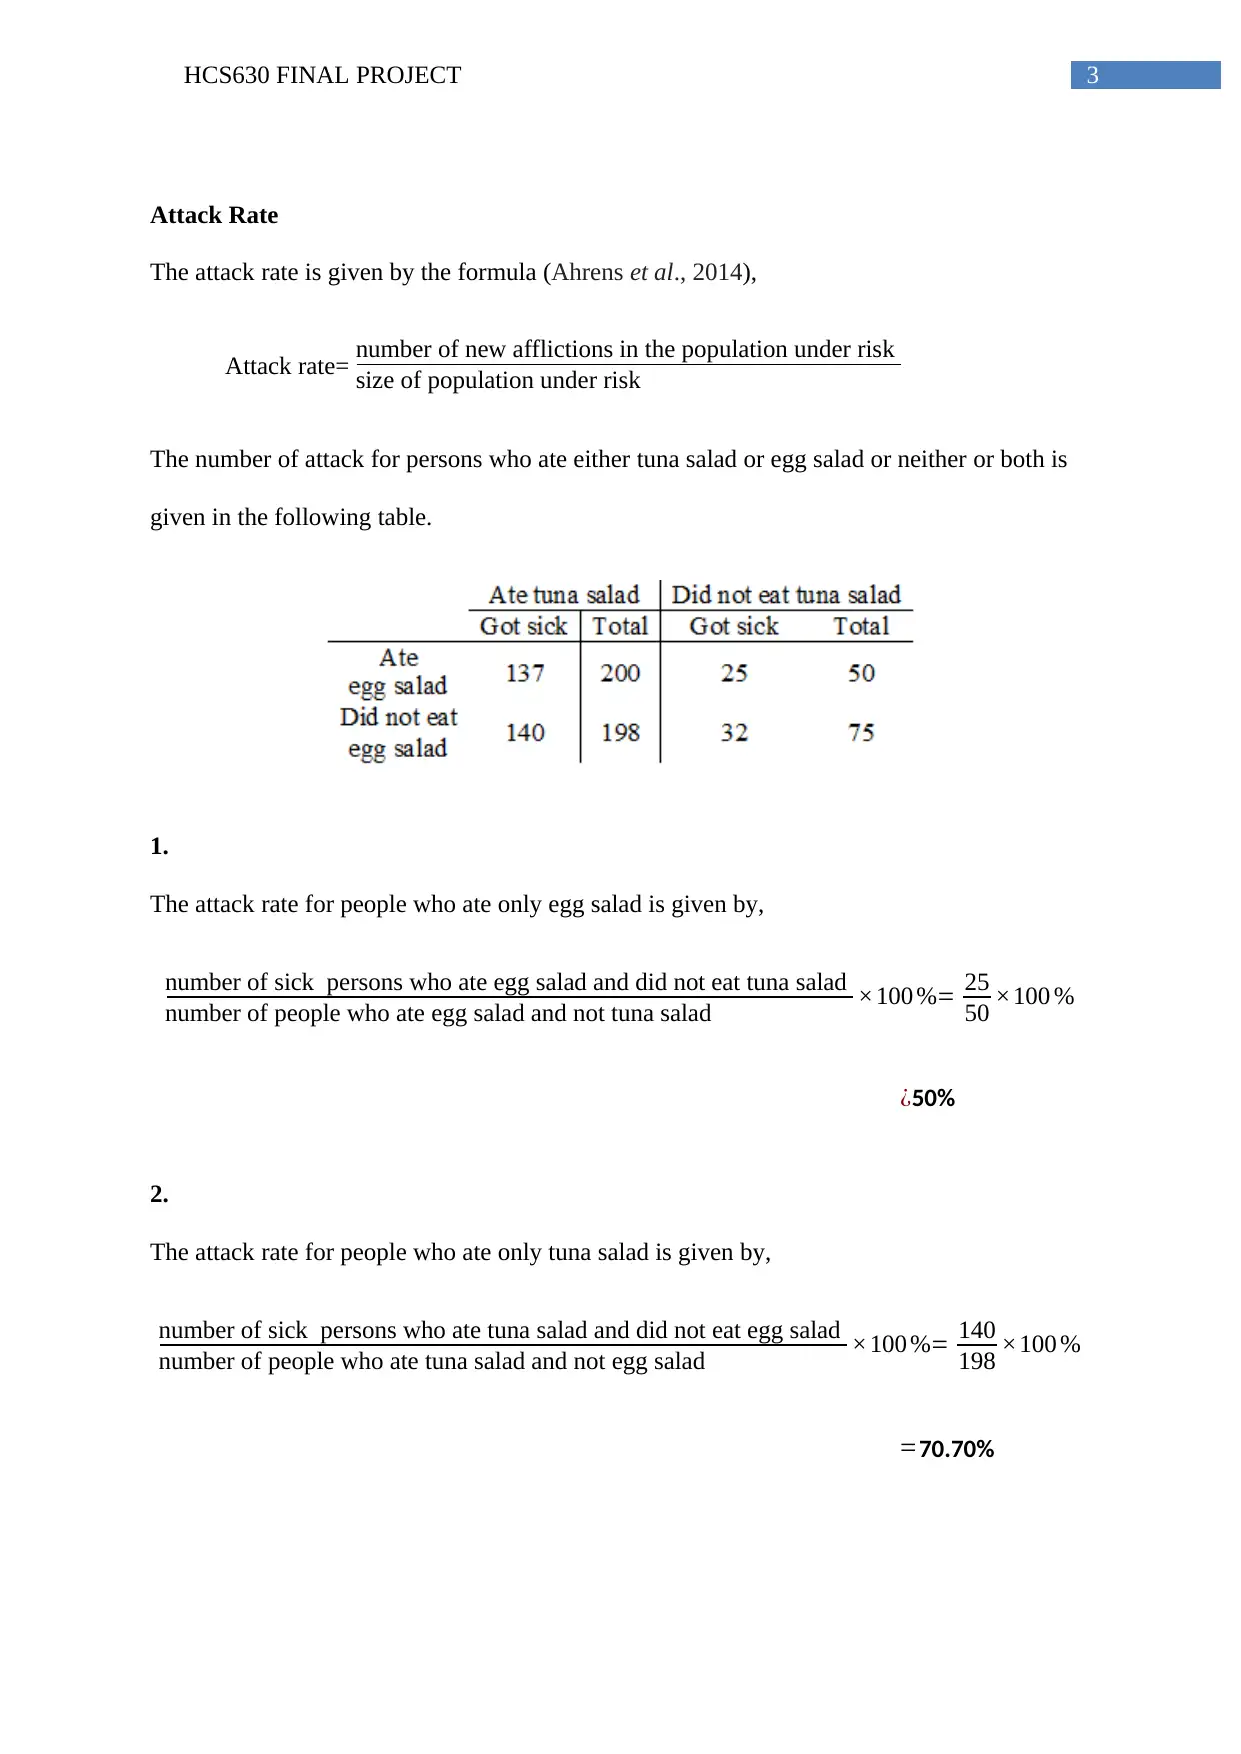
Attack Rate
The attack rate is given by the formula (Ahrens et al., 2014),
Attack rate= number of new afflictions in the population under risk
size of population under risk
The number of attack for persons who ate either tuna salad or egg salad or neither or both is
given in the following table.
1.
The attack rate for people who ate only egg salad is given by,
number of sick persons who ate egg salad and did not eat tuna salad
number of people who ate egg salad and not tuna salad ×100 %= 25
50 ×100 %
¿50%
2.
The attack rate for people who ate only tuna salad is given by,
number of sick persons who ate tuna salad and did not eat egg salad
number of people who ate tuna salad and not egg salad ×100 %= 140
198 ×100 %
=70.70%
Paraphrase This Document
Need a fresh take? Get an instant paraphrase of this document with our AI Paraphraser

4HCS630 FINAL PROJECT
3.
The attack rate for people who ate both egg salad and tuna salad is given by,
number of sick persons who ate tuna salad and also egg salad
number of people who ate tuna salad and also egg salad ×100 %=¿ 137
200 ×100 %
¿68.50%
4.
The attack rate for people who ate neither egg salad nor tuna salad is given by,
number of sick persons who ate neither tuna salad nor egg salad
number of people who ate neither tuna salad nor egg salad ×100 %= 32
75 ×100 %
¿42.667%
5.
The above results show that person who ate tuna salad only has the highest rate of
attack, followed by persons who ate both tuna salad and egg salad. The rates of attack for
persons who ate only egg salad or no salad at all are found to be lower than people who had
tuna salad. Therefore it is inferred that tuna salad is most likely to be infected for being the
common exposure between the two highest rates.
Morbidity Measures
The incidence rate of a disease is defined as (Ahrens et al., 2014),
Incidence rate per 100000= number of new cases of disease
number of people at risk of the disease in the time frame ×10000
0
The prevalence rate of a disease is defined as (Ahrens et al., 2014),
5HCS630 FINAL PROJECT
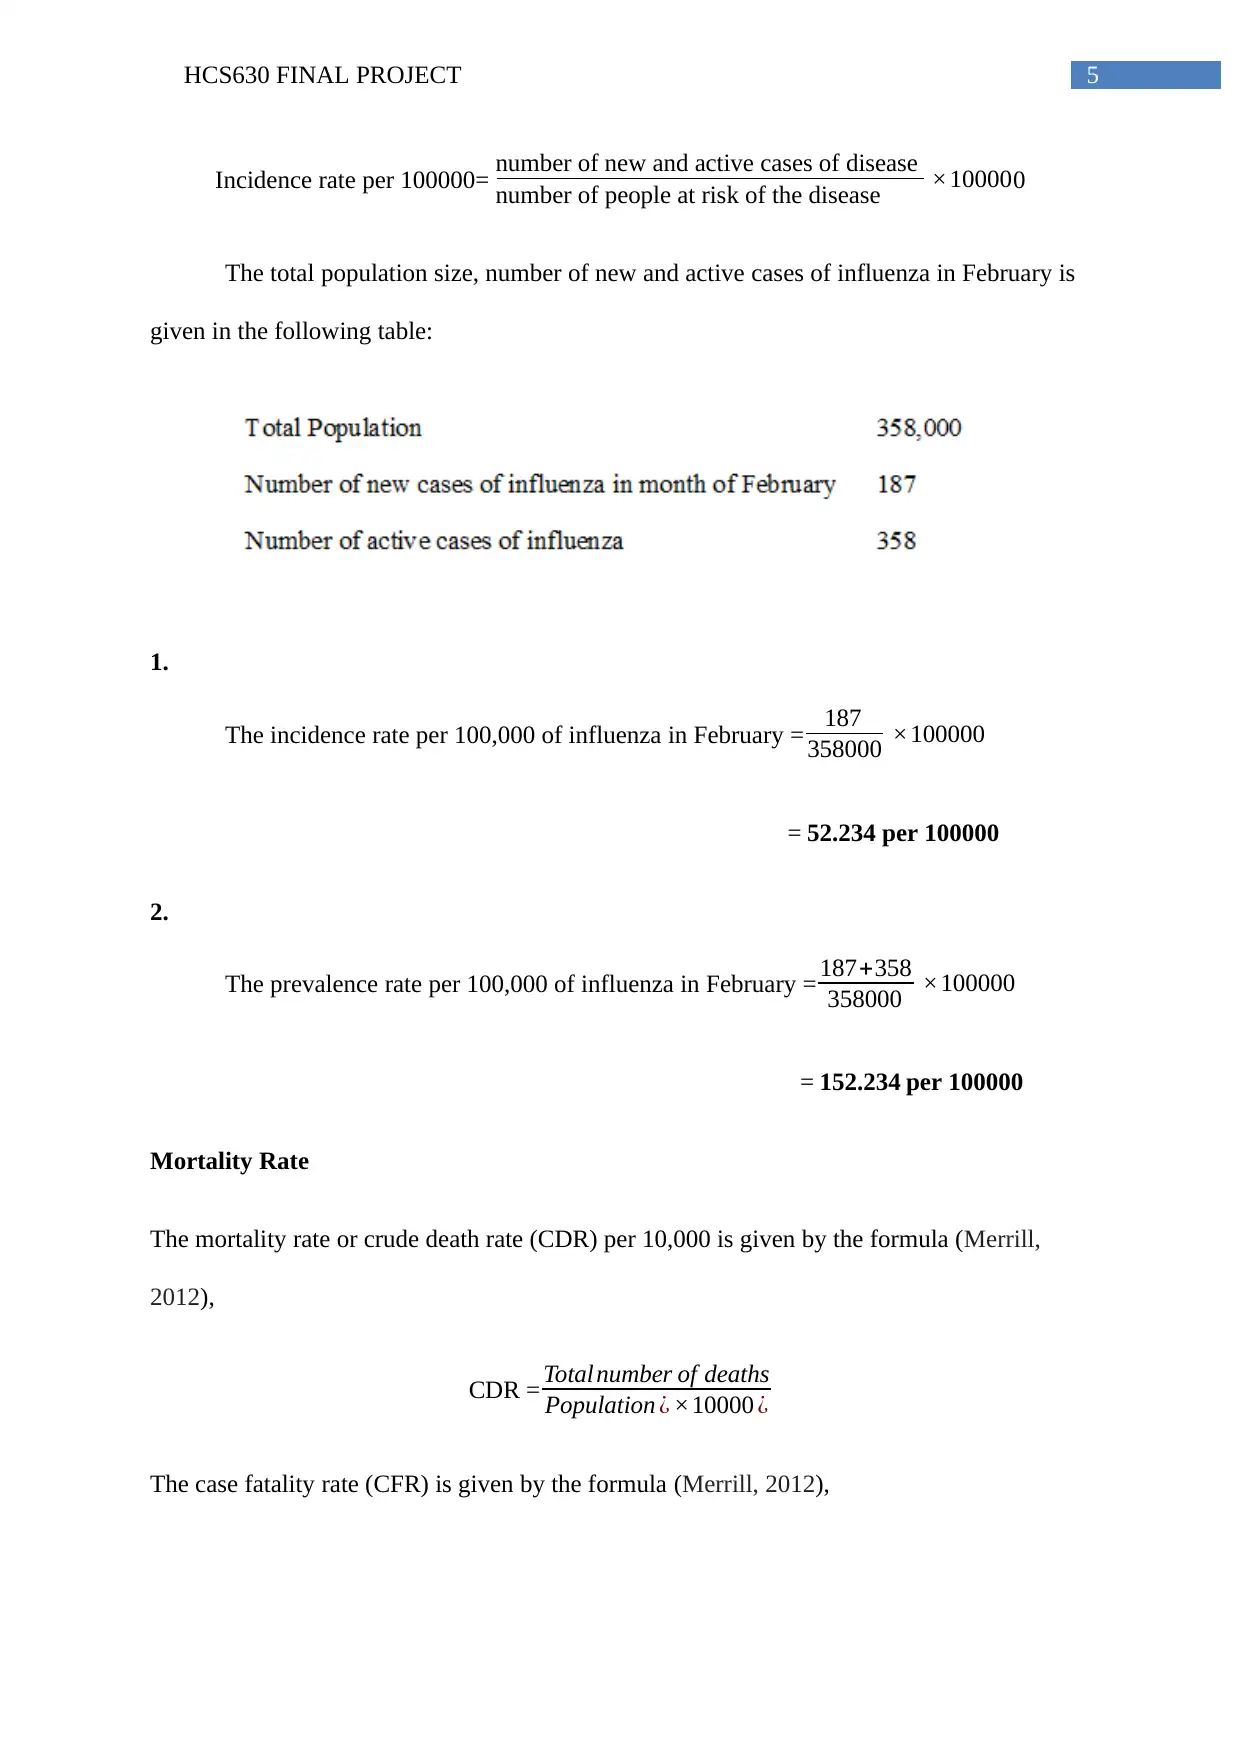
Incidence rate per 100000= number of new and active cases of disease
number of people at risk of the disease ×100000
The total population size, number of new and active cases of influenza in February is
given in the following table:
1.
The incidence rate per 100,000 of influenza in February = 187
358000 ×100000
= 52.234 per 100000
2.
The prevalence rate per 100,000 of influenza in February = 187+358
358000 ×100000
= 152.234 per 100000
Mortality Rate
The mortality rate or crude death rate (CDR) per 10,000 is given by the formula (Merrill,
2012),
CDR = Total number of deaths
Population ¿ ×10000 ¿
The case fatality rate (CFR) is given by the formula (Merrill, 2012),
⊘ This is a preview!⊘
Do you want full access?
Subscribe today to unlock all pages.
Trusted by 1+ million students worldwide
6HCS630 FINAL PROJECT
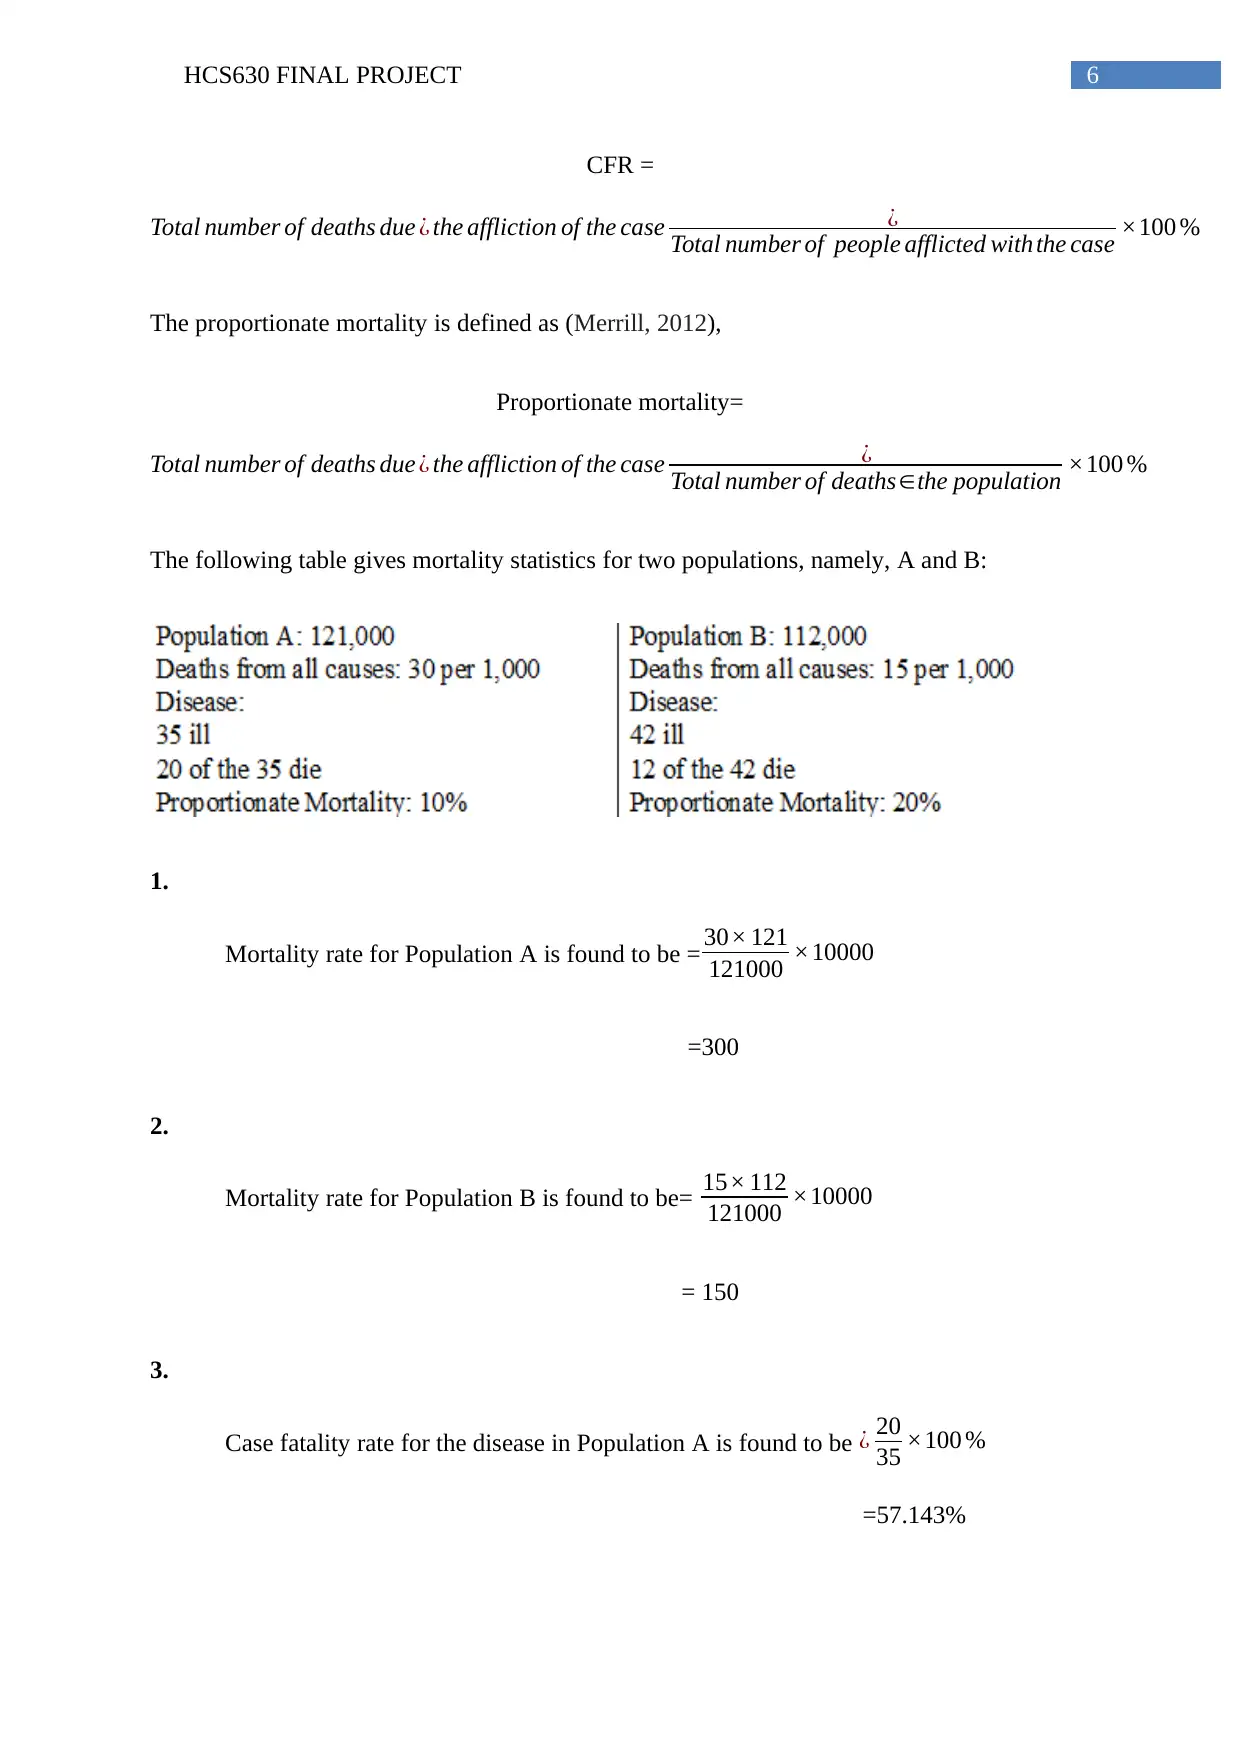
CFR =
Total number of deaths due ¿ the affliction of the case ¿
Total number of people afflicted with the case ×100 %
The proportionate mortality is defined as (Merrill, 2012),
Proportionate mortality=
Total number of deaths due ¿ the affliction of the case ¿
Total number of deaths∈the population ×100 %
The following table gives mortality statistics for two populations, namely, A and B:
1.
Mortality rate for Population A is found to be = 30× 121
121000 ×10000
=300
2.
Mortality rate for Population B is found to be= 15× 112
121000 ×10000
= 150
3.
Case fatality rate for the disease in Population A is found to be ¿ 20
35 ×100 %
=57.143%
Paraphrase This Document
Need a fresh take? Get an instant paraphrase of this document with our AI Paraphraser
7HCS630 FINAL PROJECT
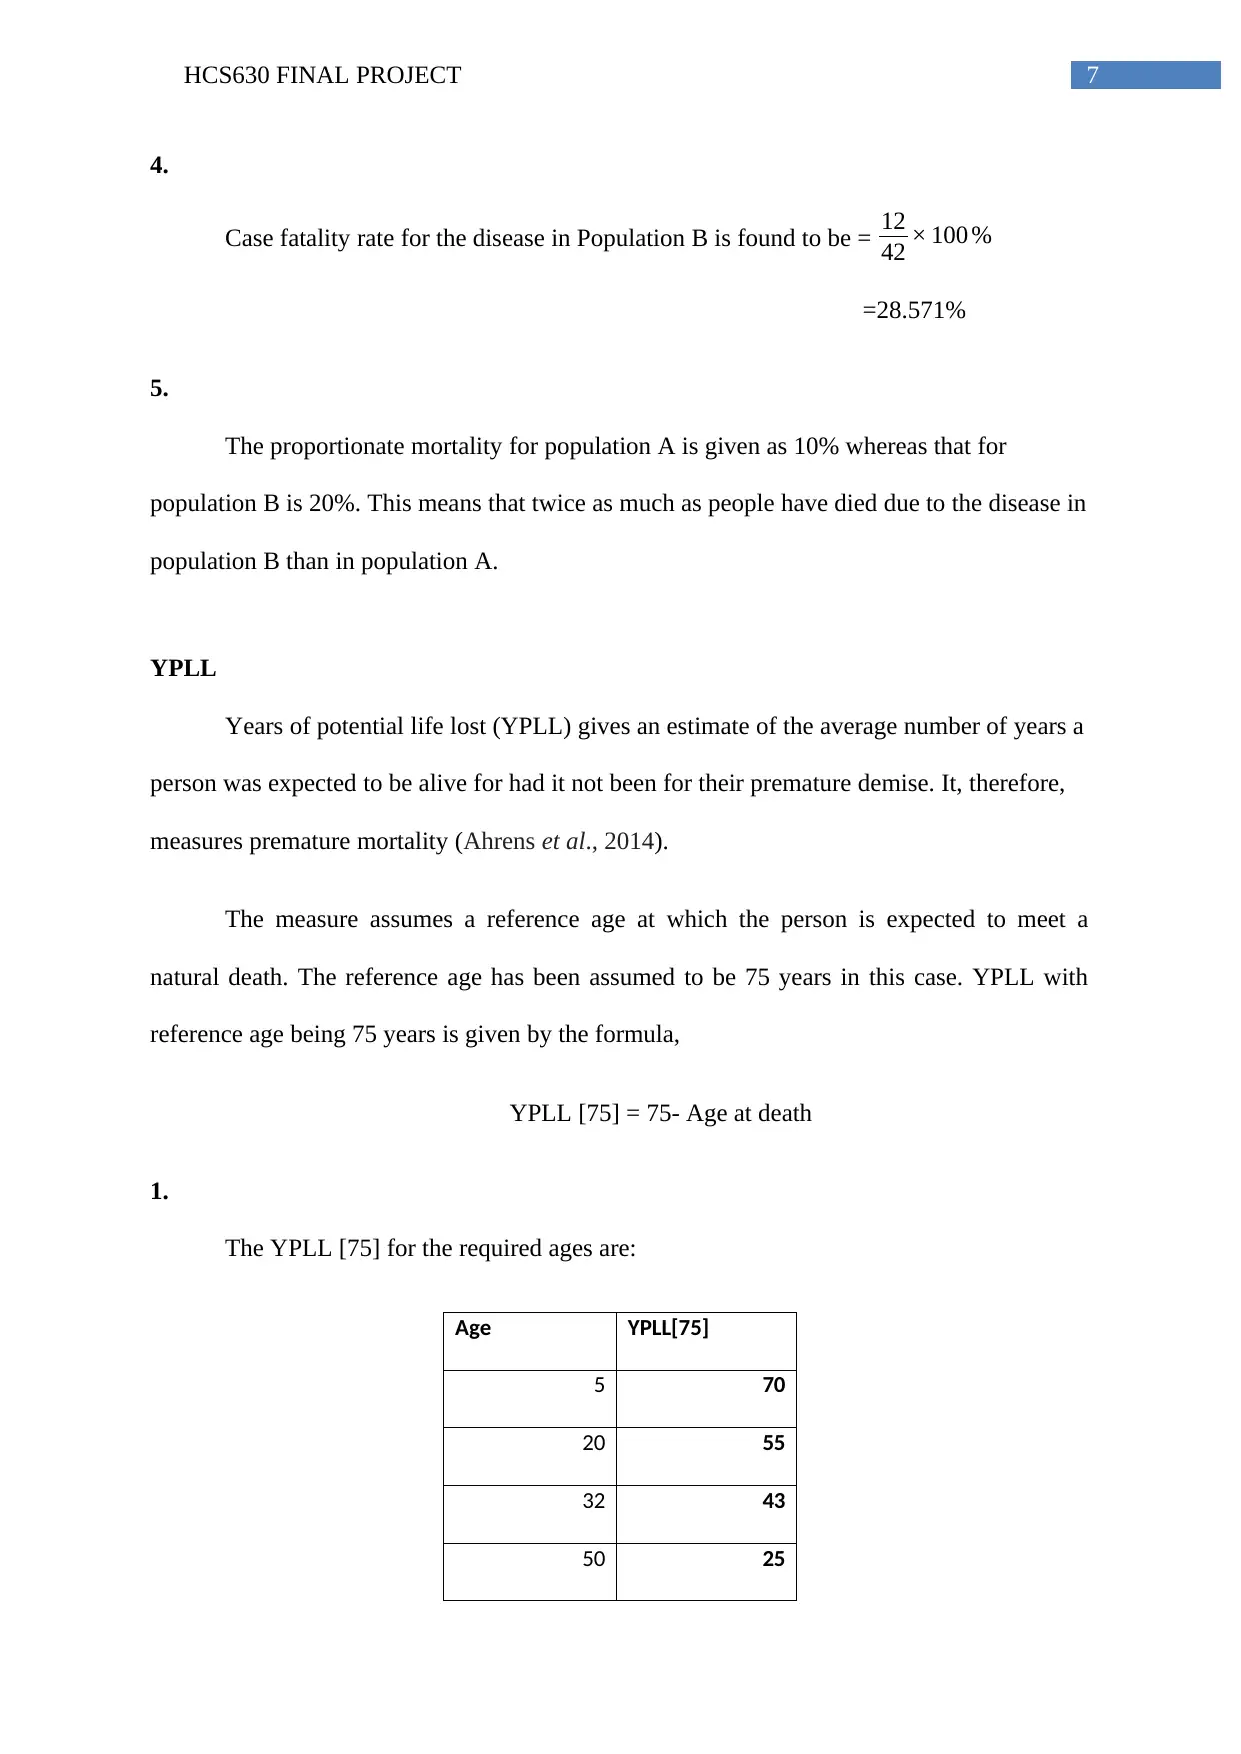
4.
Case fatality rate for the disease in Population B is found to be = 12
42 × 100 %
=28.571%
5.
The proportionate mortality for population A is given as 10% whereas that for
population B is 20%. This means that twice as much as people have died due to the disease in
population B than in population A.
YPLL
Years of potential life lost (YPLL) gives an estimate of the average number of years a
person was expected to be alive for had it not been for their premature demise. It, therefore,
measures premature mortality (Ahrens et al., 2014).
The measure assumes a reference age at which the person is expected to meet a
natural death. The reference age has been assumed to be 75 years in this case. YPLL with
reference age being 75 years is given by the formula,
YPLL [75] = 75- Age at death
1.
The YPLL [75] for the required ages are:
Age YPLL[75]
5 70
20 55
32 43
50 25
8HCS630 FINAL PROJECT
64 11
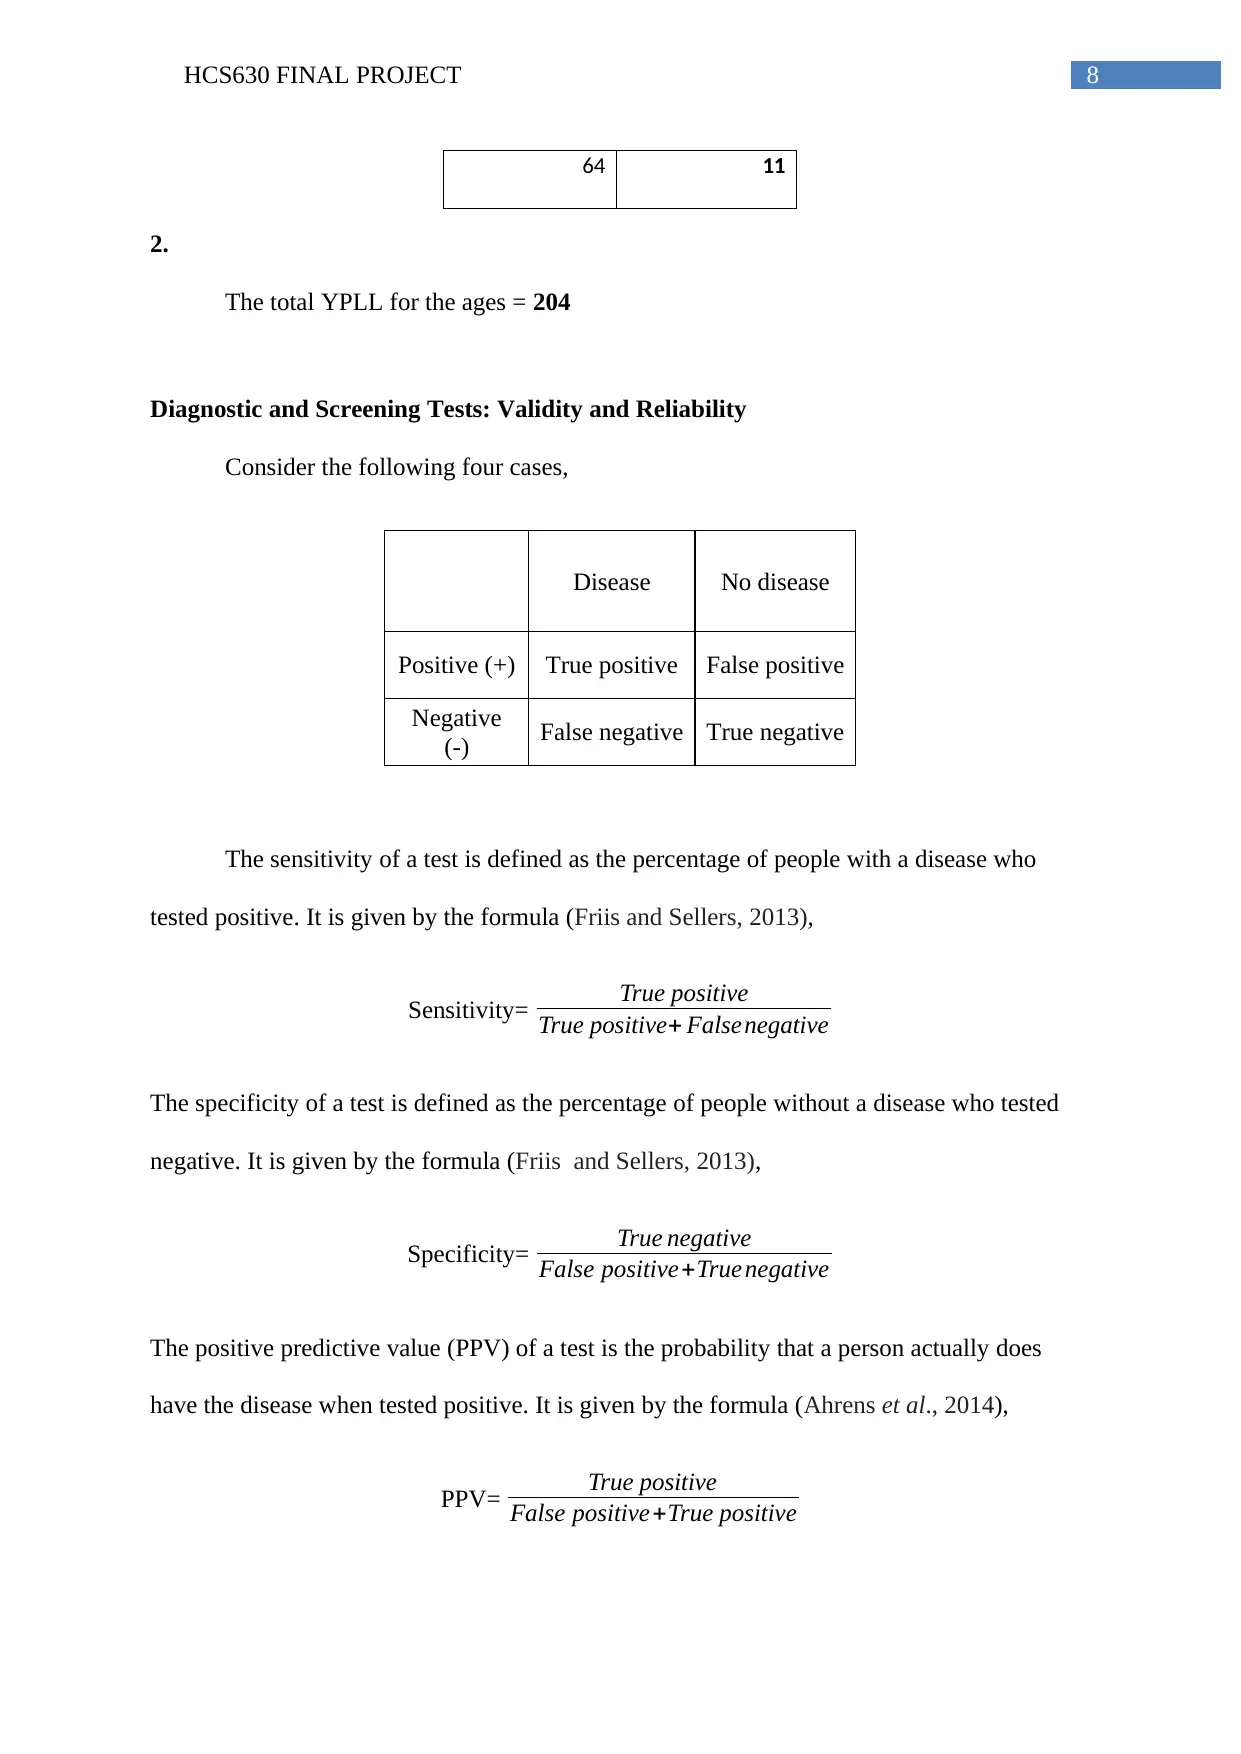
2.
The total YPLL for the ages = 204
Diagnostic and Screening Tests: Validity and Reliability
Consider the following four cases,
Disease No disease
Positive (+) True positive False positive
Negative
(-) False negative True negative
The sensitivity of a test is defined as the percentage of people with a disease who
tested positive. It is given by the formula (Friis and Sellers, 2013),
Sensitivity= True positive
True positive+ Falsenegative
The specificity of a test is defined as the percentage of people without a disease who tested
negative. It is given by the formula (Friis and Sellers, 2013),
Specificity= True negative
False positive+True negative
The positive predictive value (PPV) of a test is the probability that a person actually does
have the disease when tested positive. It is given by the formula (Ahrens et al., 2014),
PPV= True positive
False positive+True positive
64 11
2.
The total YPLL for the ages = 204
Diagnostic and Screening Tests: Validity and Reliability
Consider the following four cases,
Disease No disease
Positive (+) True positive False positive
Negative
(-) False negative True negative
The sensitivity of a test is defined as the percentage of people with a disease who
tested positive. It is given by the formula (Friis and Sellers, 2013),
Sensitivity= True positive
True positive+ Falsenegative
The specificity of a test is defined as the percentage of people without a disease who tested
negative. It is given by the formula (Friis and Sellers, 2013),
Specificity= True negative
False positive+True negative
The positive predictive value (PPV) of a test is the probability that a person actually does
have the disease when tested positive. It is given by the formula (Ahrens et al., 2014),
PPV= True positive
False positive+True positive
⊘ This is a preview!⊘
Do you want full access?
Subscribe today to unlock all pages.
Trusted by 1+ million students worldwide
9HCS630 FINAL PROJECT
The negative predictive value (NPV) of a test is the probability that a person does not actually
have the disease when tested negative. It is given by the formula (Ahrens et al., 2014),
NPV= True negative
False negative+ Truenegative
The positive likelihood ratio is given by the formula (Friis and Sellers, 2013),
LR+ = probability of positivetest ∈ patients withdisease
probability of positive test ∈ patients without disease
= sensitivity
1−specificity
The negative likelihood ratio is given by the formula (Friis and Sellers, 2013),
LR- = probability of negative test ∈ patients withdisease
probability of negative test ∈ patients without disease
=1−sensitivity
specificity
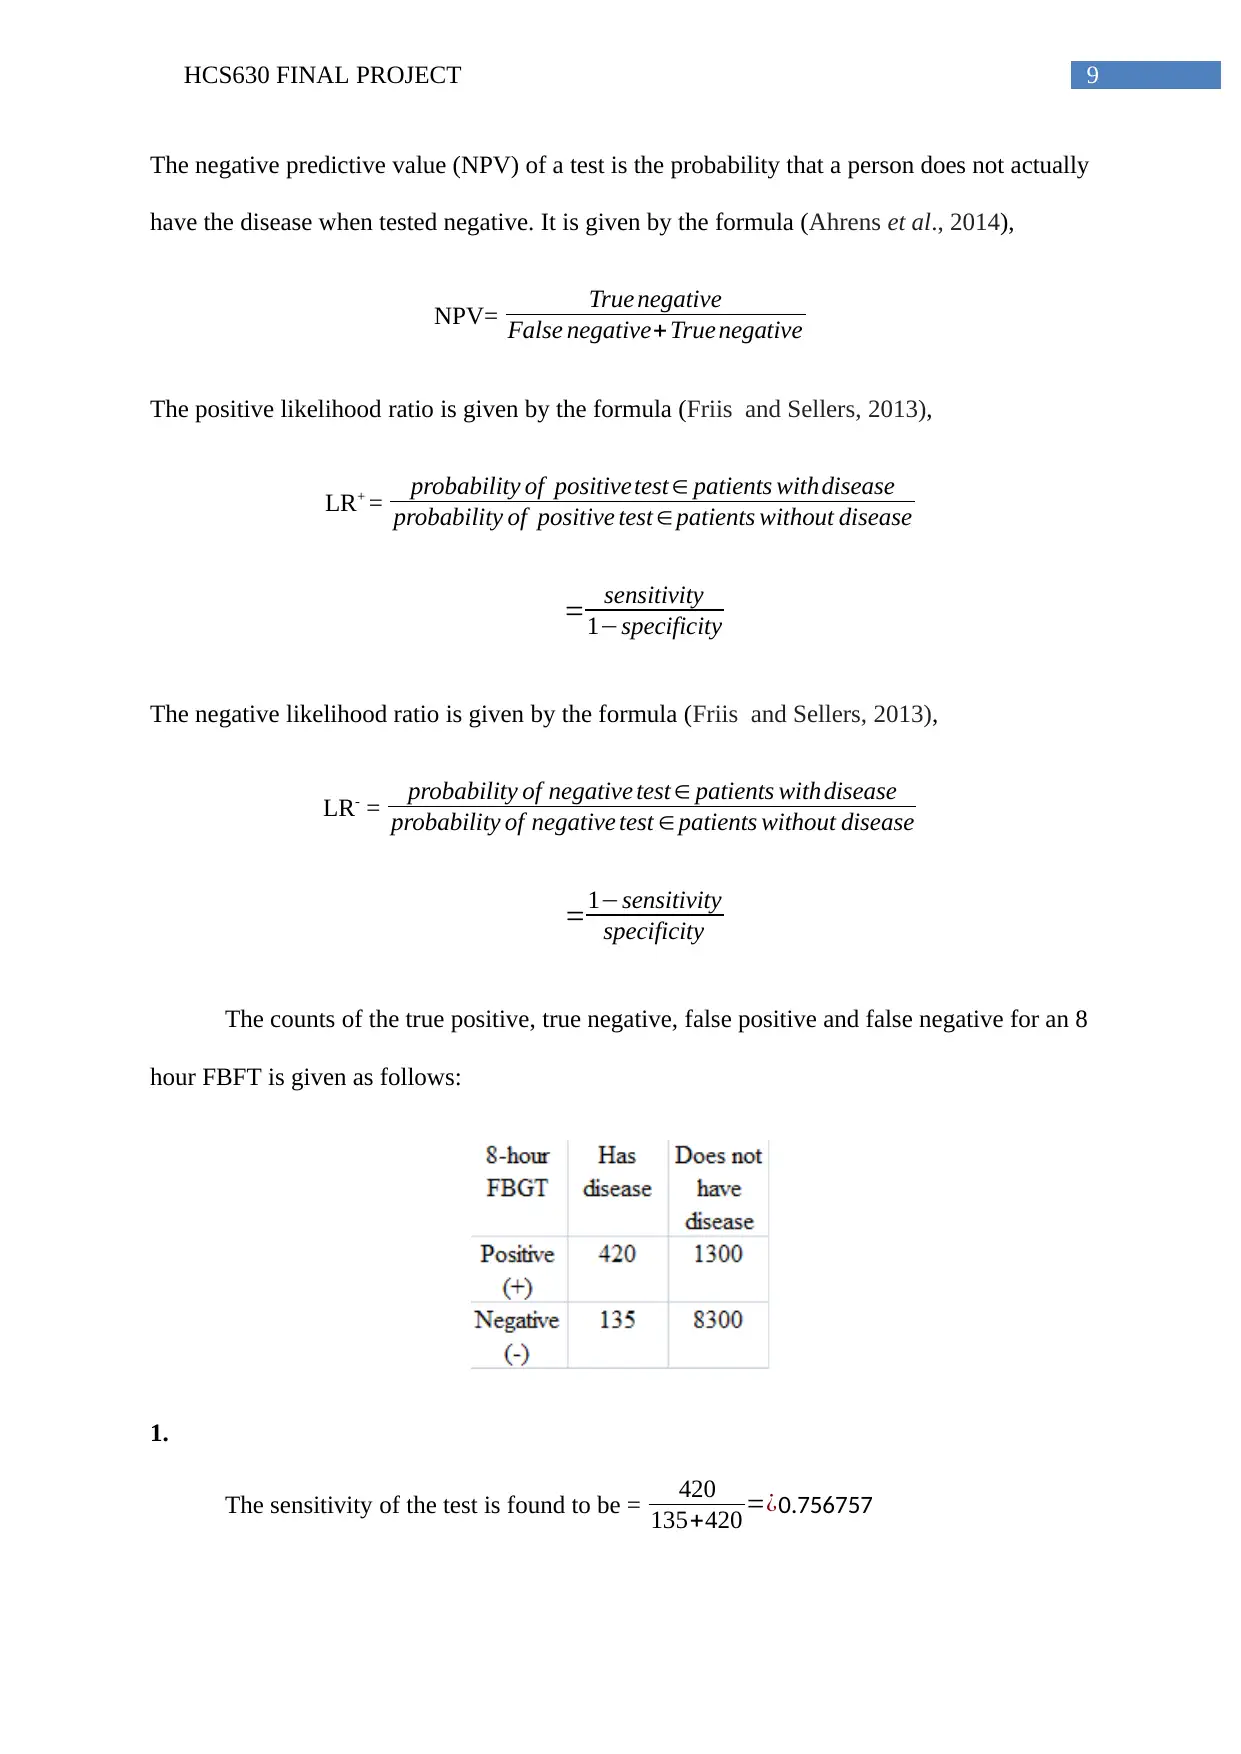
The counts of the true positive, true negative, false positive and false negative for an 8
hour FBFT is given as follows:
1.
The sensitivity of the test is found to be = 420
135+420 =¿0.756757
The negative predictive value (NPV) of a test is the probability that a person does not actually
have the disease when tested negative. It is given by the formula (Ahrens et al., 2014),
NPV= True negative
False negative+ Truenegative
The positive likelihood ratio is given by the formula (Friis and Sellers, 2013),
LR+ = probability of positivetest ∈ patients withdisease
probability of positive test ∈ patients without disease
= sensitivity
1−specificity
The negative likelihood ratio is given by the formula (Friis and Sellers, 2013),
LR- = probability of negative test ∈ patients withdisease
probability of negative test ∈ patients without disease
=1−sensitivity
specificity
The counts of the true positive, true negative, false positive and false negative for an 8
hour FBFT is given as follows:
1.
The sensitivity of the test is found to be = 420
135+420 =¿0.756757
Paraphrase This Document
Need a fresh take? Get an instant paraphrase of this document with our AI Paraphraser

10HCS630 FINAL PROJECT
2.
The specificity of the test is found to be = 8300
1300+8300 =¿0.865
3.
The positive predictive value of the test is found to be = 420
1300+420 =¿ 0.244186047
4.
The negative predictive value of the test is found to be = 8300
135+8300 =¿ 0.016004742
5.
The positive likelihood ratio of the test is found to be = 0.756757
1−0.865 =¿ 5.588357588
6.
The negative likelihood ratio of the test is found to be = 1−0.756757
0.865 =¿0.281341583
Infant Mortality Rates in US in 2011
Infant mortality per 1000 is given by the formula (Bartley, 2016),
Infant mortality per 1000= Total number of death∈age group 0−1
Total number of births × 1000
Neonatal mortality per 10000 is given by the formula (Bartley, 2016),
Neonatal mortality per 10000= Total number of deaths of infants<1 month old
Total number of births × 10000
Post neo-mortality per 1000 is given by the formula (Bartley, 2016),
11HCS630 FINAL PROJECT
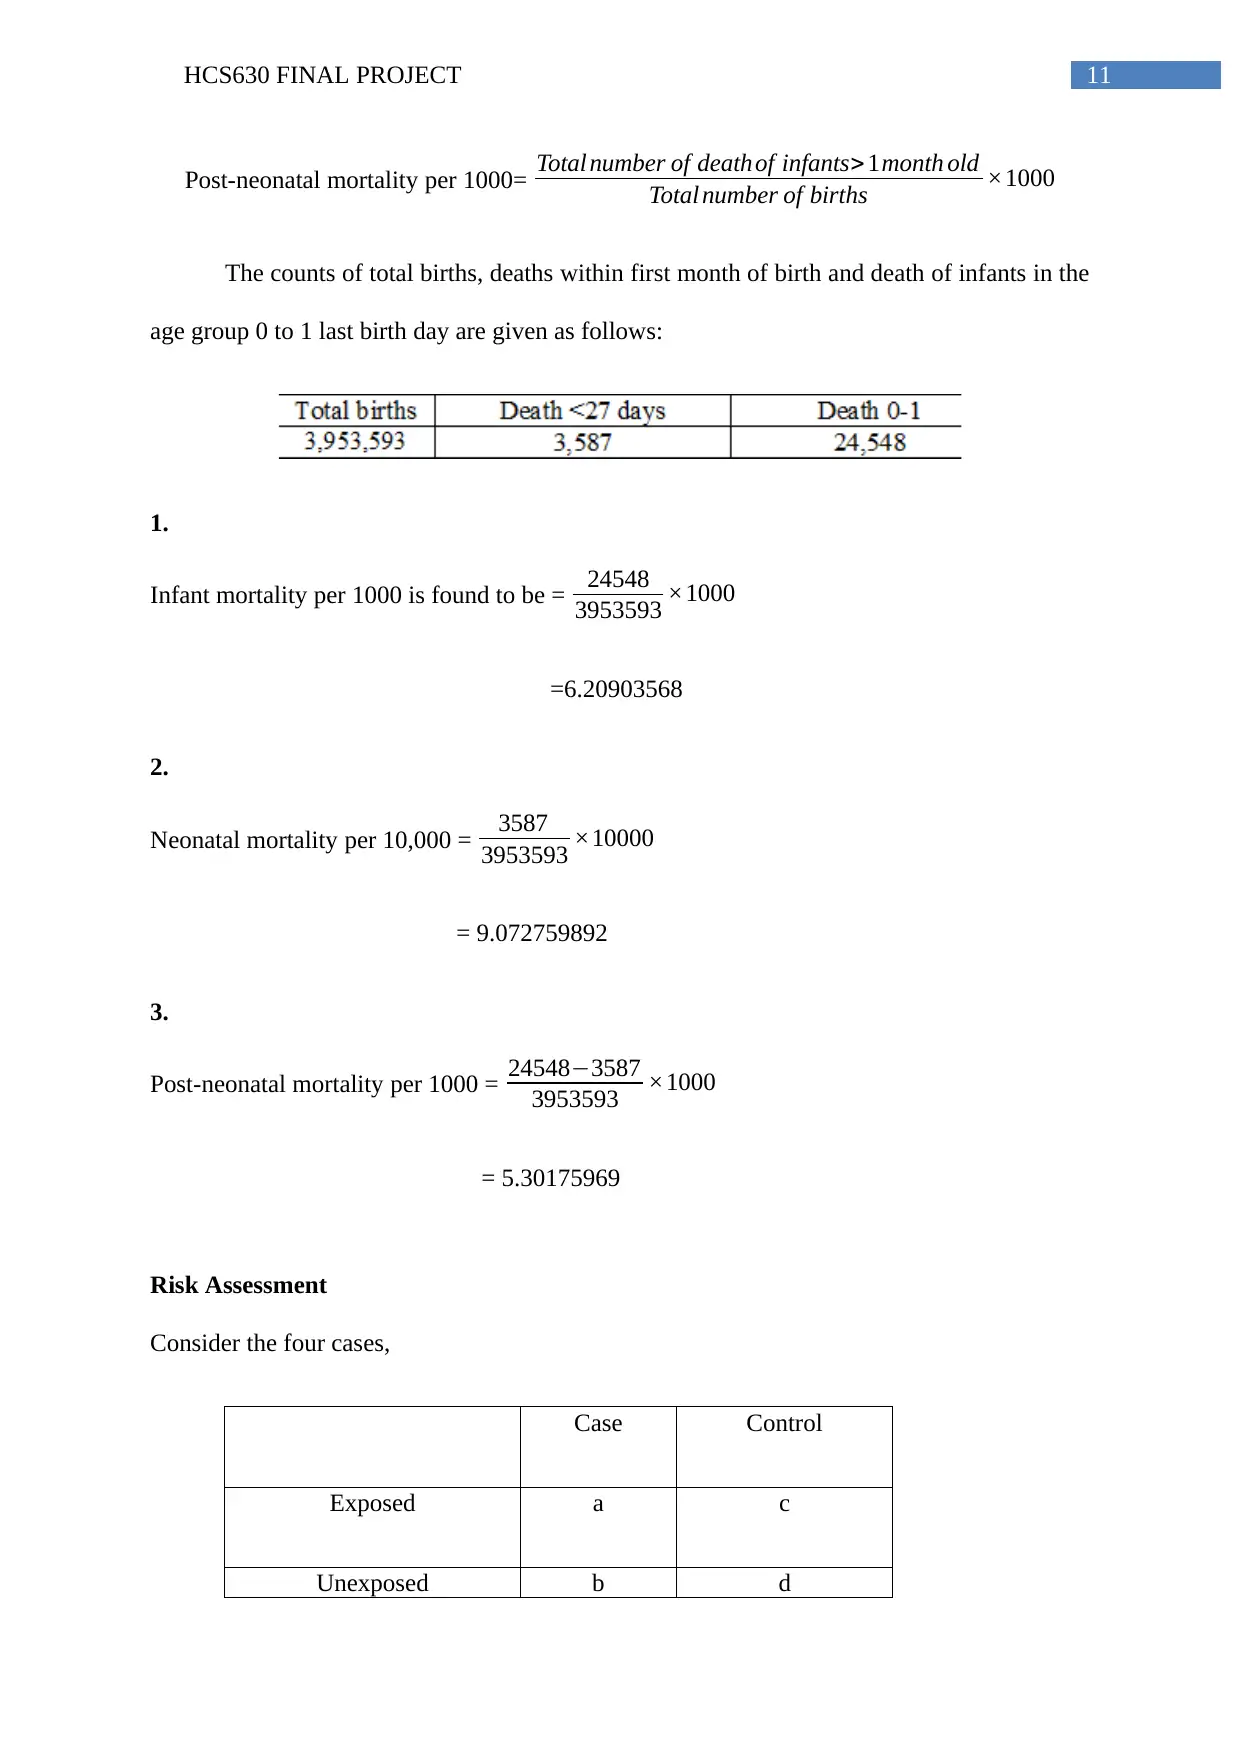
Post-neonatal mortality per 1000= Total number of deathof infants> 1month old
Total number of births ×1000
The counts of total births, deaths within first month of birth and death of infants in the
age group 0 to 1 last birth day are given as follows:
1.
Infant mortality per 1000 is found to be = 24548
3953593 ×1000
=6.20903568
2.
Neonatal mortality per 10,000 = 3587
3953593 ×10000
= 9.072759892
3.
Post-neonatal mortality per 1000 = 24548−3587
3953593 ×1000
= 5.30175969
Risk Assessment
Consider the four cases,
Case Control
Exposed a c
Unexposed b d
⊘ This is a preview!⊘
Do you want full access?
Subscribe today to unlock all pages.
Trusted by 1+ million students worldwide
1 out of 17


Your All-in-One AI-Powered Toolkit for Academic Success.
+13062052269
info@desklib.com
Available 24*7 on WhatsApp / Email
![[object Object]](/_next/static/media/star-bottom.7253800d.svg)
Unlock your academic potential
Copyright © 2020–2026 A2Z Services. All Rights Reserved. Developed and managed by ZUCOL.