Comparative Financial Ratio Analysis: Airline Sector Performance
VerifiedAdded on 2021/02/19
|13
|3879
|18
Report
AI Summary
This report presents a financial ratio analysis of three airline companies: EasyJet, Flybe Group Plc, and Ryanair Holdings Public Ltd. The analysis covers the years 2016-2018 and includes profitability ratios (net profit margin, return on capital employed), liquidity ratios (current ratio, quick ratio), and gearing ratios (debt-equity ratio, interest cover, sales to capital employed). The report calculates and compares these ratios to assess the financial performance, liquidity, and leverage of each company, providing insights into their operational efficiency, ability to meet short-term obligations, and financial risk. The findings highlight the strengths and weaknesses of each airline, offering a comparative perspective on their financial health and performance trends. Ryanair consistently demonstrates strong performance, while Flybe faces significant challenges. The report also includes interpretations and rankings for each ratio, providing a comprehensive overview of the companies' financial positions.
Accounting and Finance
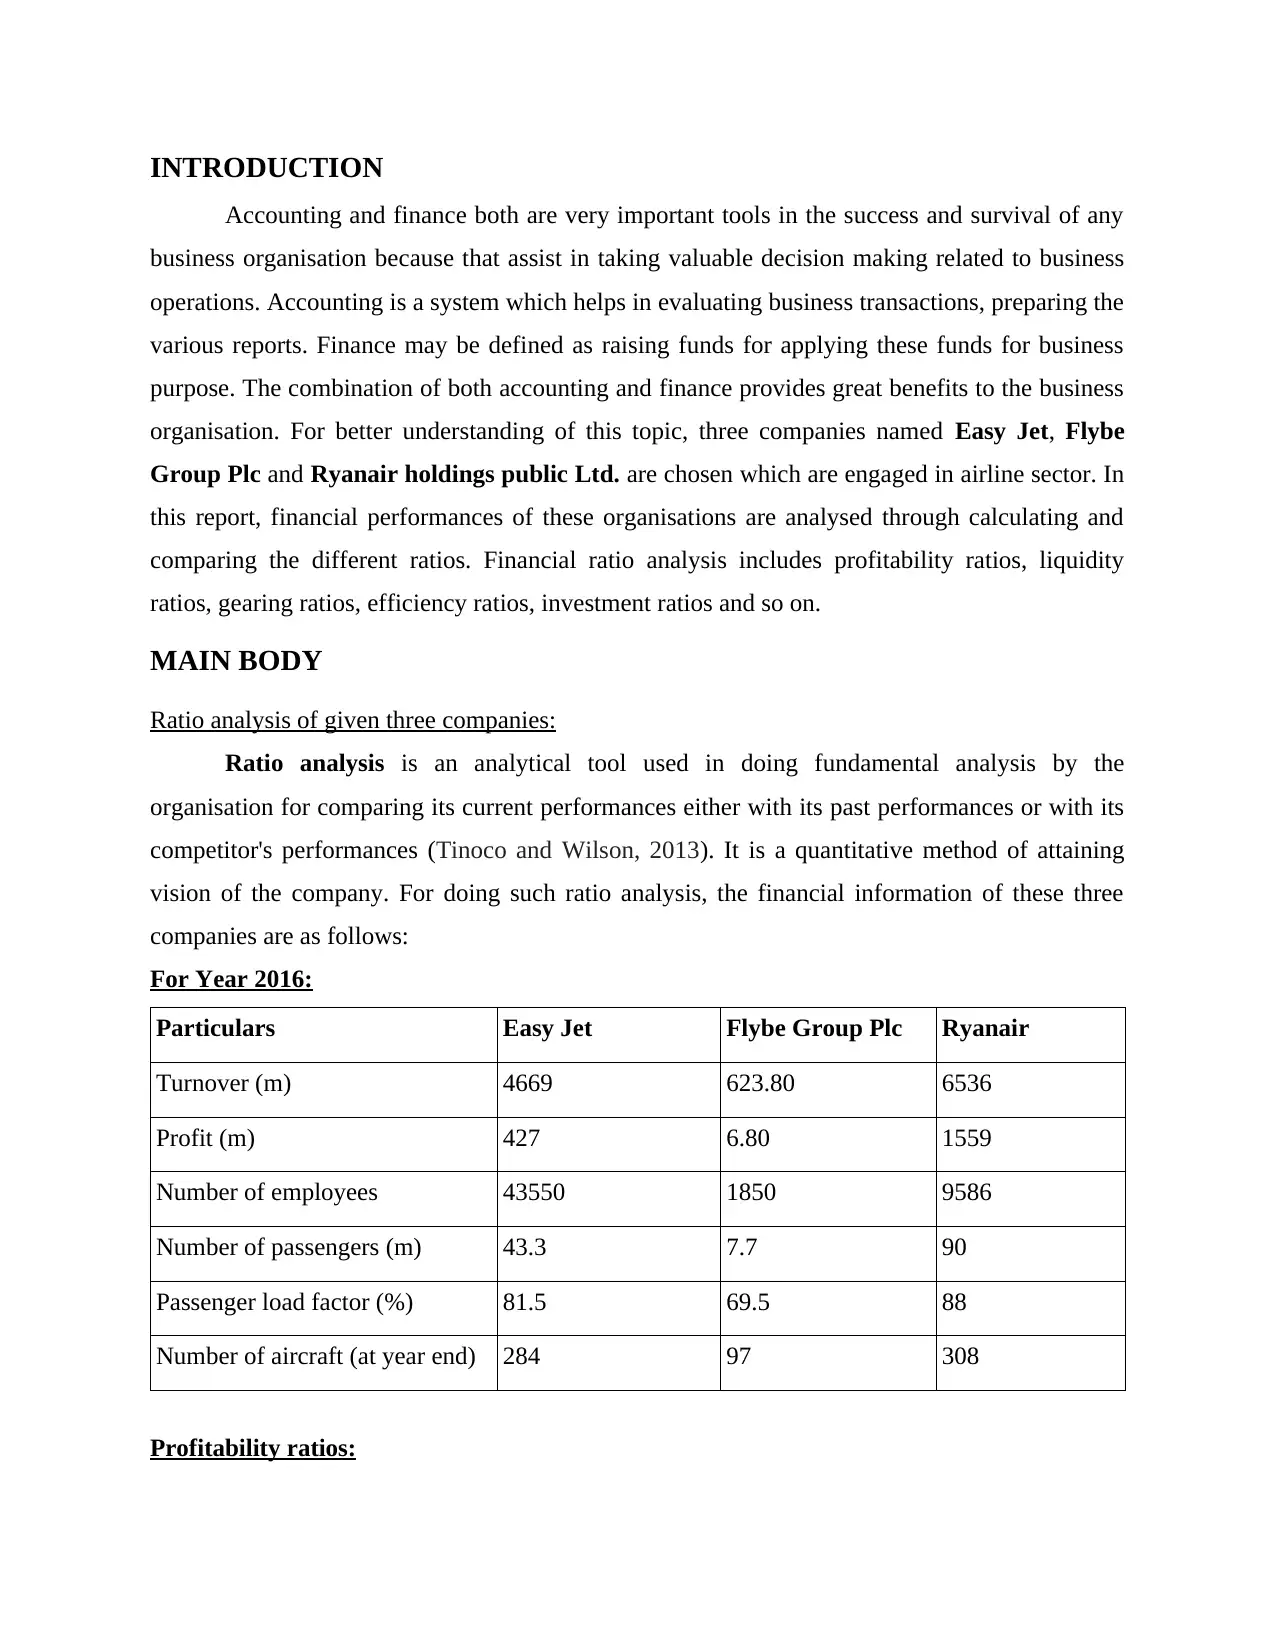
Table of Contents
INTRODUCTION......................................................................................................................................................................................... 2
MAIN BODY................................................................................................................................................................................................ 2
Ratio analysis of given three companies:..........................................................................................................................................2
Non financial ratios:........................................................................................................................................................................10
QUESTION 2:................................................................................................................................................................................12
CONCLUSION............................................................................................................................................................................................13
REFERENCES............................................................................................................................................................................................14
Paraphrase This Document
Need a fresh take? Get an instant paraphrase of this document with our AI Paraphraser
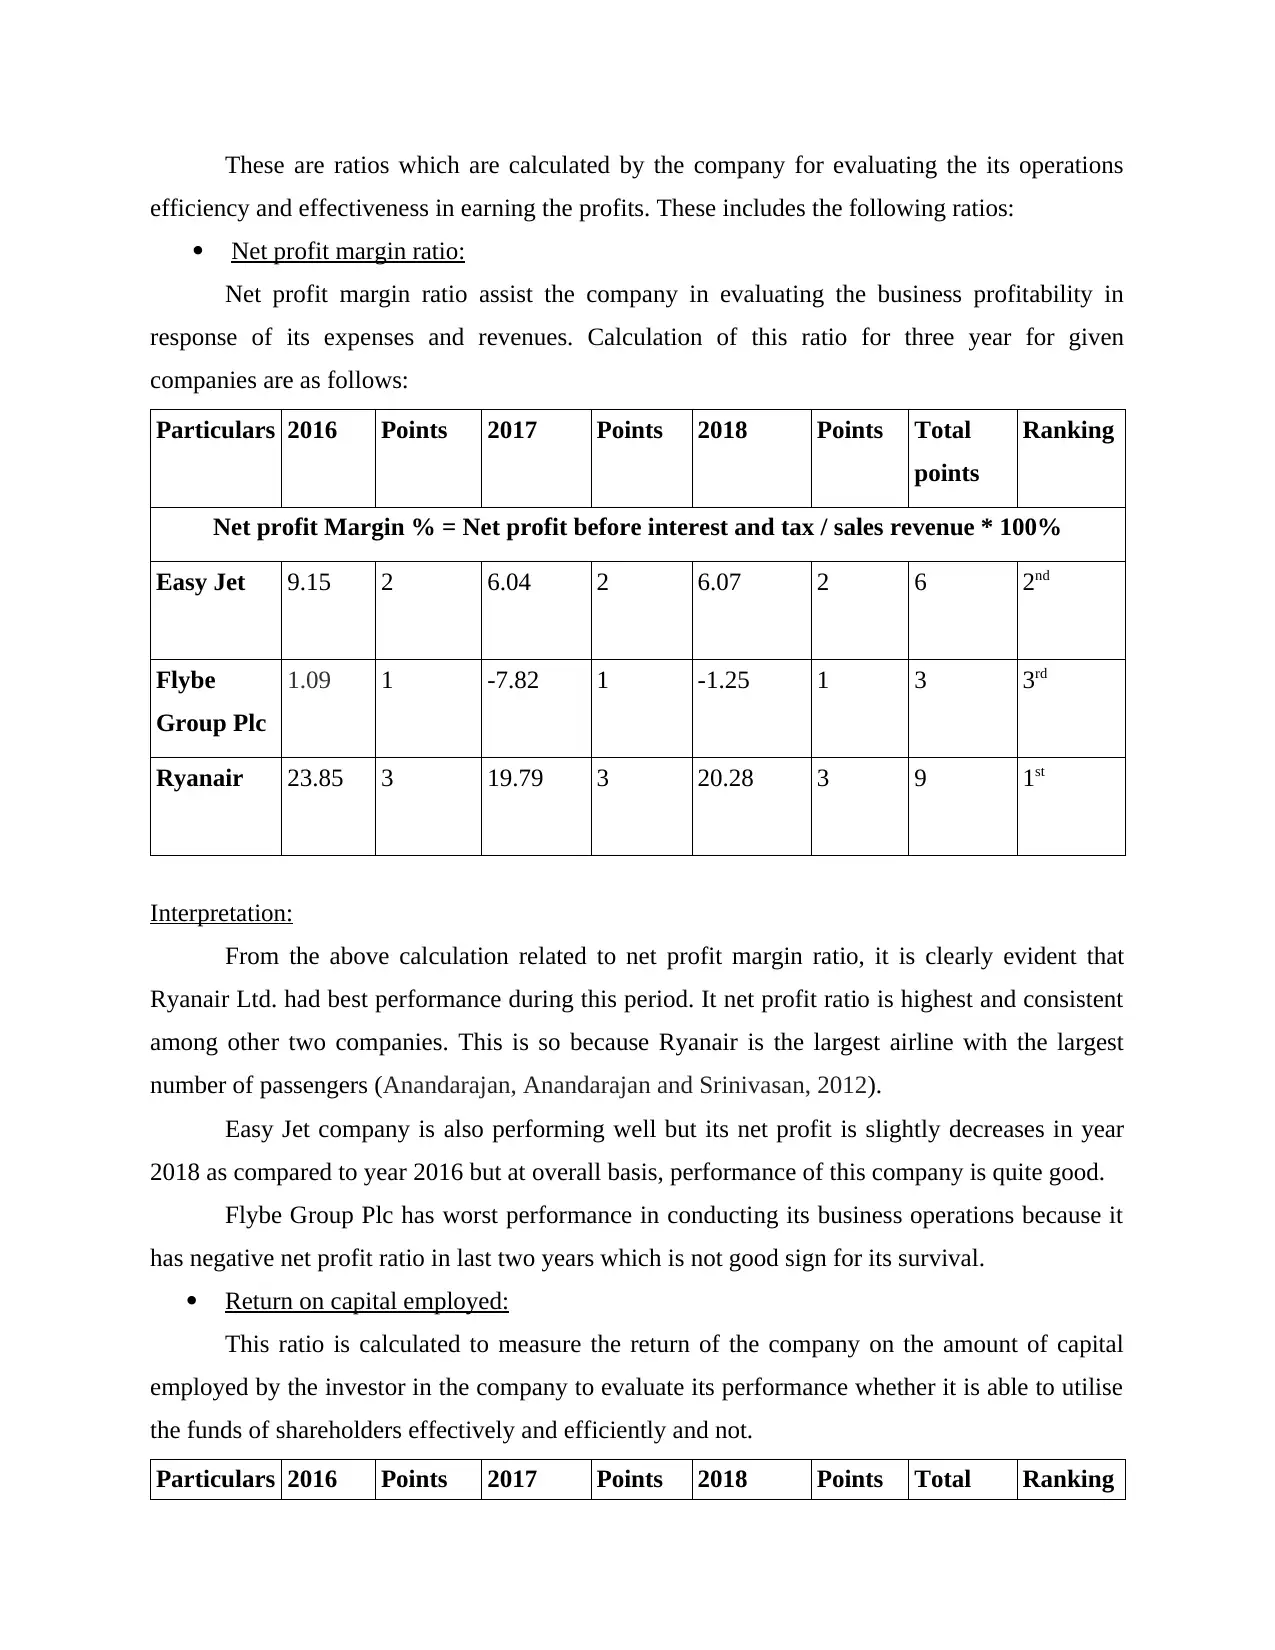
INTRODUCTION
Accounting and finance both are very important tools in the success and survival of any
business organisation because that assist in taking valuable decision making related to business
operations. Accounting is a system which helps in evaluating business transactions, preparing the
various reports. Finance may be defined as raising funds for applying these funds for business
purpose. The combination of both accounting and finance provides great benefits to the business
organisation. For better understanding of this topic, three companies named Easy Jet, Flybe
Group Plc and Ryanair holdings public Ltd. are chosen which are engaged in airline sector. In
this report, financial performances of these organisations are analysed through calculating and
comparing the different ratios. Financial ratio analysis includes profitability ratios, liquidity
ratios, gearing ratios, efficiency ratios, investment ratios and so on.
MAIN BODY
Ratio analysis of given three companies:
Ratio analysis is an analytical tool used in doing fundamental analysis by the
organisation for comparing its current performances either with its past performances or with its
competitor's performances (Tinoco and Wilson, 2013). It is a quantitative method of attaining
vision of the company. For doing such ratio analysis, the financial information of these three
companies are as follows:
For Year 2016:
Particulars Easy Jet Flybe Group Plc Ryanair
Turnover (m) 4669 623.80 6536
Profit (m) 427 6.80 1559
Number of employees 43550 1850 9586
Number of passengers (m) 43.3 7.7 90
Passenger load factor (%) 81.5 69.5 88
Number of aircraft (at year end) 284 97 308
Profitability ratios:
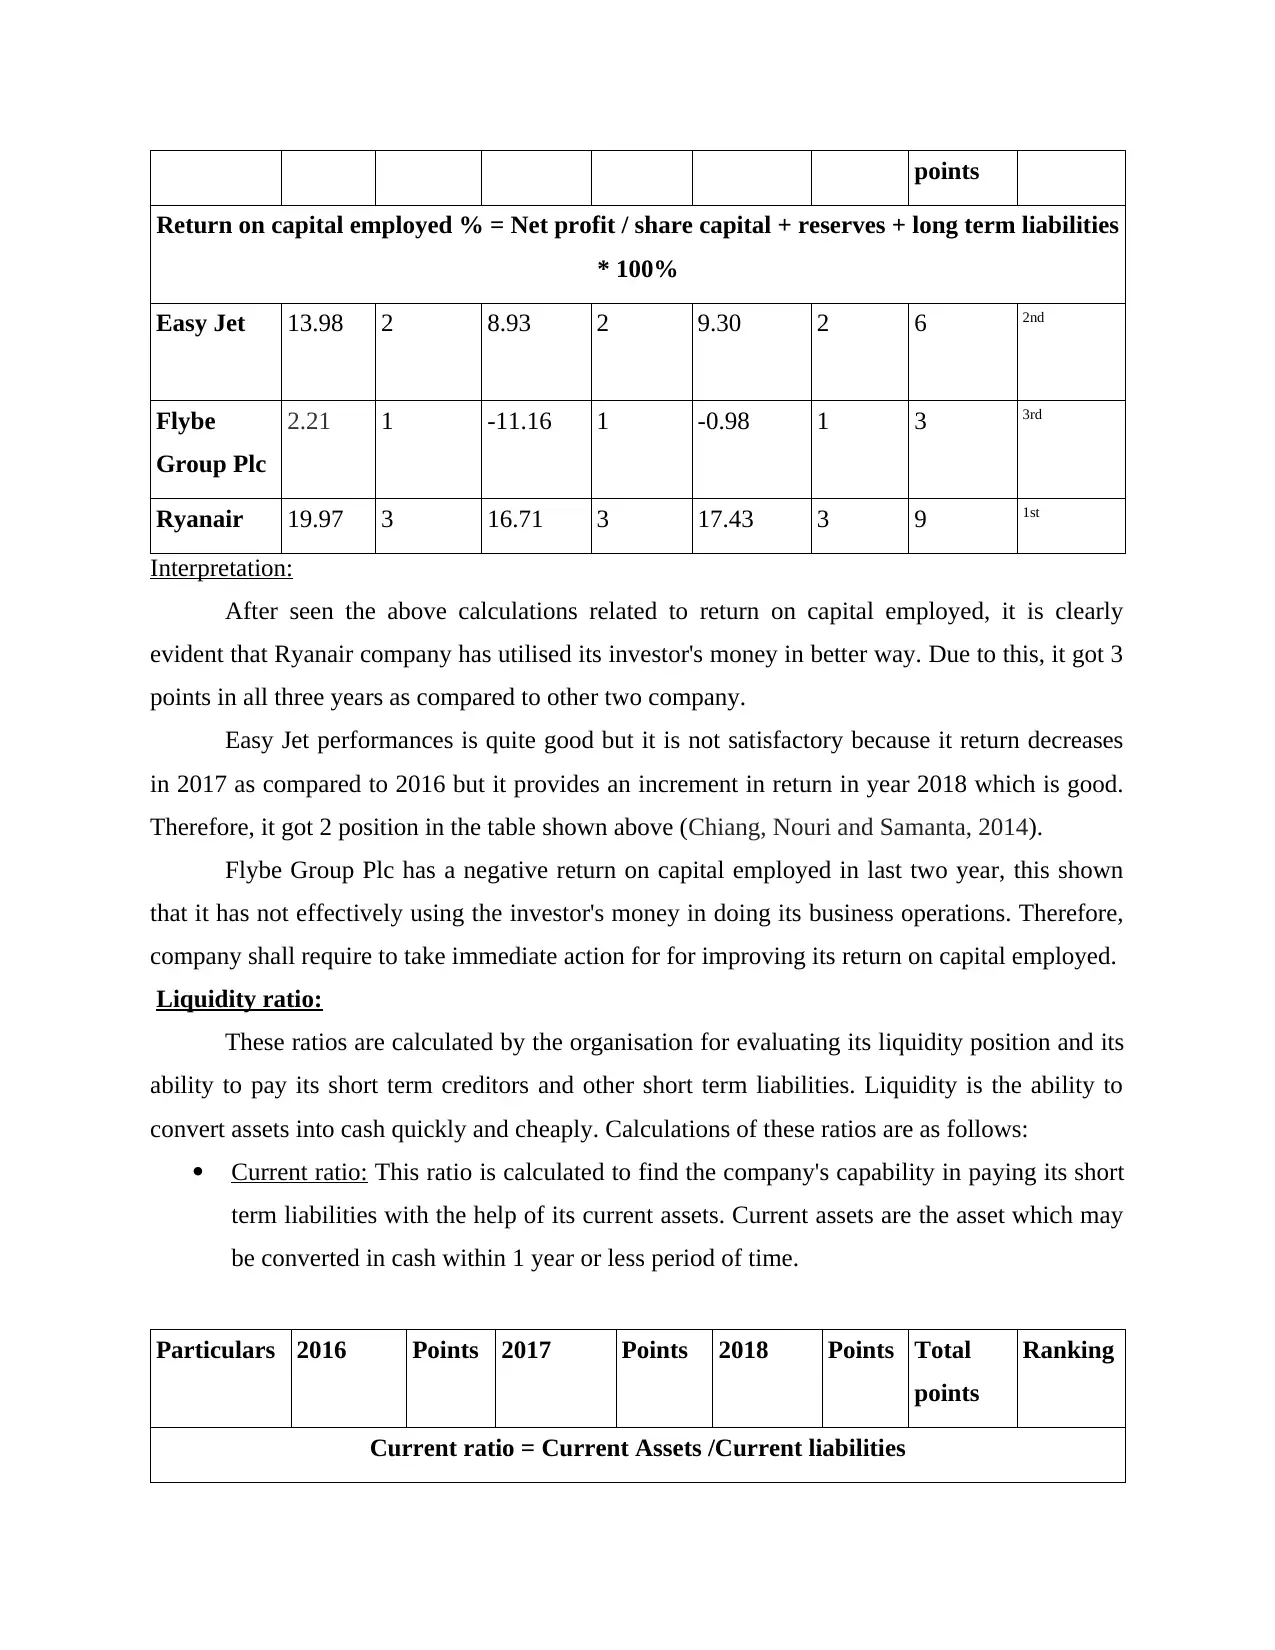
These are ratios which are calculated by the company for evaluating the its operations
efficiency and effectiveness in earning the profits. These includes the following ratios:
Net profit margin ratio:
Net profit margin ratio assist the company in evaluating the business profitability in
response of its expenses and revenues. Calculation of this ratio for three year for given
companies are as follows:
Particulars 2016 Points 2017 Points 2018 Points Total
points
Ranking
Net profit Margin % = Net profit before interest and tax / sales revenue * 100%
Easy Jet 9.15 2 6.04 2 6.07 2 6 2nd
Flybe
Group Plc
1.09 1 -7.82 1 -1.25 1 3 3rd
Ryanair 23.85 3 19.79 3 20.28 3 9 1st
Interpretation:
From the above calculation related to net profit margin ratio, it is clearly evident that
Ryanair Ltd. had best performance during this period. It net profit ratio is highest and consistent
among other two companies. This is so because Ryanair is the largest airline with the largest
number of passengers (Anandarajan, Anandarajan and Srinivasan, 2012).
Easy Jet company is also performing well but its net profit is slightly decreases in year
2018 as compared to year 2016 but at overall basis, performance of this company is quite good.
Flybe Group Plc has worst performance in conducting its business operations because it
has negative net profit ratio in last two years which is not good sign for its survival.
Return on capital employed:
This ratio is calculated to measure the return of the company on the amount of capital
employed by the investor in the company to evaluate its performance whether it is able to utilise
the funds of shareholders effectively and efficiently and not.
Particulars 2016 Points 2017 Points 2018 Points Total Ranking
⊘ This is a preview!⊘
Do you want full access?
Subscribe today to unlock all pages.
Trusted by 1+ million students worldwide
points
Return on capital employed % = Net profit / share capital + reserves + long term liabilities
* 100%
Easy Jet 13.98 2 8.93 2 9.30 2 6 2nd
Flybe
Group Plc
2.21 1 -11.16 1 -0.98 1 3 3rd
Ryanair 19.97 3 16.71 3 17.43 3 9 1st
Interpretation:
After seen the above calculations related to return on capital employed, it is clearly
evident that Ryanair company has utilised its investor's money in better way. Due to this, it got 3
points in all three years as compared to other two company.
Easy Jet performances is quite good but it is not satisfactory because it return decreases
in 2017 as compared to 2016 but it provides an increment in return in year 2018 which is good.
Therefore, it got 2 position in the table shown above (Chiang, Nouri and Samanta, 2014).
Flybe Group Plc has a negative return on capital employed in last two year, this shown
that it has not effectively using the investor's money in doing its business operations. Therefore,
company shall require to take immediate action for for improving its return on capital employed.
Liquidity ratio:
These ratios are calculated by the organisation for evaluating its liquidity position and its
ability to pay its short term creditors and other short term liabilities. Liquidity is the ability to
convert assets into cash quickly and cheaply. Calculations of these ratios are as follows:
Current ratio: This ratio is calculated to find the company's capability in paying its short
term liabilities with the help of its current assets. Current assets are the asset which may
be converted in cash within 1 year or less period of time.
Particulars 2016 Points 2017 Points 2018 Points Total
points
Ranking
Current ratio = Current Assets /Current liabilities
Paraphrase This Document
Need a fresh take? Get an instant paraphrase of this document with our AI Paraphraser
Easy Jet 0.92 1 1.04 2 0.97 2 5 2nd
Flybe
Group Plc
1.06 2 0.96 1 0.71 1 4 3rd
Ryanair 1.43 3 1.56 3 1.23 3 9 1st
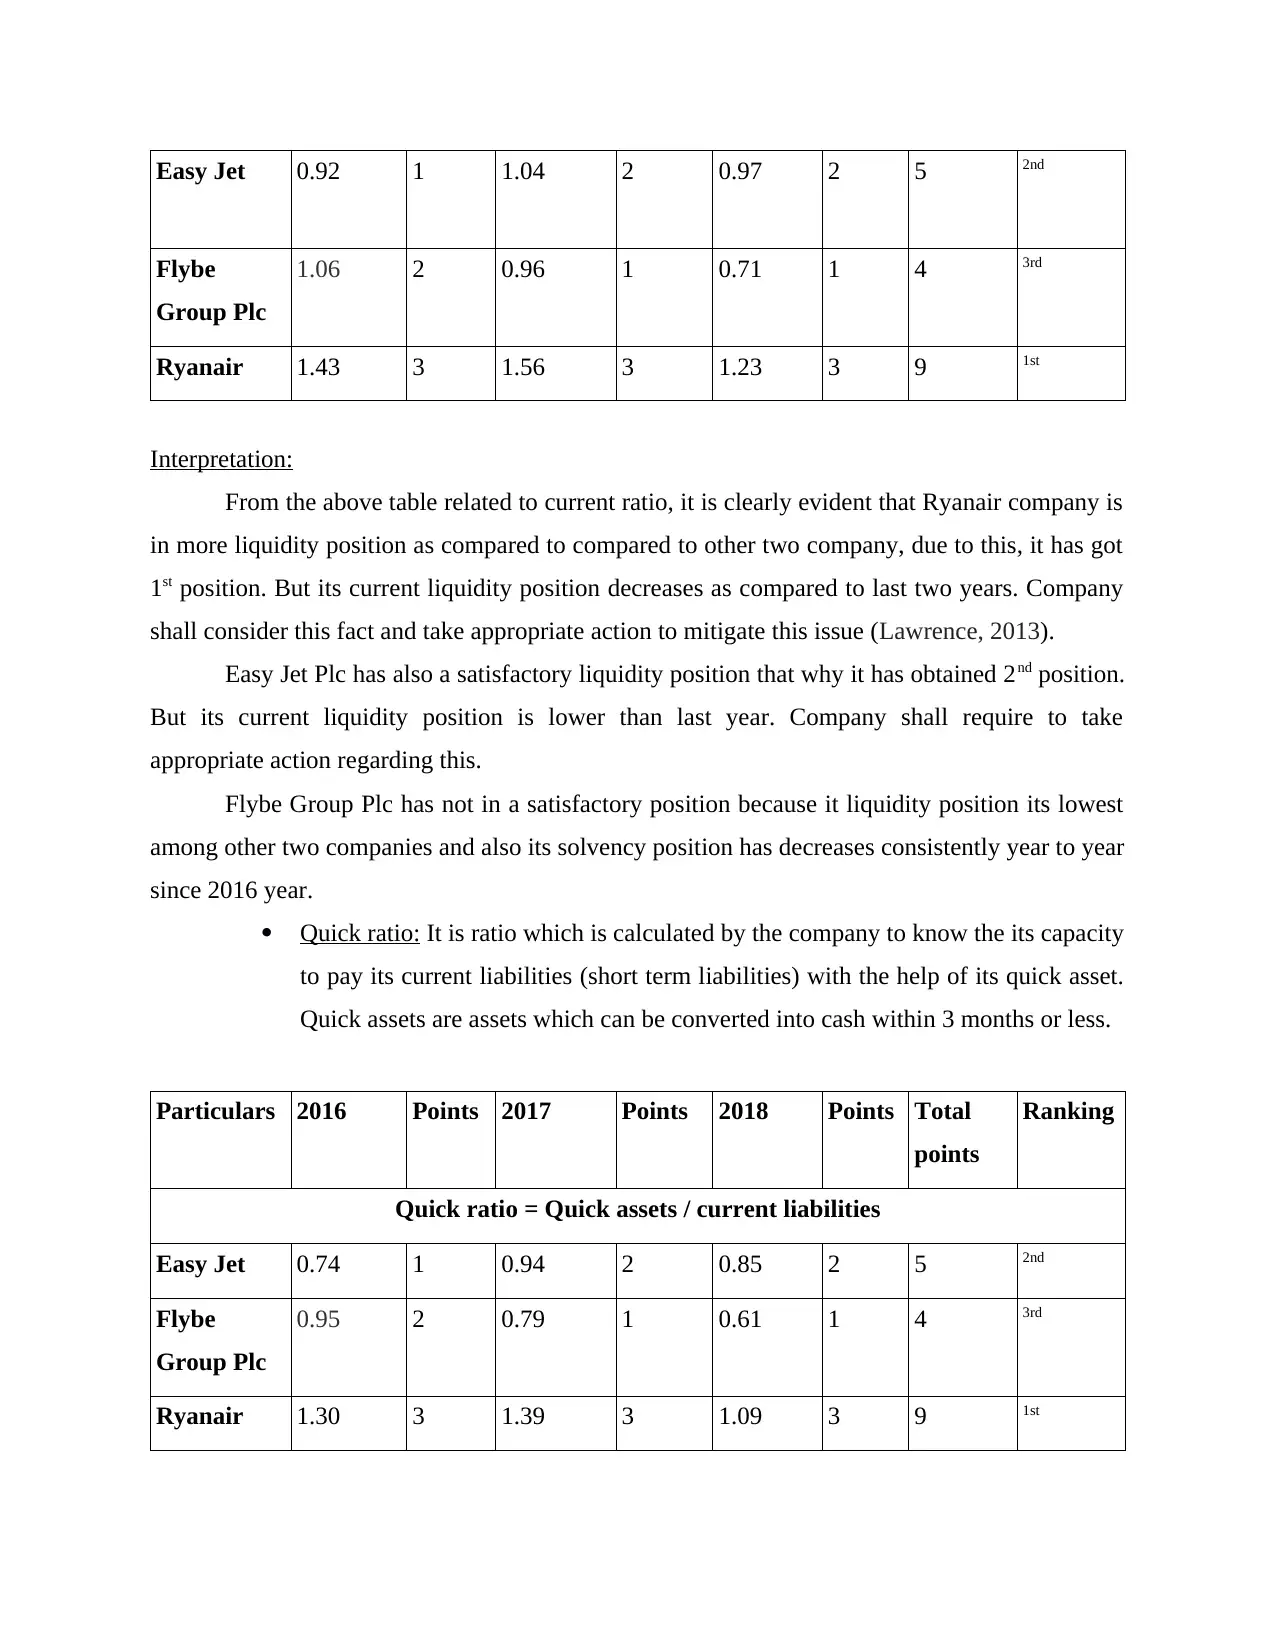
Interpretation:
From the above table related to current ratio, it is clearly evident that Ryanair company is
in more liquidity position as compared to compared to other two company, due to this, it has got
1st position. But its current liquidity position decreases as compared to last two years. Company
shall consider this fact and take appropriate action to mitigate this issue (Lawrence, 2013).
Easy Jet Plc has also a satisfactory liquidity position that why it has obtained 2nd position.
But its current liquidity position is lower than last year. Company shall require to take
appropriate action regarding this.
Flybe Group Plc has not in a satisfactory position because it liquidity position its lowest
among other two companies and also its solvency position has decreases consistently year to year
since 2016 year.
Quick ratio: It is ratio which is calculated by the company to know the its capacity
to pay its current liabilities (short term liabilities) with the help of its quick asset.
Quick assets are assets which can be converted into cash within 3 months or less.
Particulars 2016 Points 2017 Points 2018 Points Total
points
Ranking
Quick ratio = Quick assets / current liabilities
Easy Jet 0.74 1 0.94 2 0.85 2 5 2nd
Flybe
Group Plc
0.95 2 0.79 1 0.61 1 4 3rd
Ryanair 1.30 3 1.39 3 1.09 3 9 1st
Flybe
Group Plc
1.06 2 0.96 1 0.71 1 4 3rd
Ryanair 1.43 3 1.56 3 1.23 3 9 1st
Interpretation:
From the above table related to current ratio, it is clearly evident that Ryanair company is
in more liquidity position as compared to compared to other two company, due to this, it has got
1st position. But its current liquidity position decreases as compared to last two years. Company
shall consider this fact and take appropriate action to mitigate this issue (Lawrence, 2013).
Easy Jet Plc has also a satisfactory liquidity position that why it has obtained 2nd position.
But its current liquidity position is lower than last year. Company shall require to take
appropriate action regarding this.
Flybe Group Plc has not in a satisfactory position because it liquidity position its lowest
among other two companies and also its solvency position has decreases consistently year to year
since 2016 year.
Quick ratio: It is ratio which is calculated by the company to know the its capacity
to pay its current liabilities (short term liabilities) with the help of its quick asset.
Quick assets are assets which can be converted into cash within 3 months or less.
Particulars 2016 Points 2017 Points 2018 Points Total
points
Ranking
Quick ratio = Quick assets / current liabilities
Easy Jet 0.74 1 0.94 2 0.85 2 5 2nd
Flybe
Group Plc
0.95 2 0.79 1 0.61 1 4 3rd
Ryanair 1.30 3 1.39 3 1.09 3 9 1st
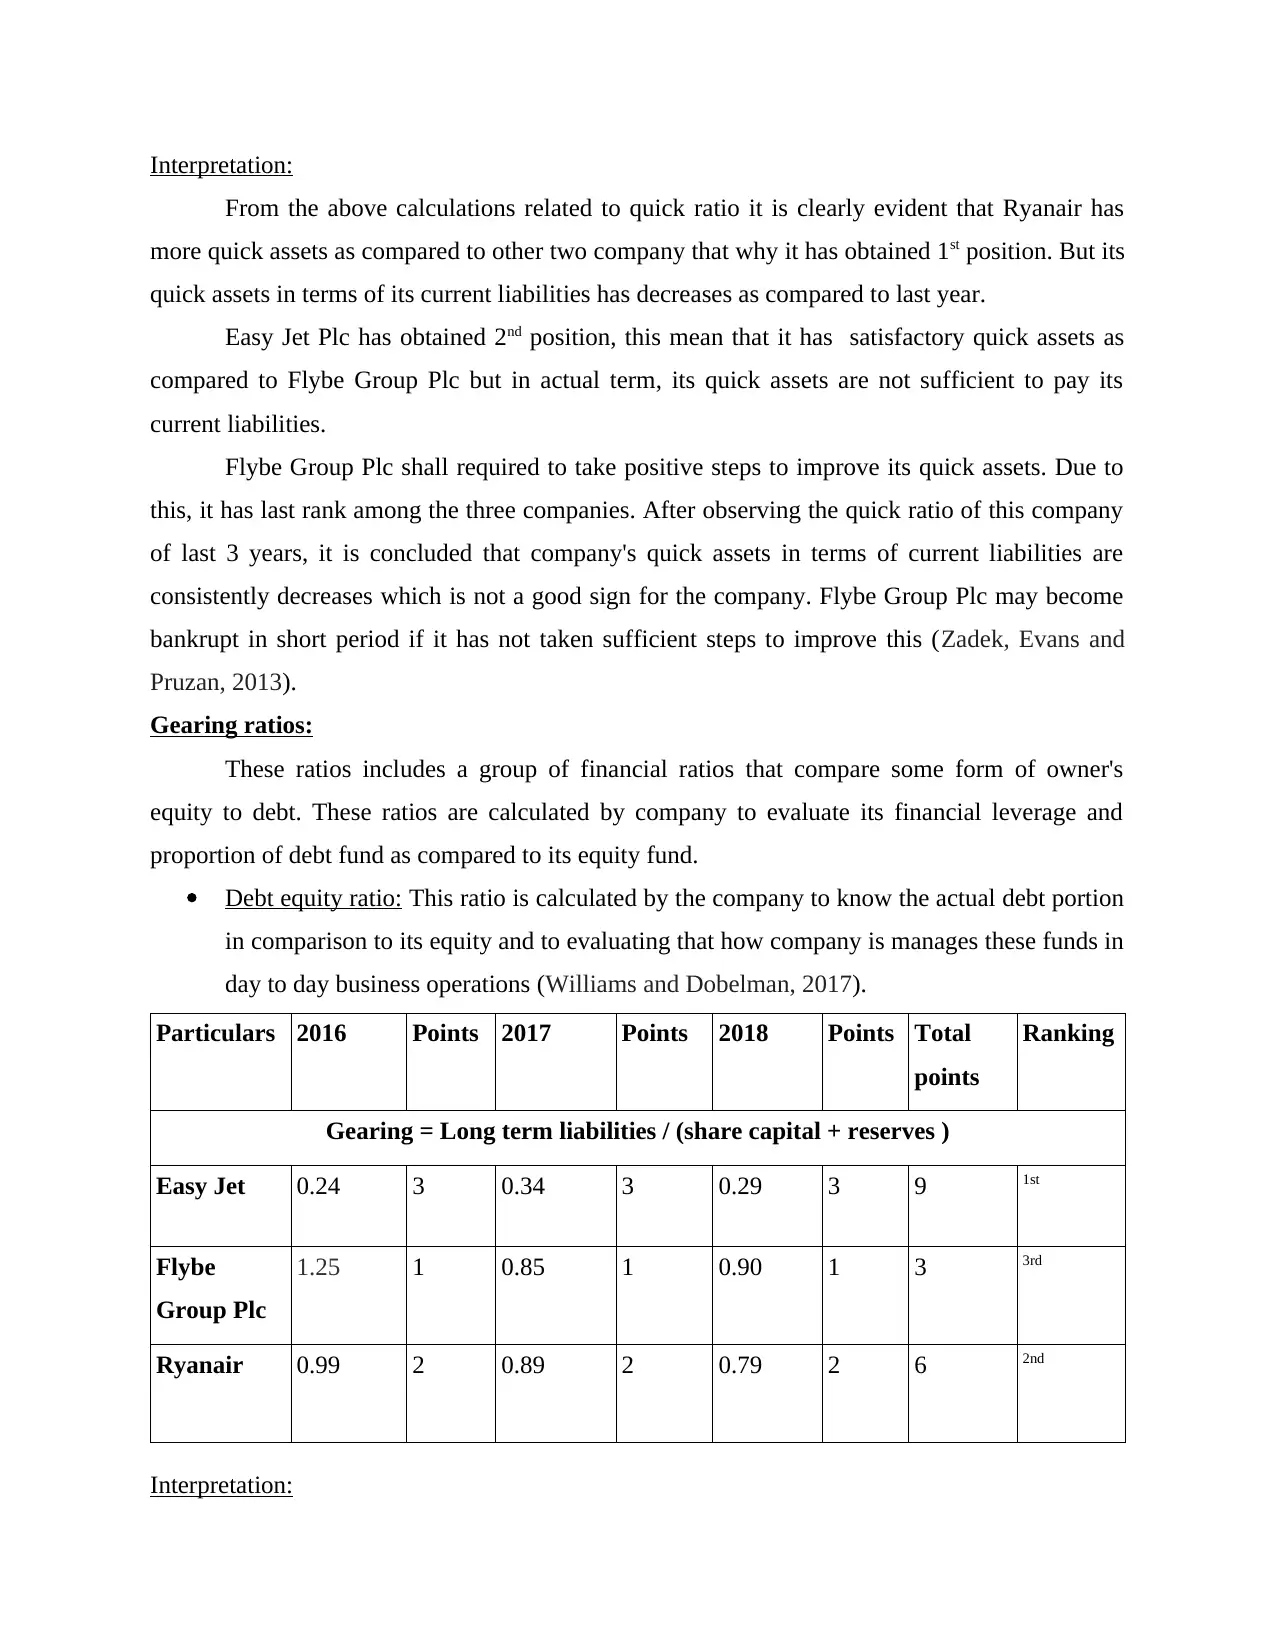
Interpretation:
From the above calculations related to quick ratio it is clearly evident that Ryanair has
more quick assets as compared to other two company that why it has obtained 1st position. But its
quick assets in terms of its current liabilities has decreases as compared to last year.
Easy Jet Plc has obtained 2nd position, this mean that it has satisfactory quick assets as
compared to Flybe Group Plc but in actual term, its quick assets are not sufficient to pay its
current liabilities.
Flybe Group Plc shall required to take positive steps to improve its quick assets. Due to
this, it has last rank among the three companies. After observing the quick ratio of this company
of last 3 years, it is concluded that company's quick assets in terms of current liabilities are
consistently decreases which is not a good sign for the company. Flybe Group Plc may become
bankrupt in short period if it has not taken sufficient steps to improve this (Zadek, Evans and
Pruzan, 2013).
Gearing ratios:
These ratios includes a group of financial ratios that compare some form of owner's
equity to debt. These ratios are calculated by company to evaluate its financial leverage and
proportion of debt fund as compared to its equity fund.
Debt equity ratio: This ratio is calculated by the company to know the actual debt portion
in comparison to its equity and to evaluating that how company is manages these funds in
day to day business operations (Williams and Dobelman, 2017).
Particulars 2016 Points 2017 Points 2018 Points Total
points
Ranking
Gearing = Long term liabilities / (share capital + reserves )
Easy Jet 0.24 3 0.34 3 0.29 3 9 1st
Flybe
Group Plc
1.25 1 0.85 1 0.90 1 3 3rd
Ryanair 0.99 2 0.89 2 0.79 2 6 2nd
Interpretation:
⊘ This is a preview!⊘
Do you want full access?
Subscribe today to unlock all pages.
Trusted by 1+ million students worldwide
From the above calculations related to the debt equity ratio, it is clearly evident that easy
Jet plc has the good ratios as compared to another two airline organisations. This is so because its
debt portion out of total capital is in limit and not excessive which mean that company has not
higher financial risk.
Flybe Group Plc has acquired the more capital by the way of debt. This mean that it has
both business risk as well as financial risk higher than other two organisation. Due to this, Flybe
Group Plc has got 3rd position in above table.
Ryanair Ltd. has got 2nd position, this mean that it has raised fund from debt sources as
well as equity in balanced way which is good for this because cost of debt is lower than cost of
equity.
Paraphrase This Document
Need a fresh take? Get an instant paraphrase of this document with our AI Paraphraser
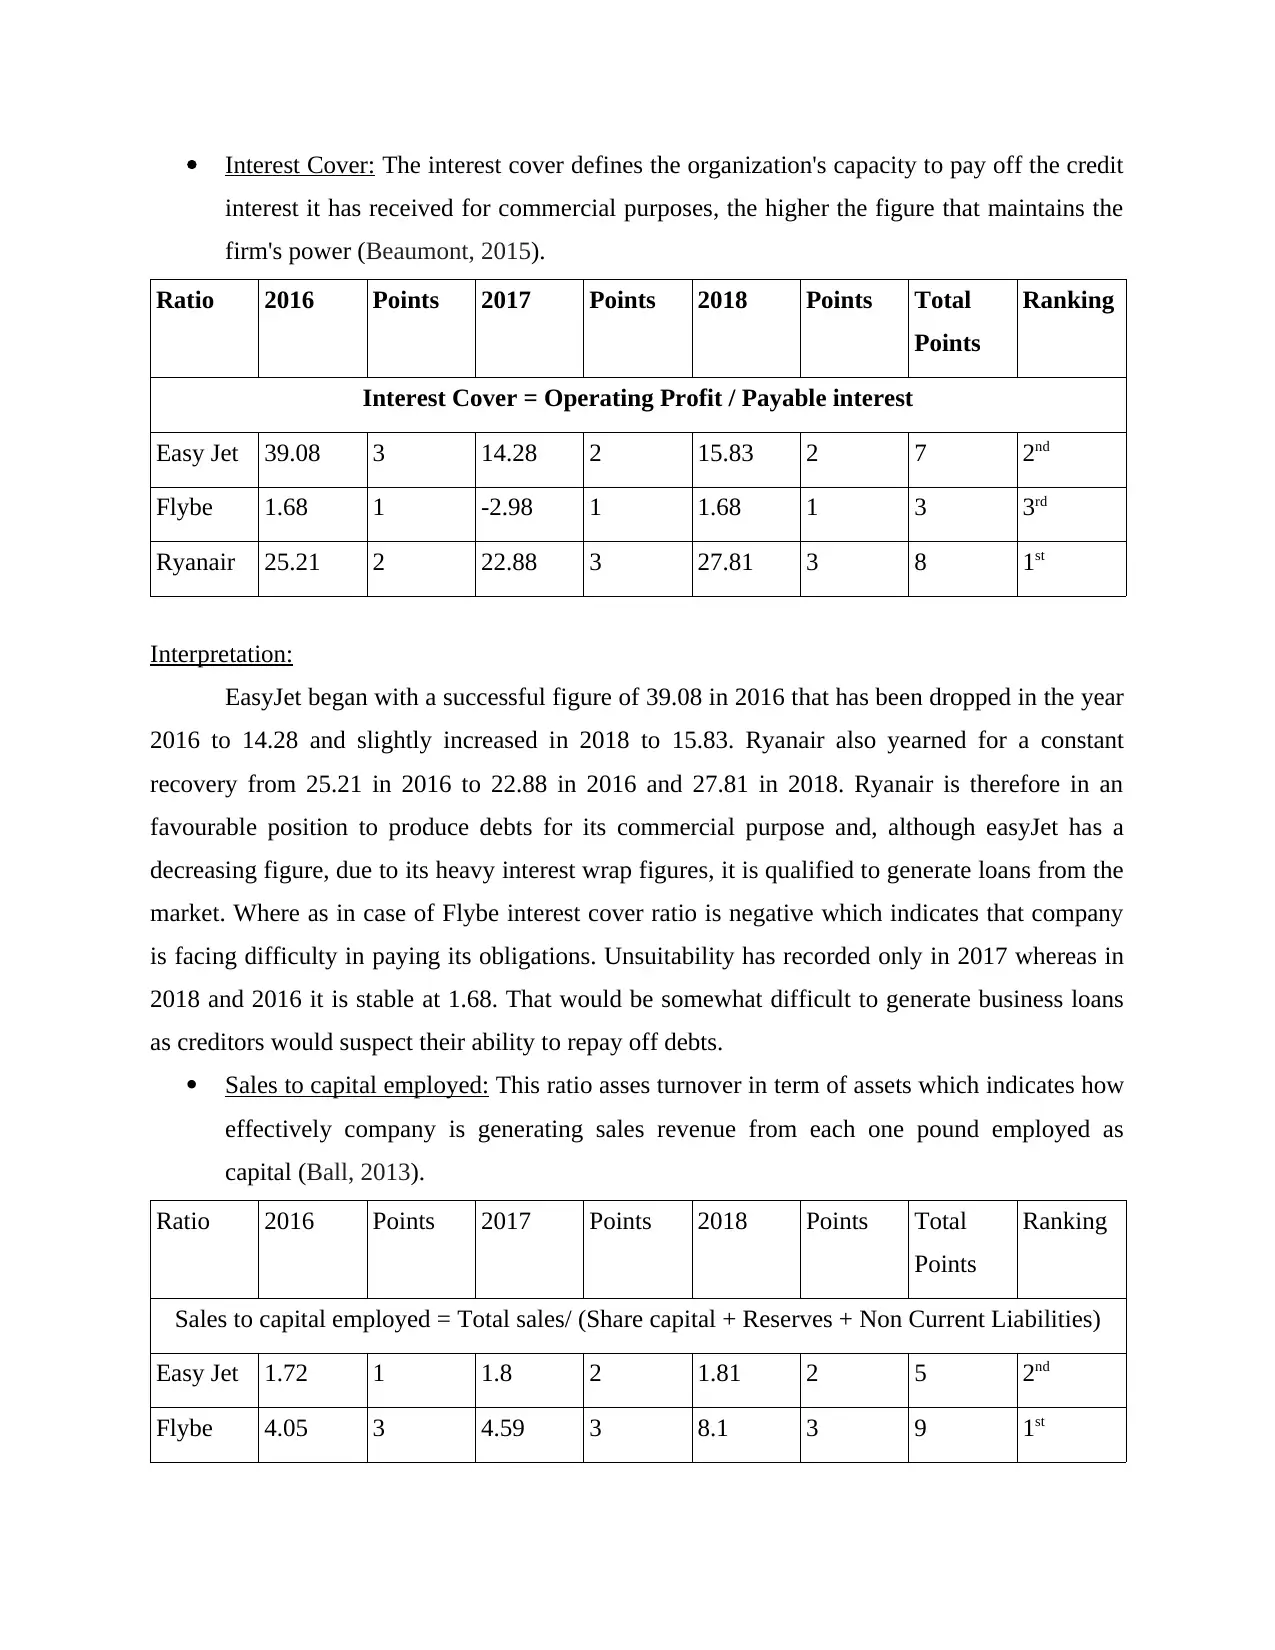
Interest Cover: The interest cover defines the organization's capacity to pay off the credit
interest it has received for commercial purposes, the higher the figure that maintains the
firm's power (Beaumont, 2015).
Ratio 2016 Points 2017 Points 2018 Points Total
Points
Ranking
Interest Cover = Operating Profit / Payable interest
Easy Jet 39.08 3 14.28 2 15.83 2 7 2nd
Flybe 1.68 1 -2.98 1 1.68 1 3 3rd
Ryanair 25.21 2 22.88 3 27.81 3 8 1st
Interpretation:
EasyJet began with a successful figure of 39.08 in 2016 that has been dropped in the year
2016 to 14.28 and slightly increased in 2018 to 15.83. Ryanair also yearned for a constant
recovery from 25.21 in 2016 to 22.88 in 2016 and 27.81 in 2018. Ryanair is therefore in an
favourable position to produce debts for its commercial purpose and, although easyJet has a
decreasing figure, due to its heavy interest wrap figures, it is qualified to generate loans from the
market. Where as in case of Flybe interest cover ratio is negative which indicates that company
is facing difficulty in paying its obligations. Unsuitability has recorded only in 2017 whereas in
2018 and 2016 it is stable at 1.68. That would be somewhat difficult to generate business loans
as creditors would suspect their ability to repay off debts.
Sales to capital employed: This ratio asses turnover in term of assets which indicates how
effectively company is generating sales revenue from each one pound employed as
capital (Ball, 2013).
Ratio 2016 Points 2017 Points 2018 Points Total
Points
Ranking
Sales to capital employed = Total sales/ (Share capital + Reserves + Non Current Liabilities)
Easy Jet 1.72 1 1.8 2 1.81 2 5 2nd
Flybe 4.05 3 4.59 3 8.1 3 9 1st
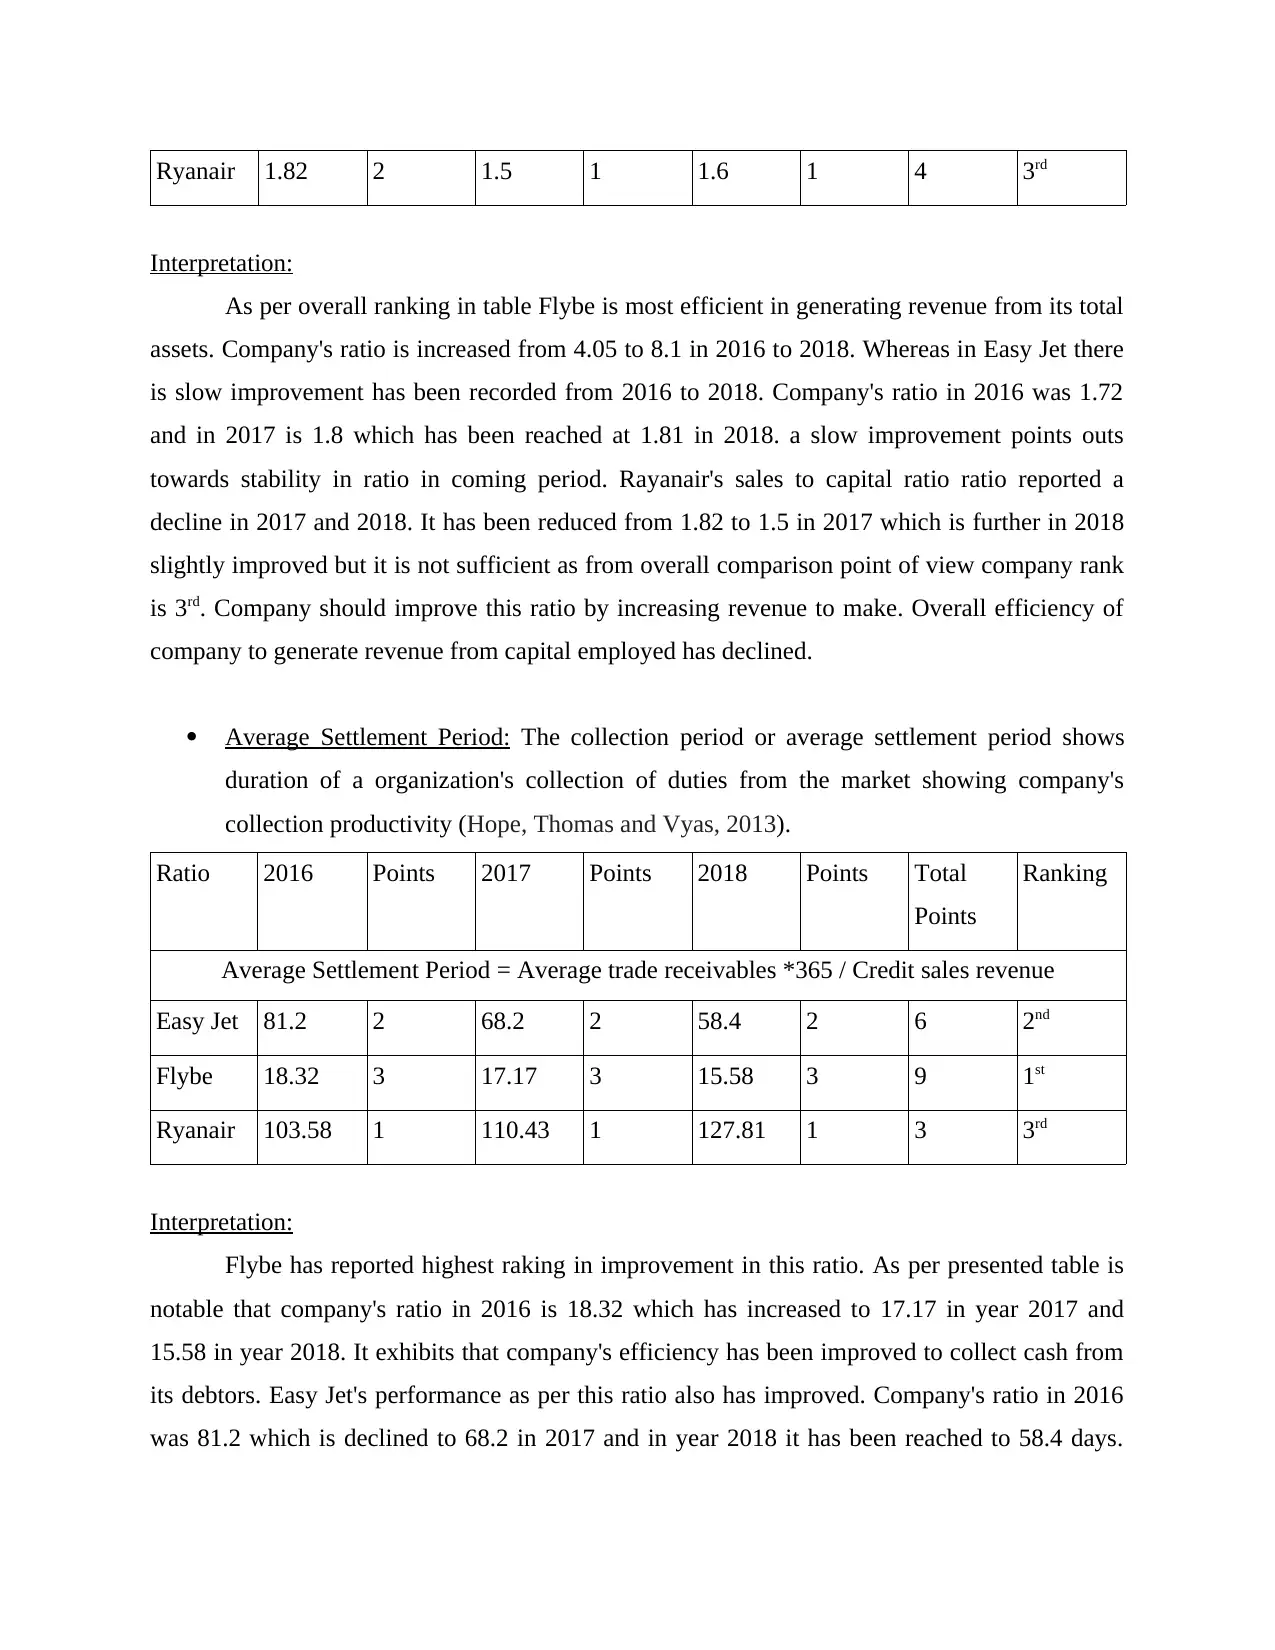
Ryanair 1.82 2 1.5 1 1.6 1 4 3rd
Interpretation:
As per overall ranking in table Flybe is most efficient in generating revenue from its total
assets. Company's ratio is increased from 4.05 to 8.1 in 2016 to 2018. Whereas in Easy Jet there
is slow improvement has been recorded from 2016 to 2018. Company's ratio in 2016 was 1.72
and in 2017 is 1.8 which has been reached at 1.81 in 2018. a slow improvement points outs
towards stability in ratio in coming period. Rayanair's sales to capital ratio ratio reported a
decline in 2017 and 2018. It has been reduced from 1.82 to 1.5 in 2017 which is further in 2018
slightly improved but it is not sufficient as from overall comparison point of view company rank
is 3rd. Company should improve this ratio by increasing revenue to make. Overall efficiency of
company to generate revenue from capital employed has declined.
Average Settlement Period: The collection period or average settlement period shows
duration of a organization's collection of duties from the market showing company's
collection productivity (Hope, Thomas and Vyas, 2013).
Ratio 2016 Points 2017 Points 2018 Points Total
Points
Ranking
Average Settlement Period = Average trade receivables *365 / Credit sales revenue
Easy Jet 81.2 2 68.2 2 58.4 2 6 2nd
Flybe 18.32 3 17.17 3 15.58 3 9 1st
Ryanair 103.58 1 110.43 1 127.81 1 3 3rd
Interpretation:
Flybe has reported highest raking in improvement in this ratio. As per presented table is
notable that company's ratio in 2016 is 18.32 which has increased to 17.17 in year 2017 and
15.58 in year 2018. It exhibits that company's efficiency has been improved to collect cash from
its debtors. Easy Jet's performance as per this ratio also has improved. Company's ratio in 2016
was 81.2 which is declined to 68.2 in 2017 and in year 2018 it has been reached to 58.4 days.
Interpretation:
As per overall ranking in table Flybe is most efficient in generating revenue from its total
assets. Company's ratio is increased from 4.05 to 8.1 in 2016 to 2018. Whereas in Easy Jet there
is slow improvement has been recorded from 2016 to 2018. Company's ratio in 2016 was 1.72
and in 2017 is 1.8 which has been reached at 1.81 in 2018. a slow improvement points outs
towards stability in ratio in coming period. Rayanair's sales to capital ratio ratio reported a
decline in 2017 and 2018. It has been reduced from 1.82 to 1.5 in 2017 which is further in 2018
slightly improved but it is not sufficient as from overall comparison point of view company rank
is 3rd. Company should improve this ratio by increasing revenue to make. Overall efficiency of
company to generate revenue from capital employed has declined.
Average Settlement Period: The collection period or average settlement period shows
duration of a organization's collection of duties from the market showing company's
collection productivity (Hope, Thomas and Vyas, 2013).
Ratio 2016 Points 2017 Points 2018 Points Total
Points
Ranking
Average Settlement Period = Average trade receivables *365 / Credit sales revenue
Easy Jet 81.2 2 68.2 2 58.4 2 6 2nd
Flybe 18.32 3 17.17 3 15.58 3 9 1st
Ryanair 103.58 1 110.43 1 127.81 1 3 3rd
Interpretation:
Flybe has reported highest raking in improvement in this ratio. As per presented table is
notable that company's ratio in 2016 is 18.32 which has increased to 17.17 in year 2017 and
15.58 in year 2018. It exhibits that company's efficiency has been improved to collect cash from
its debtors. Easy Jet's performance as per this ratio also has improved. Company's ratio in 2016
was 81.2 which is declined to 68.2 in 2017 and in year 2018 it has been reached to 58.4 days.
⊘ This is a preview!⊘
Do you want full access?
Subscribe today to unlock all pages.
Trusted by 1+ million students worldwide
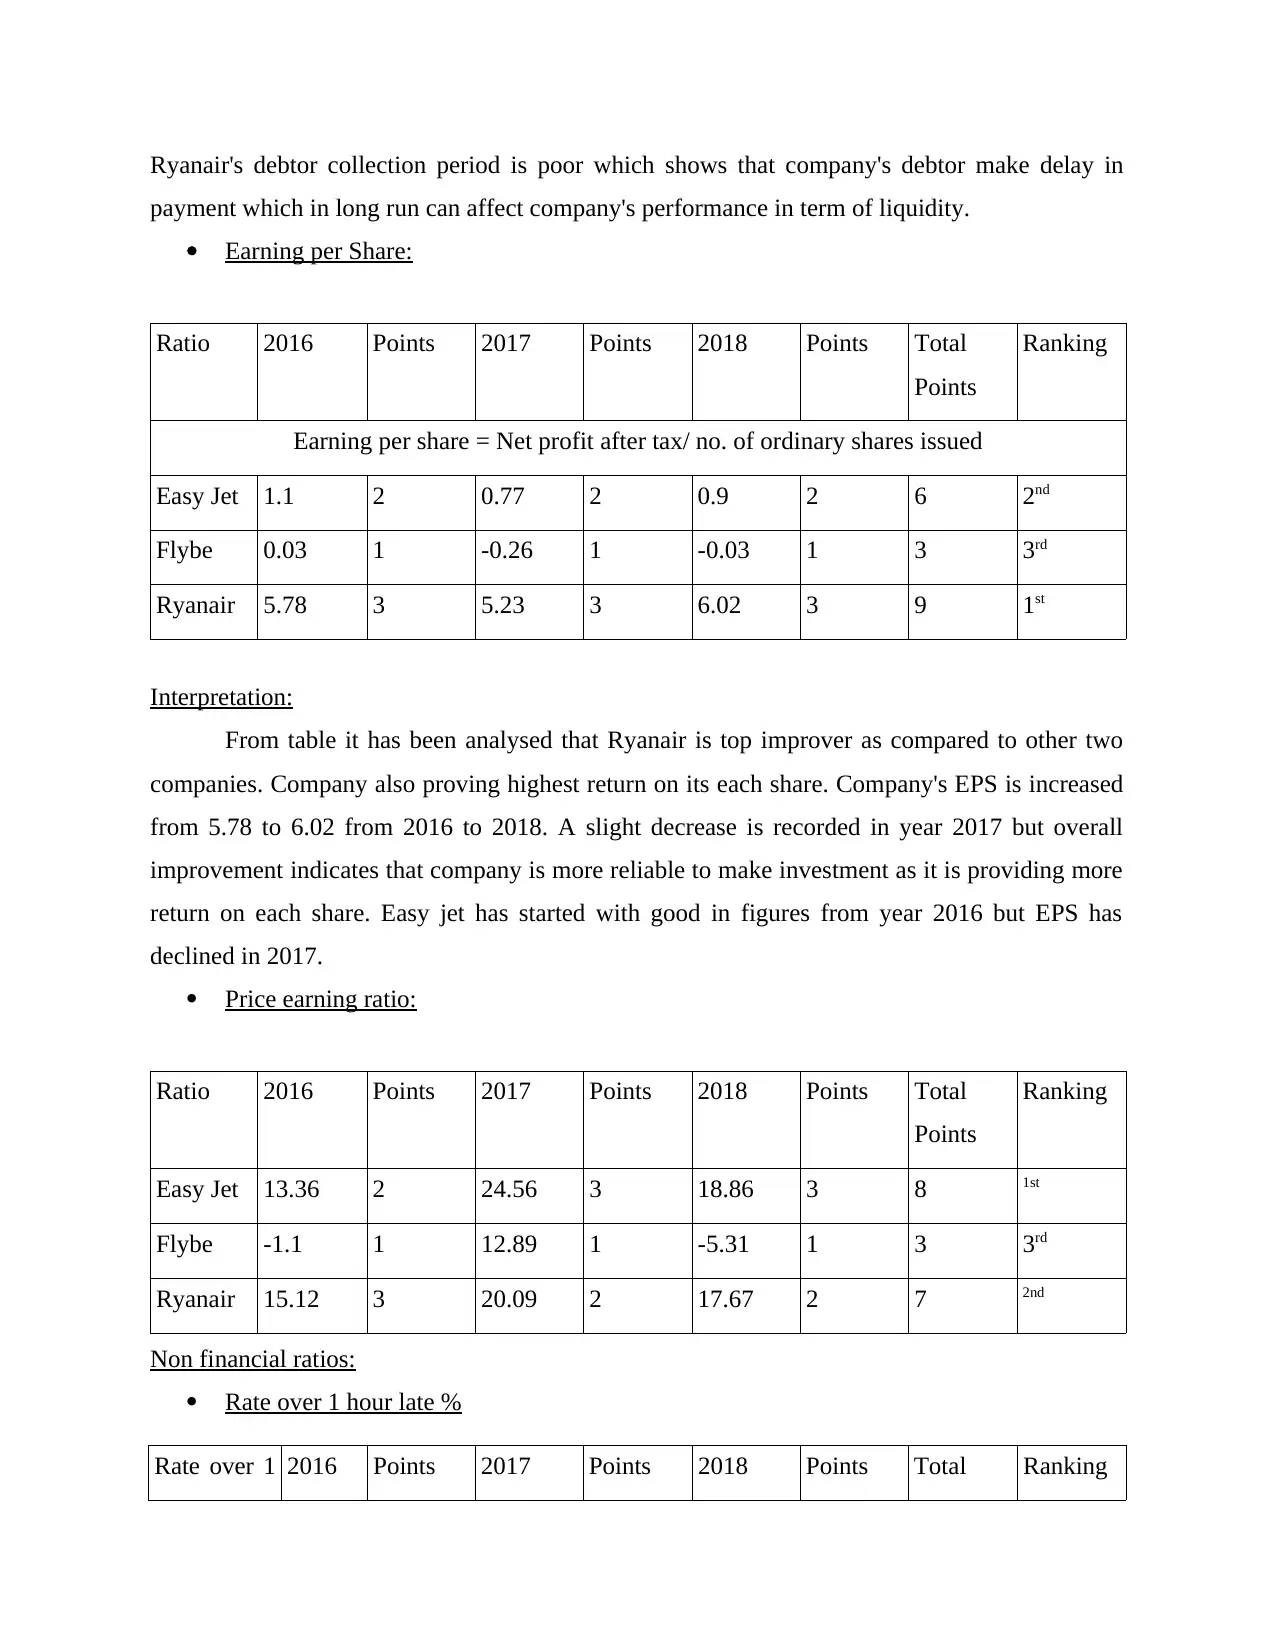
Ryanair's debtor collection period is poor which shows that company's debtor make delay in
payment which in long run can affect company's performance in term of liquidity.
Earning per Share:
Ratio 2016 Points 2017 Points 2018 Points Total
Points
Ranking
Earning per share = Net profit after tax/ no. of ordinary shares issued
Easy Jet 1.1 2 0.77 2 0.9 2 6 2nd
Flybe 0.03 1 -0.26 1 -0.03 1 3 3rd
Ryanair 5.78 3 5.23 3 6.02 3 9 1st
Interpretation:
From table it has been analysed that Ryanair is top improver as compared to other two
companies. Company also proving highest return on its each share. Company's EPS is increased
from 5.78 to 6.02 from 2016 to 2018. A slight decrease is recorded in year 2017 but overall
improvement indicates that company is more reliable to make investment as it is providing more
return on each share. Easy jet has started with good in figures from year 2016 but EPS has
declined in 2017.
Price earning ratio:
Ratio 2016 Points 2017 Points 2018 Points Total
Points
Ranking
Easy Jet 13.36 2 24.56 3 18.86 3 8 1st
Flybe -1.1 1 12.89 1 -5.31 1 3 3rd
Ryanair 15.12 3 20.09 2 17.67 2 7 2nd
Non financial ratios:
Rate over 1 hour late %
Rate over 1 2016 Points 2017 Points 2018 Points Total Ranking
Paraphrase This Document
Need a fresh take? Get an instant paraphrase of this document with our AI Paraphraser
hour late % Points
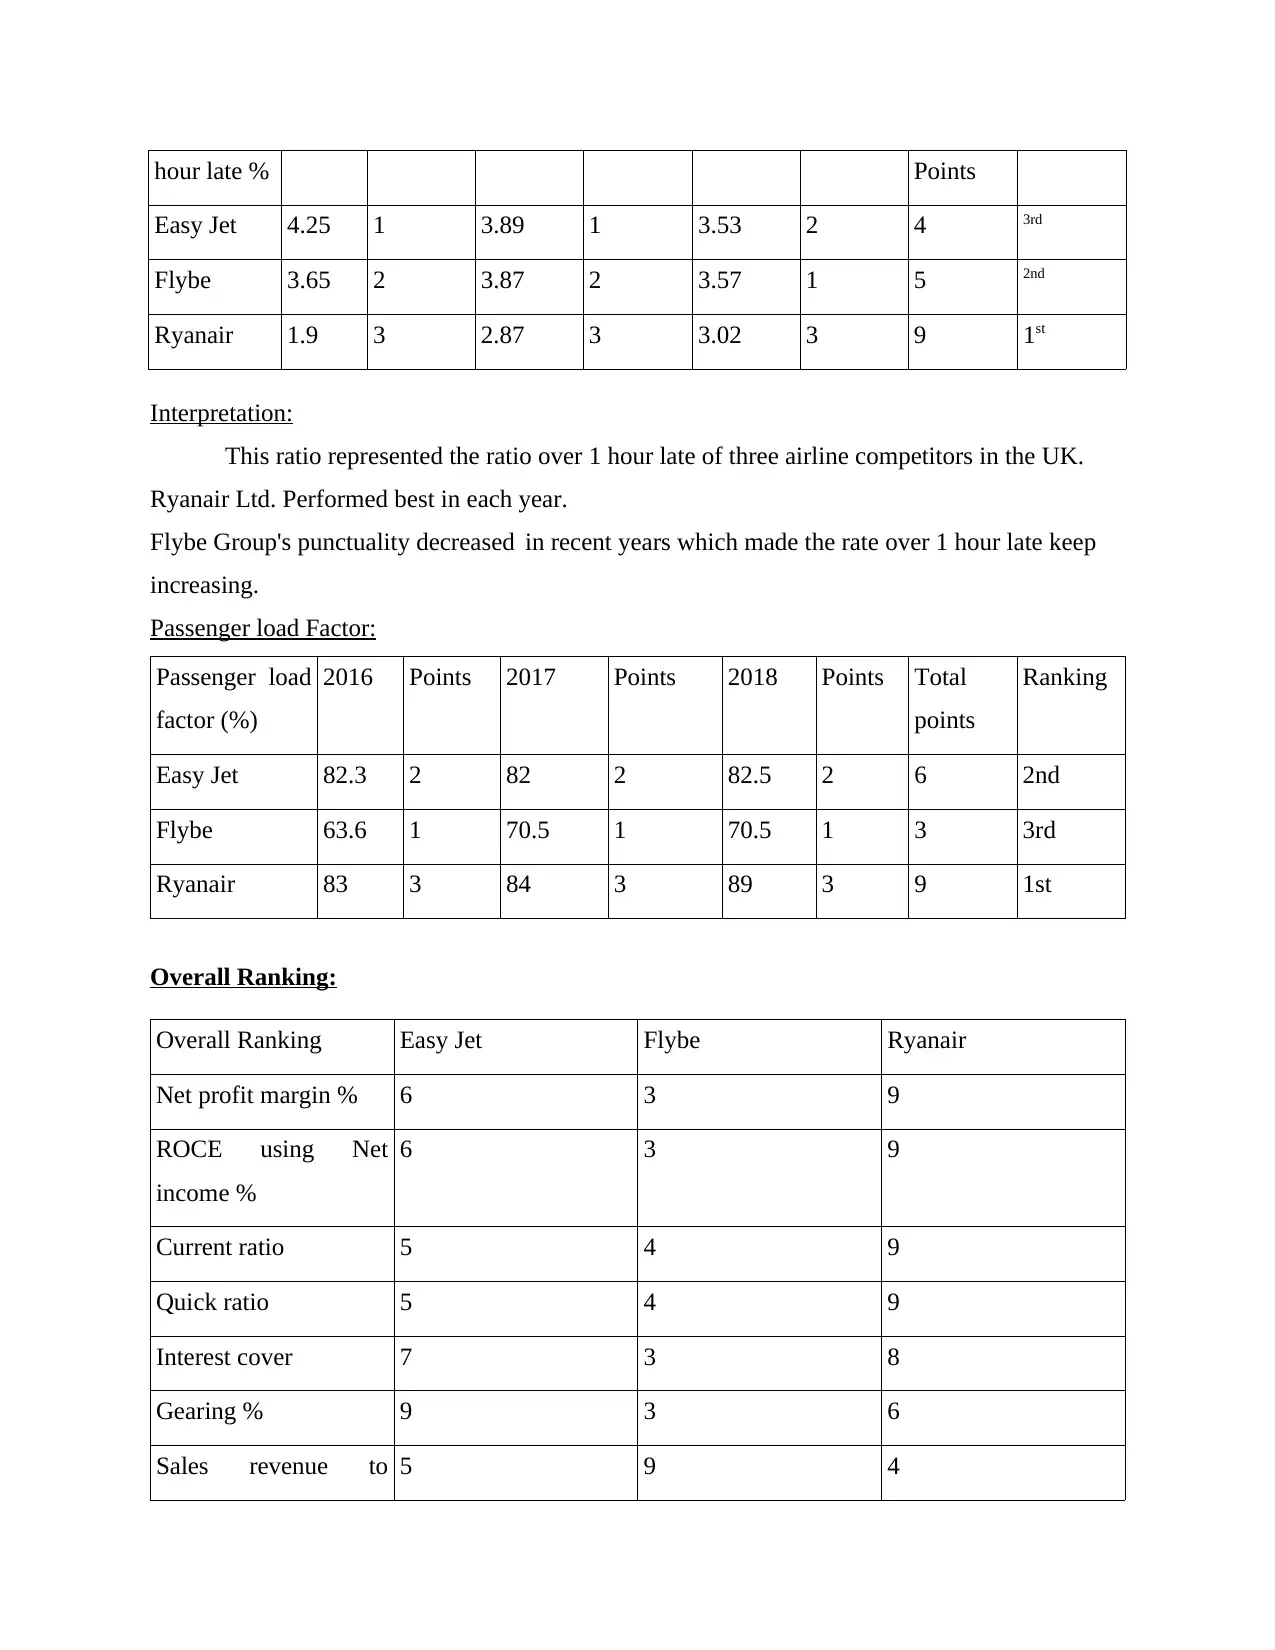
Easy Jet 4.25 1 3.89 1 3.53 2 4 3rd
Flybe 3.65 2 3.87 2 3.57 1 5 2nd
Ryanair 1.9 3 2.87 3 3.02 3 9 1st
Interpretation:
This ratio represented the ratio over 1 hour late of three airline competitors in the UK.
Ryanair Ltd. Performed best in each year.
Flybe Group's punctuality decreased in recent years which made the rate over 1 hour late keep
increasing.
Passenger load Factor:
Passenger load
factor (%)
2016 Points 2017 Points 2018 Points Total
points
Ranking
Easy Jet 82.3 2 82 2 82.5 2 6 2nd
Flybe 63.6 1 70.5 1 70.5 1 3 3rd
Ryanair 83 3 84 3 89 3 9 1st
Overall Ranking:
Overall Ranking Easy Jet Flybe Ryanair
Net profit margin % 6 3 9
ROCE using Net
income %
6 3 9
Current ratio 5 4 9
Quick ratio 5 4 9
Interest cover 7 3 8
Gearing % 9 3 6
Sales revenue to 5 9 4
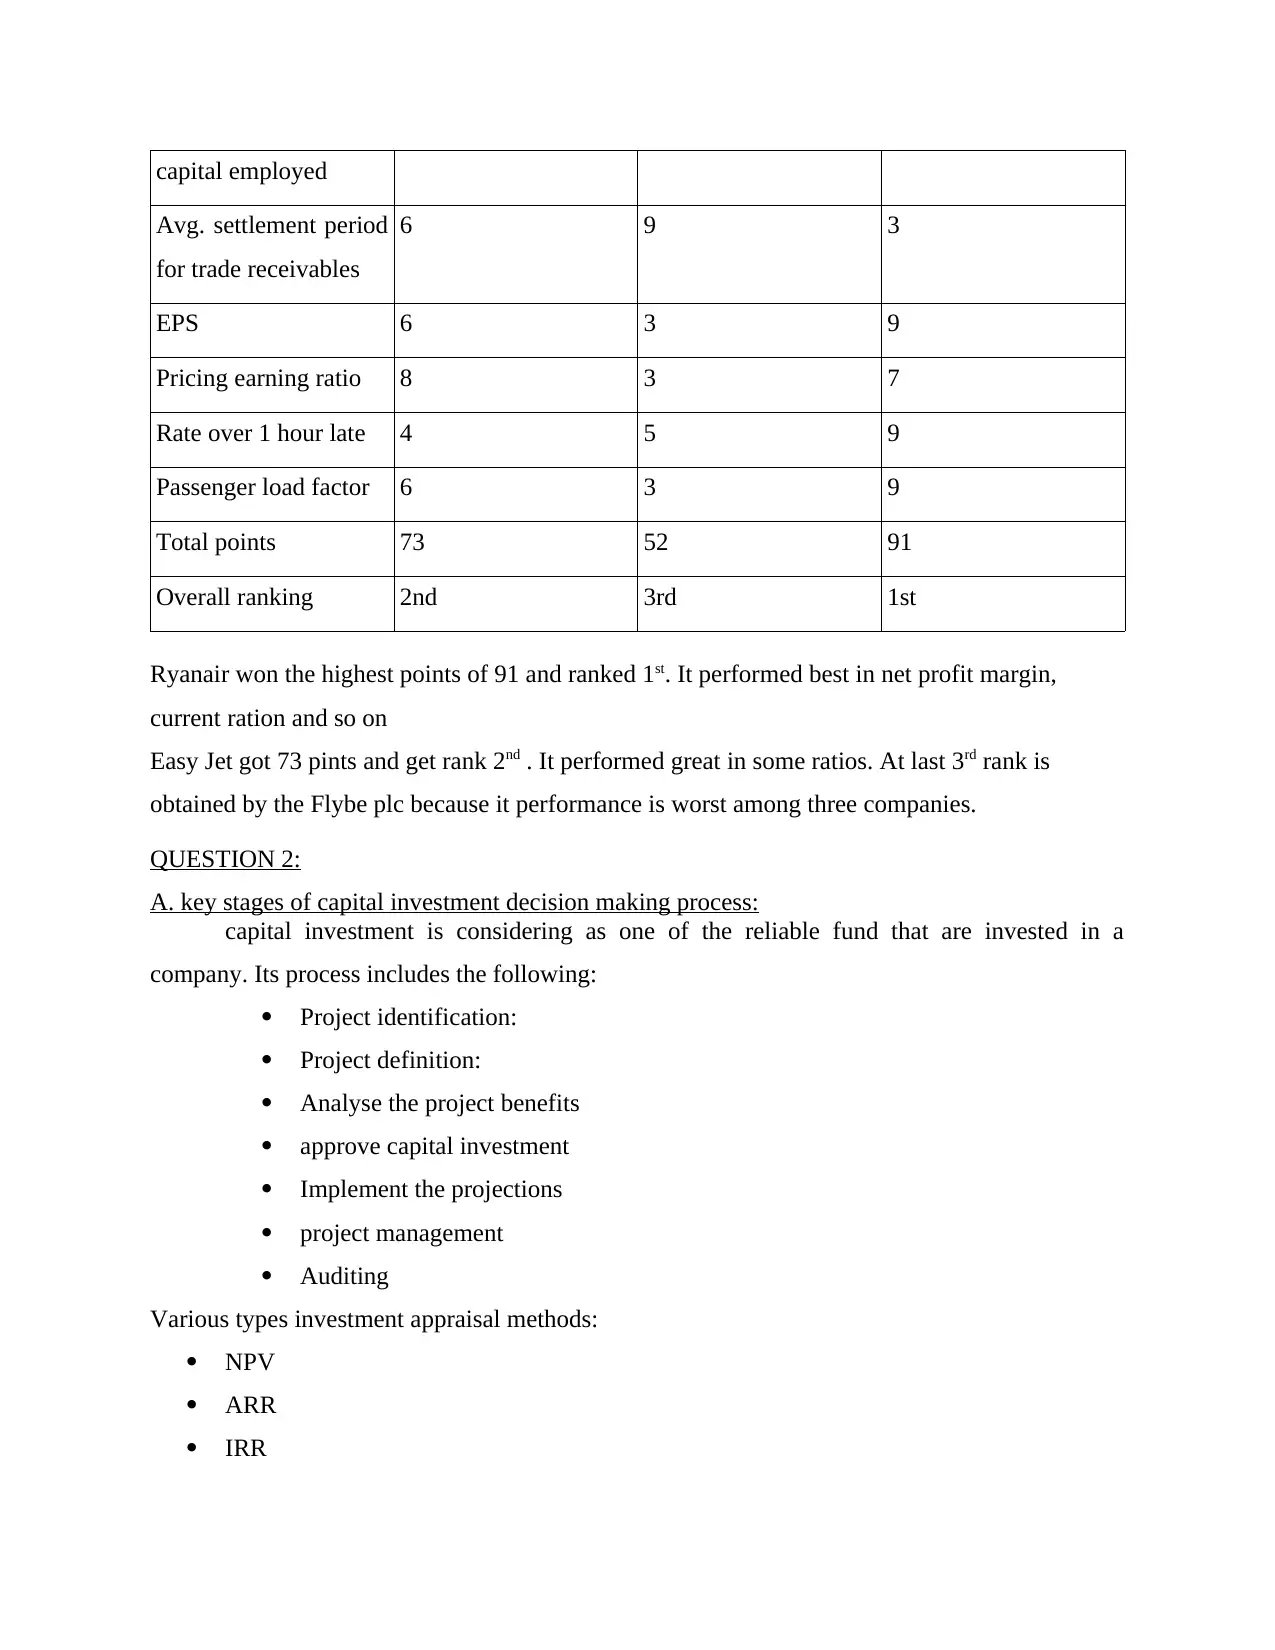
capital employed
Avg. settlement period
for trade receivables
6 9 3
EPS 6 3 9
Pricing earning ratio 8 3 7
Rate over 1 hour late 4 5 9
Passenger load factor 6 3 9
Total points 73 52 91
Overall ranking 2nd 3rd 1st
Ryanair won the highest points of 91 and ranked 1st. It performed best in net profit margin,
current ration and so on
Easy Jet got 73 pints and get rank 2nd . It performed great in some ratios. At last 3rd rank is
obtained by the Flybe plc because it performance is worst among three companies.
QUESTION 2:
A. key stages of capital investment decision making process:
capital investment is considering as one of the reliable fund that are invested in a
company. Its process includes the following:
Project identification:
Project definition:
Analyse the project benefits
approve capital investment
Implement the projections
project management
Auditing
Various types investment appraisal methods:
NPV
ARR
IRR
⊘ This is a preview!⊘
Do you want full access?
Subscribe today to unlock all pages.
Trusted by 1+ million students worldwide
1 out of 13
Related Documents


Your All-in-One AI-Powered Toolkit for Academic Success.
+13062052269
info@desklib.com
Available 24*7 on WhatsApp / Email
![[object Object]](/_next/static/media/star-bottom.7253800d.svg)
Unlock your academic potential
Copyright © 2020–2026 A2Z Services. All Rights Reserved. Developed and managed by ZUCOL.