Investment Portfolio Analysis
VerifiedAdded on 2020/02/05
|14
|2831
|66
Report
AI Summary
This assignment presents a comprehensive analysis of a diversified investment portfolio. It includes separate breakdowns for equity investments, mutual funds, bonds (specifically Treasury guilt), gold bullion, and various commodities (aluminum, copper, lead, nickel, and tin). Each section provides details on the initial investment value, current market value, capital gains, income generated, and overall return percentage. The final table summarizes the portfolio's total investment value, income, and capital gains across all asset classes.
Contribute Materials
Your contribution can guide someone’s learning journey. Share your
documents today.
INVESTMENT AND FUND
MANAGEMENT
MANAGEMENT
Secure Best Marks with AI Grader
Need help grading? Try our AI Grader for instant feedback on your assignments.

TABLE OF CONTENTS
INTRODUCTION...........................................................................................................................3
Caters for investment objectives......................................................................................................3
Objectives are not realistic...............................................................................................................3
Reasonable risk profile....................................................................................................................3
Possible impact of inflation and tax...............................................................................................11
CONCLUSION..............................................................................................................................12
REFRENCES.................................................................................................................................13
APPENDIX....................................................................................................................................14
INTRODUCTION
In the current economic environment it become very difficult to make wise investment
and there always chances of incurring loss on the invested amount. Hence, it is necessary to
form a balanced portfolio for minimizing risk and maximizing profit. In the report, beta is
considered for giving weight-age to the companies’ shares in the portfolio. Return profile is kept
as a second factors in determining weight-age if shares due to risk averse nature of the investor.
Investment is also made in the gold, base metals, bonds and mutual funds. In this way investment
is done in the balanced manner.
Caters for investment objectives
Investment objectives are determined by considering various factors and needs of an
investor. An investor always wants to keep its investment safe and thus their objective is to
maximum investment in debt instruments. Those who want to earn maximum profit by taking a
risk having an objective to make investment in shares and other good return profile securities.
Many people want to make investment in securities which give a return more than inflation rate.
The main objective of such kind of investors is to make investment in shares. Hence, there are
different factors on the basis of which investors determine their investment objectives.
Objectives are not realistic
Objectives of investment are not real in nature because these goals are determine on the
basis of current performance of different securities. These objectives are determined on the basis
of future movement in the value of financial instruments. No one knows future movements
perfectly and only predictions can made which may prove wrong in future. Thus, objectives are
prepared on the basis of assumptions and they are not realistic in nature.
Reasonable risk profile Shares- There is a high risk in shares because with small change in economy large or
sharp decline in observed in the stock market. Such increase or decrease in value of
securities may happen consistently for specific time period. The rate of decline in shares
price is always higher then rate of increase in value of same security. Thus, there is very
risk profile of shares.
Mutual fund- Most of the mutual fund schemes have major or small proportion of shares
in the portfolio and debt instruments give a low return on investment. Hence, with fall in
stock market mutual fund schemes also give low return to the investors but there are less
chances of negative return on the MF schemes. Hence, risk profile is moderate in case of
mutual fund schemes. Commodities- There is very high risk in commodities and trading is done in lot size and
due to this reason value of single trade is very high. Hence, investors earn very high
amount of profit and incurred large amount of loss in the commodities. Thus, investment
in commodities is highly risky then shares. Bond- There is inverse relationship between bond and equity market because when latter
market decline bonds value increase and they start giving positive returns. Investors earn
a fixed rate of interest on bond and due to these reasons there is low risk on bonds.
Bullion- It is safe investment avenue especially when economy is declining. When
economy decline stock market index fall and people start making investment in gold.
When economy is growing then also gold increase. But it does not mean that every time
gold is safe because time to time decline is observed in gold price. Hence, there is
moderate risk in gold.
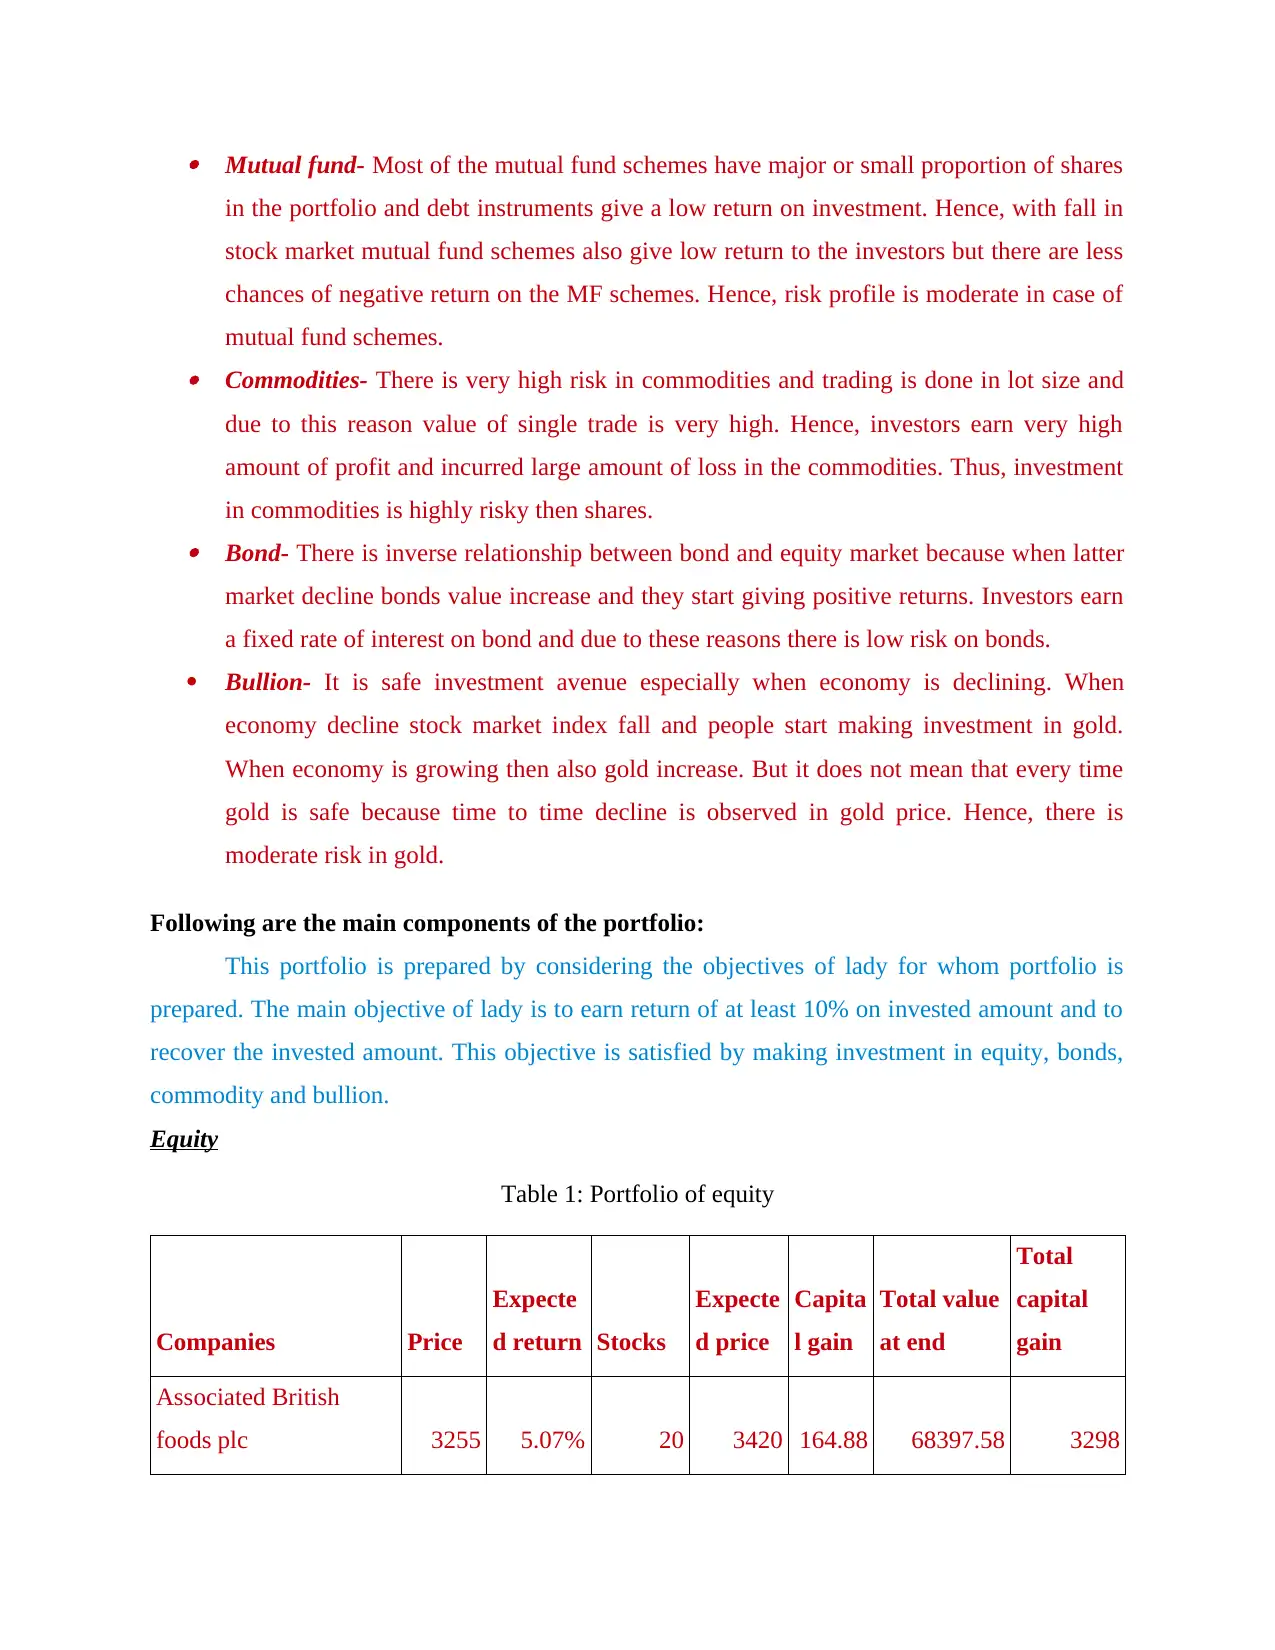
Following are the main components of the portfolio:
This portfolio is prepared by considering the objectives of lady for whom portfolio is
prepared. The main objective of lady is to earn return of at least 10% on invested amount and to
recover the invested amount. This objective is satisfied by making investment in equity, bonds,
commodity and bullion.
Equity
Table 1: Portfolio of equity
Companies Price
Expecte
d return Stocks
Expecte
d price
Capita
l gain
Total value
at end
Total
capital
gain
Associated British
foods plc 3255 5.07% 20 3420 164.88 68397.58 3298
in the portfolio and debt instruments give a low return on investment. Hence, with fall in
stock market mutual fund schemes also give low return to the investors but there are less
chances of negative return on the MF schemes. Hence, risk profile is moderate in case of
mutual fund schemes. Commodities- There is very high risk in commodities and trading is done in lot size and
due to this reason value of single trade is very high. Hence, investors earn very high
amount of profit and incurred large amount of loss in the commodities. Thus, investment
in commodities is highly risky then shares. Bond- There is inverse relationship between bond and equity market because when latter
market decline bonds value increase and they start giving positive returns. Investors earn
a fixed rate of interest on bond and due to these reasons there is low risk on bonds.
Bullion- It is safe investment avenue especially when economy is declining. When
economy decline stock market index fall and people start making investment in gold.
When economy is growing then also gold increase. But it does not mean that every time
gold is safe because time to time decline is observed in gold price. Hence, there is
moderate risk in gold.
Following are the main components of the portfolio:
This portfolio is prepared by considering the objectives of lady for whom portfolio is
prepared. The main objective of lady is to earn return of at least 10% on invested amount and to
recover the invested amount. This objective is satisfied by making investment in equity, bonds,
commodity and bullion.
Equity
Table 1: Portfolio of equity
Companies Price
Expecte
d return Stocks
Expecte
d price
Capita
l gain
Total value
at end
Total
capital
gain
Associated British
foods plc 3255 5.07% 20 3420 164.88 68397.58 3298
Secure Best Marks with AI Grader
Need help grading? Try our AI Grader for instant feedback on your assignments.
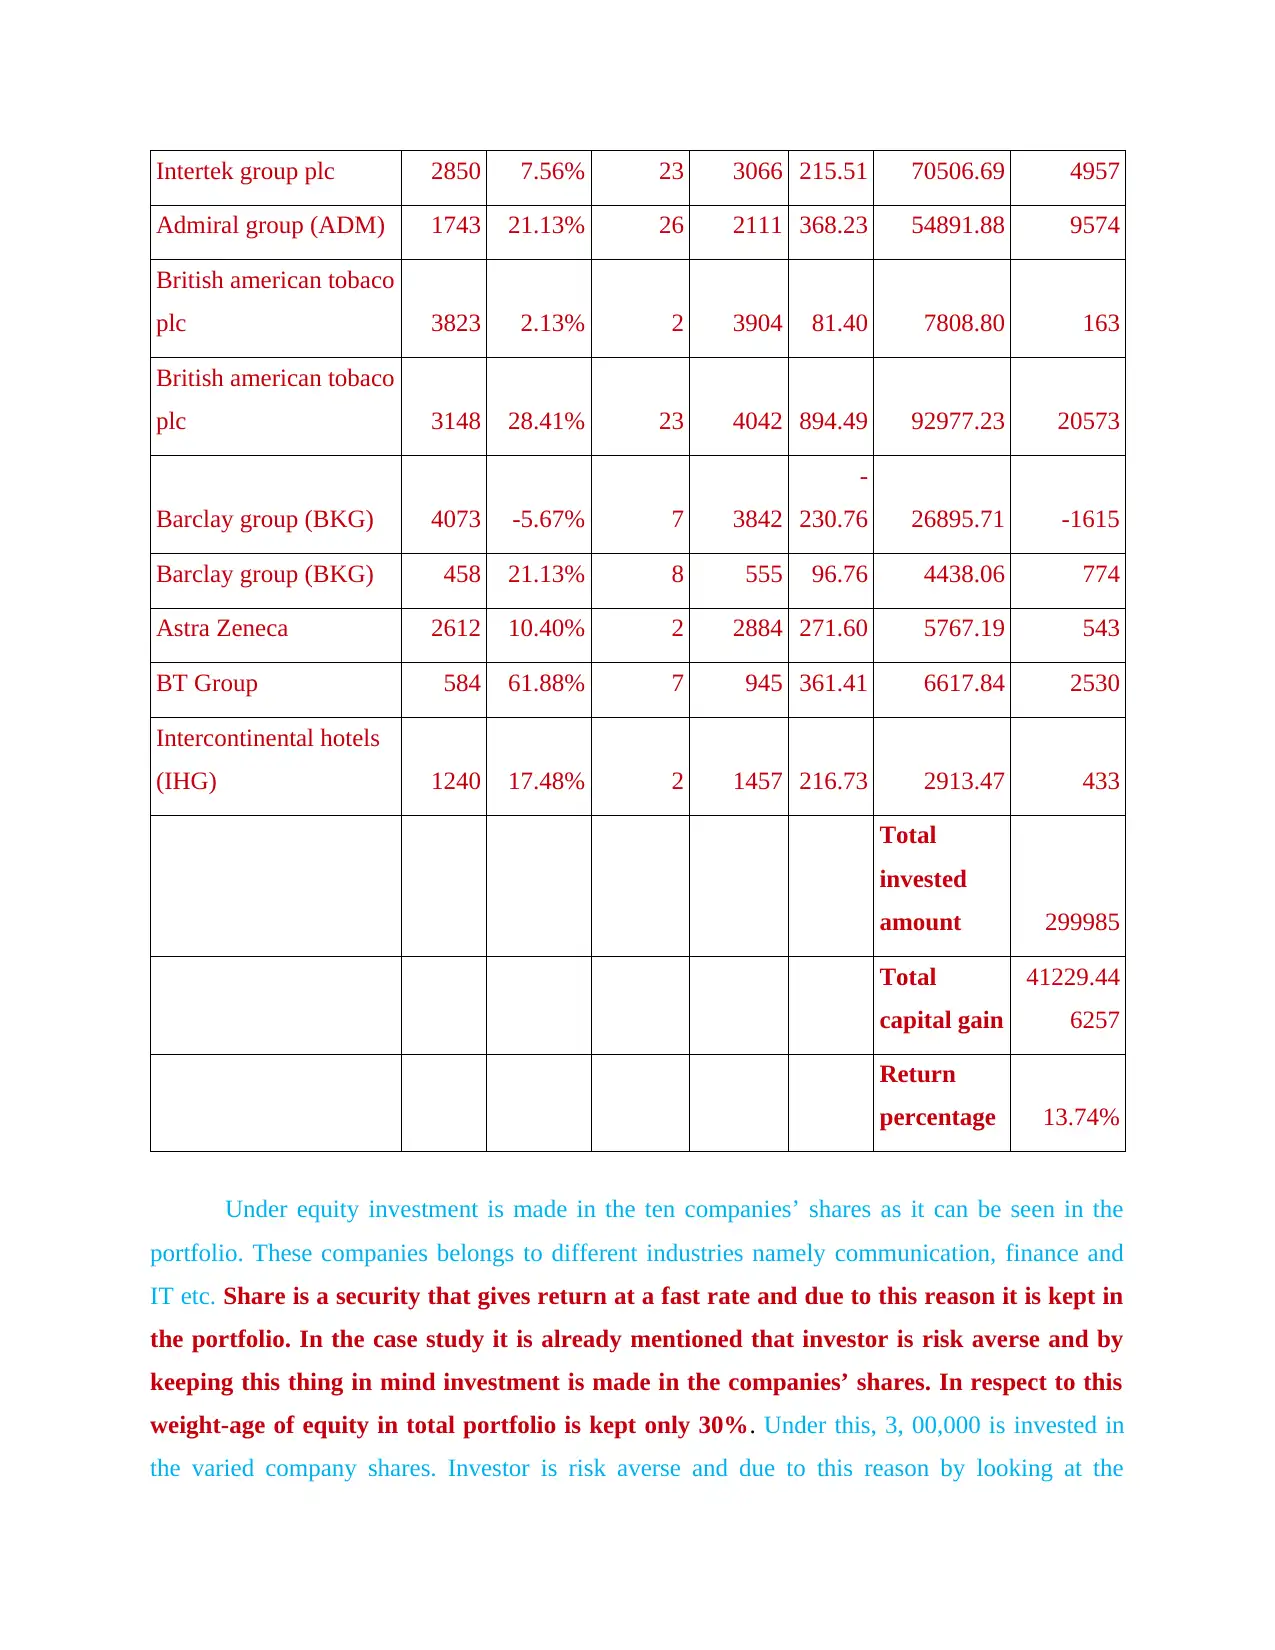
Intertek group plc 2850 7.56% 23 3066 215.51 70506.69 4957
Admiral group (ADM) 1743 21.13% 26 2111 368.23 54891.88 9574
British american tobaco
plc 3823 2.13% 2 3904 81.40 7808.80 163
British american tobaco
plc 3148 28.41% 23 4042 894.49 92977.23 20573
Barclay group (BKG) 4073 -5.67% 7 3842
-
230.76 26895.71 -1615
Barclay group (BKG) 458 21.13% 8 555 96.76 4438.06 774
Astra Zeneca 2612 10.40% 2 2884 271.60 5767.19 543
BT Group 584 61.88% 7 945 361.41 6617.84 2530
Intercontinental hotels
(IHG) 1240 17.48% 2 1457 216.73 2913.47 433
Total
invested
amount 299985
Total
capital gain
41229.44
6257
Return
percentage 13.74%
Under equity investment is made in the ten companies’ shares as it can be seen in the
portfolio. These companies belongs to different industries namely communication, finance and
IT etc. Share is a security that gives return at a fast rate and due to this reason it is kept in
the portfolio. In the case study it is already mentioned that investor is risk averse and by
keeping this thing in mind investment is made in the companies’ shares. In respect to this
weight-age of equity in total portfolio is kept only 30%. Under this, 3, 00,000 is invested in
the varied company shares. Investor is risk averse and due to this reason by looking at the
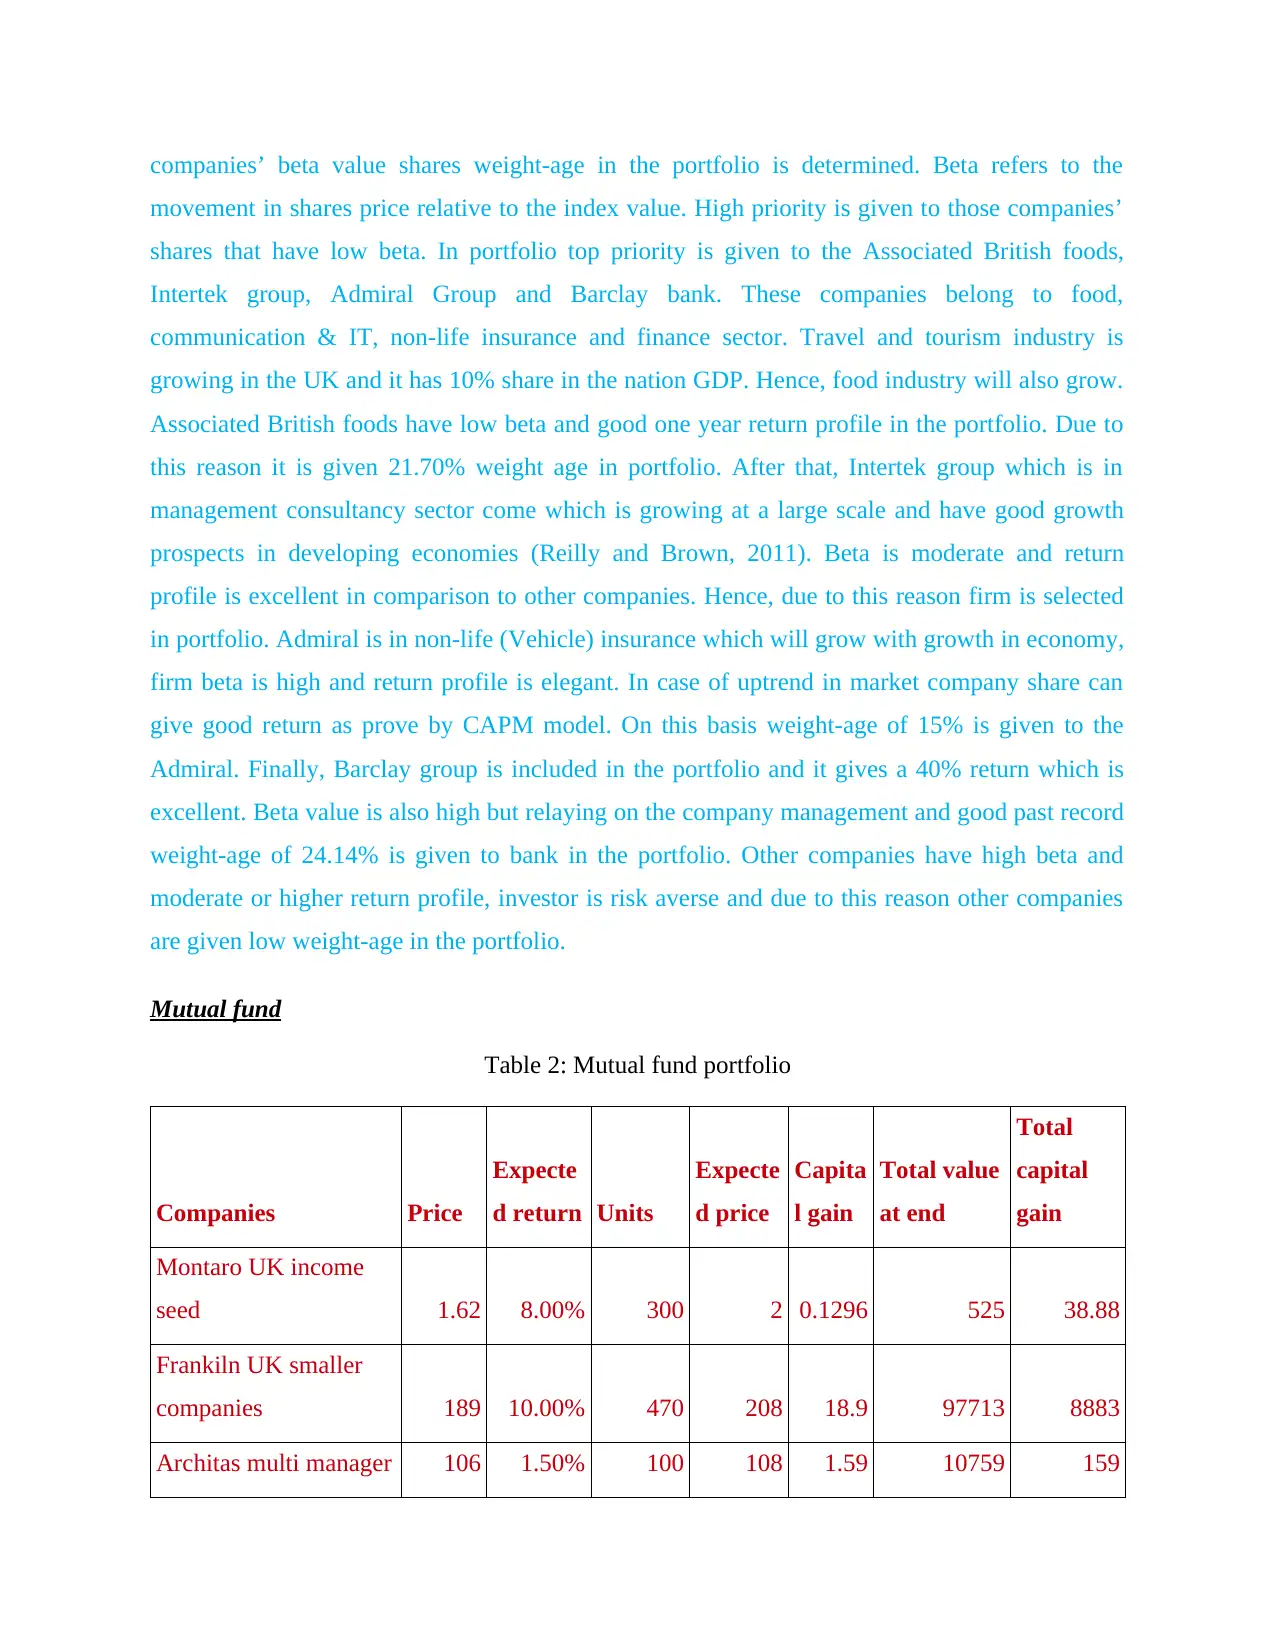
companies’ beta value shares weight-age in the portfolio is determined. Beta refers to the
movement in shares price relative to the index value. High priority is given to those companies’
shares that have low beta. In portfolio top priority is given to the Associated British foods,
Intertek group, Admiral Group and Barclay bank. These companies belong to food,
communication & IT, non-life insurance and finance sector. Travel and tourism industry is
growing in the UK and it has 10% share in the nation GDP. Hence, food industry will also grow.
Associated British foods have low beta and good one year return profile in the portfolio. Due to
this reason it is given 21.70% weight age in portfolio. After that, Intertek group which is in
management consultancy sector come which is growing at a large scale and have good growth
prospects in developing economies (Reilly and Brown, 2011). Beta is moderate and return
profile is excellent in comparison to other companies. Hence, due to this reason firm is selected
in portfolio. Admiral is in non-life (Vehicle) insurance which will grow with growth in economy,
firm beta is high and return profile is elegant. In case of uptrend in market company share can
give good return as prove by CAPM model. On this basis weight-age of 15% is given to the
Admiral. Finally, Barclay group is included in the portfolio and it gives a 40% return which is
excellent. Beta value is also high but relaying on the company management and good past record
weight-age of 24.14% is given to bank in the portfolio. Other companies have high beta and
moderate or higher return profile, investor is risk averse and due to this reason other companies
are given low weight-age in the portfolio.
Mutual fund
Table 2: Mutual fund portfolio
Companies Price
Expecte
d return Units
Expecte
d price
Capita
l gain
Total value
at end
Total
capital
gain
Montaro UK income
seed 1.62 8.00% 300 2 0.1296 525 38.88
Frankiln UK smaller
companies 189 10.00% 470 208 18.9 97713 8883
Architas multi manager 106 1.50% 100 108 1.59 10759 159
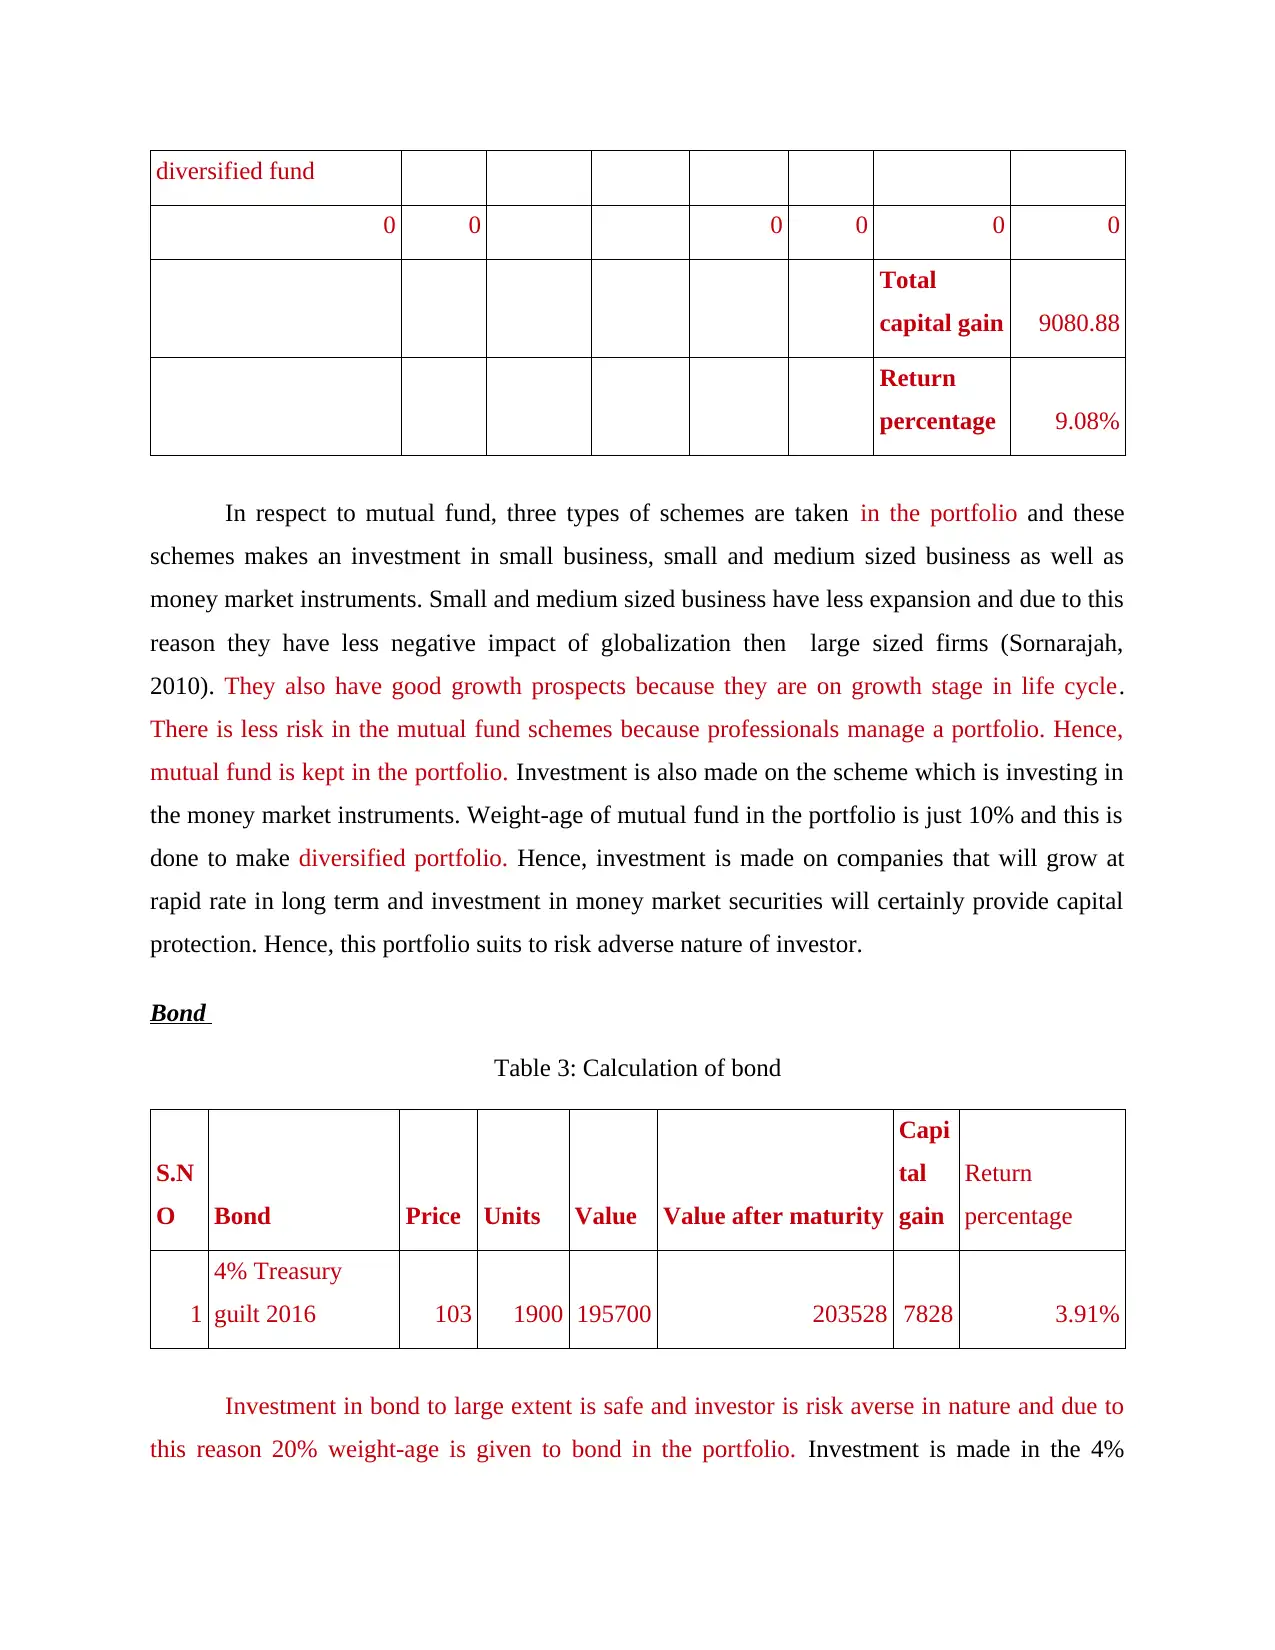
diversified fund
0 0 0 0 0 0
Total
capital gain 9080.88
Return
percentage 9.08%
In respect to mutual fund, three types of schemes are taken in the portfolio and these
schemes makes an investment in small business, small and medium sized business as well as
money market instruments. Small and medium sized business have less expansion and due to this
reason they have less negative impact of globalization then large sized firms (Sornarajah,
2010). They also have good growth prospects because they are on growth stage in life cycle.
There is less risk in the mutual fund schemes because professionals manage a portfolio. Hence,
mutual fund is kept in the portfolio. Investment is also made on the scheme which is investing in
the money market instruments. Weight-age of mutual fund in the portfolio is just 10% and this is
done to make diversified portfolio. Hence, investment is made on companies that will grow at
rapid rate in long term and investment in money market securities will certainly provide capital
protection. Hence, this portfolio suits to risk adverse nature of investor.
Bond
Table 3: Calculation of bond
S.N
O Bond Price Units Value Value after maturity
Capi
tal
gain
Return
percentage
1
4% Treasury
guilt 2016 103 1900 195700 203528 7828 3.91%
Investment in bond to large extent is safe and investor is risk averse in nature and due to
this reason 20% weight-age is given to bond in the portfolio. Investment is made in the 4%
Paraphrase This Document
Need a fresh take? Get an instant paraphrase of this document with our AI Paraphraser
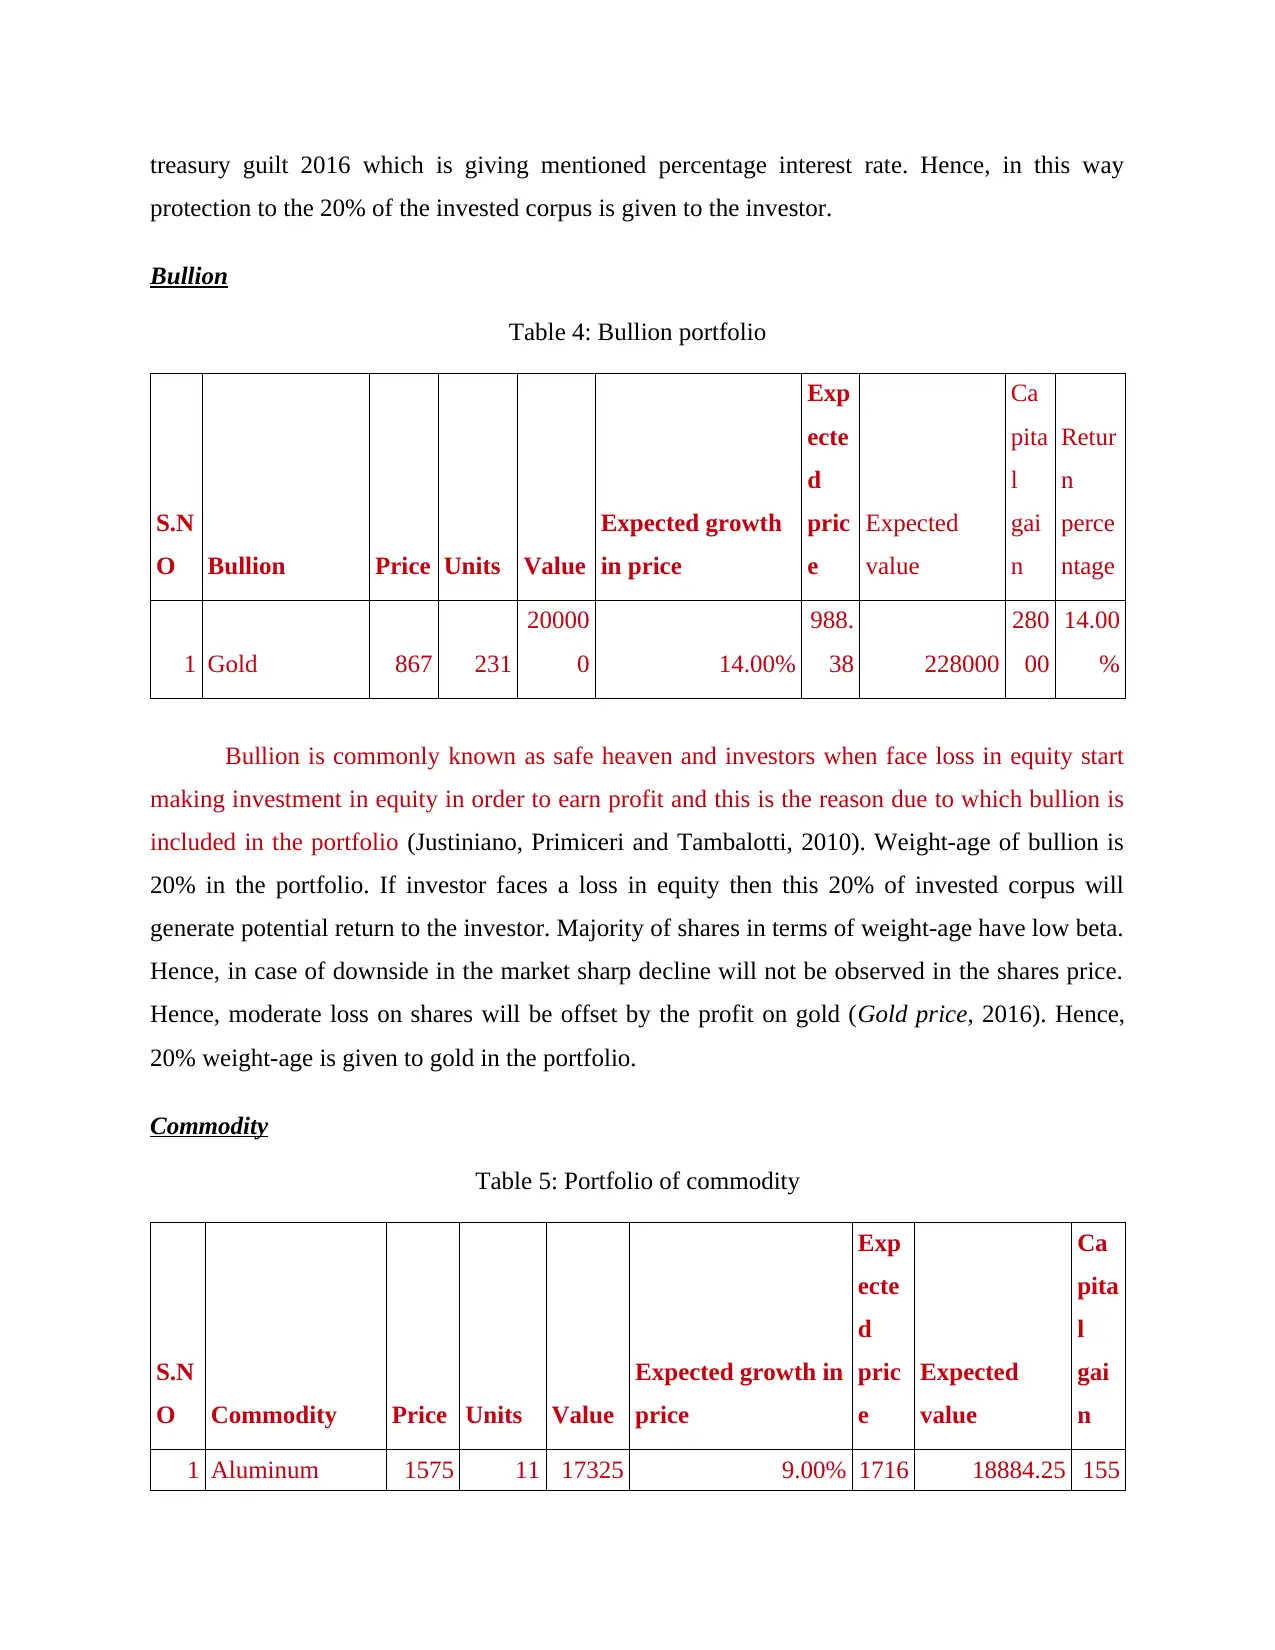
treasury guilt 2016 which is giving mentioned percentage interest rate. Hence, in this way
protection to the 20% of the invested corpus is given to the investor.
Bullion
Table 4: Bullion portfolio
S.N
O Bullion Price Units Value
Expected growth
in price
Exp
ecte
d
pric
e
Expected
value
Ca
pita
l
gai
n
Retur
n
perce
ntage
1 Gold 867 231
20000
0 14.00%
988.
38 228000
280
00
14.00
%
Bullion is commonly known as safe heaven and investors when face loss in equity start
making investment in equity in order to earn profit and this is the reason due to which bullion is
included in the portfolio (Justiniano, Primiceri and Tambalotti, 2010). Weight-age of bullion is
20% in the portfolio. If investor faces a loss in equity then this 20% of invested corpus will
generate potential return to the investor. Majority of shares in terms of weight-age have low beta.
Hence, in case of downside in the market sharp decline will not be observed in the shares price.
Hence, moderate loss on shares will be offset by the profit on gold (Gold price, 2016). Hence,
20% weight-age is given to gold in the portfolio.
Commodity
Table 5: Portfolio of commodity
S.N
O Commodity Price Units Value
Expected growth in
price
Exp
ecte
d
pric
e
Expected
value
Ca
pita
l
gai
n
1 Aluminum 1575 11 17325 9.00% 1716 18884.25 155
.75
9.2
5
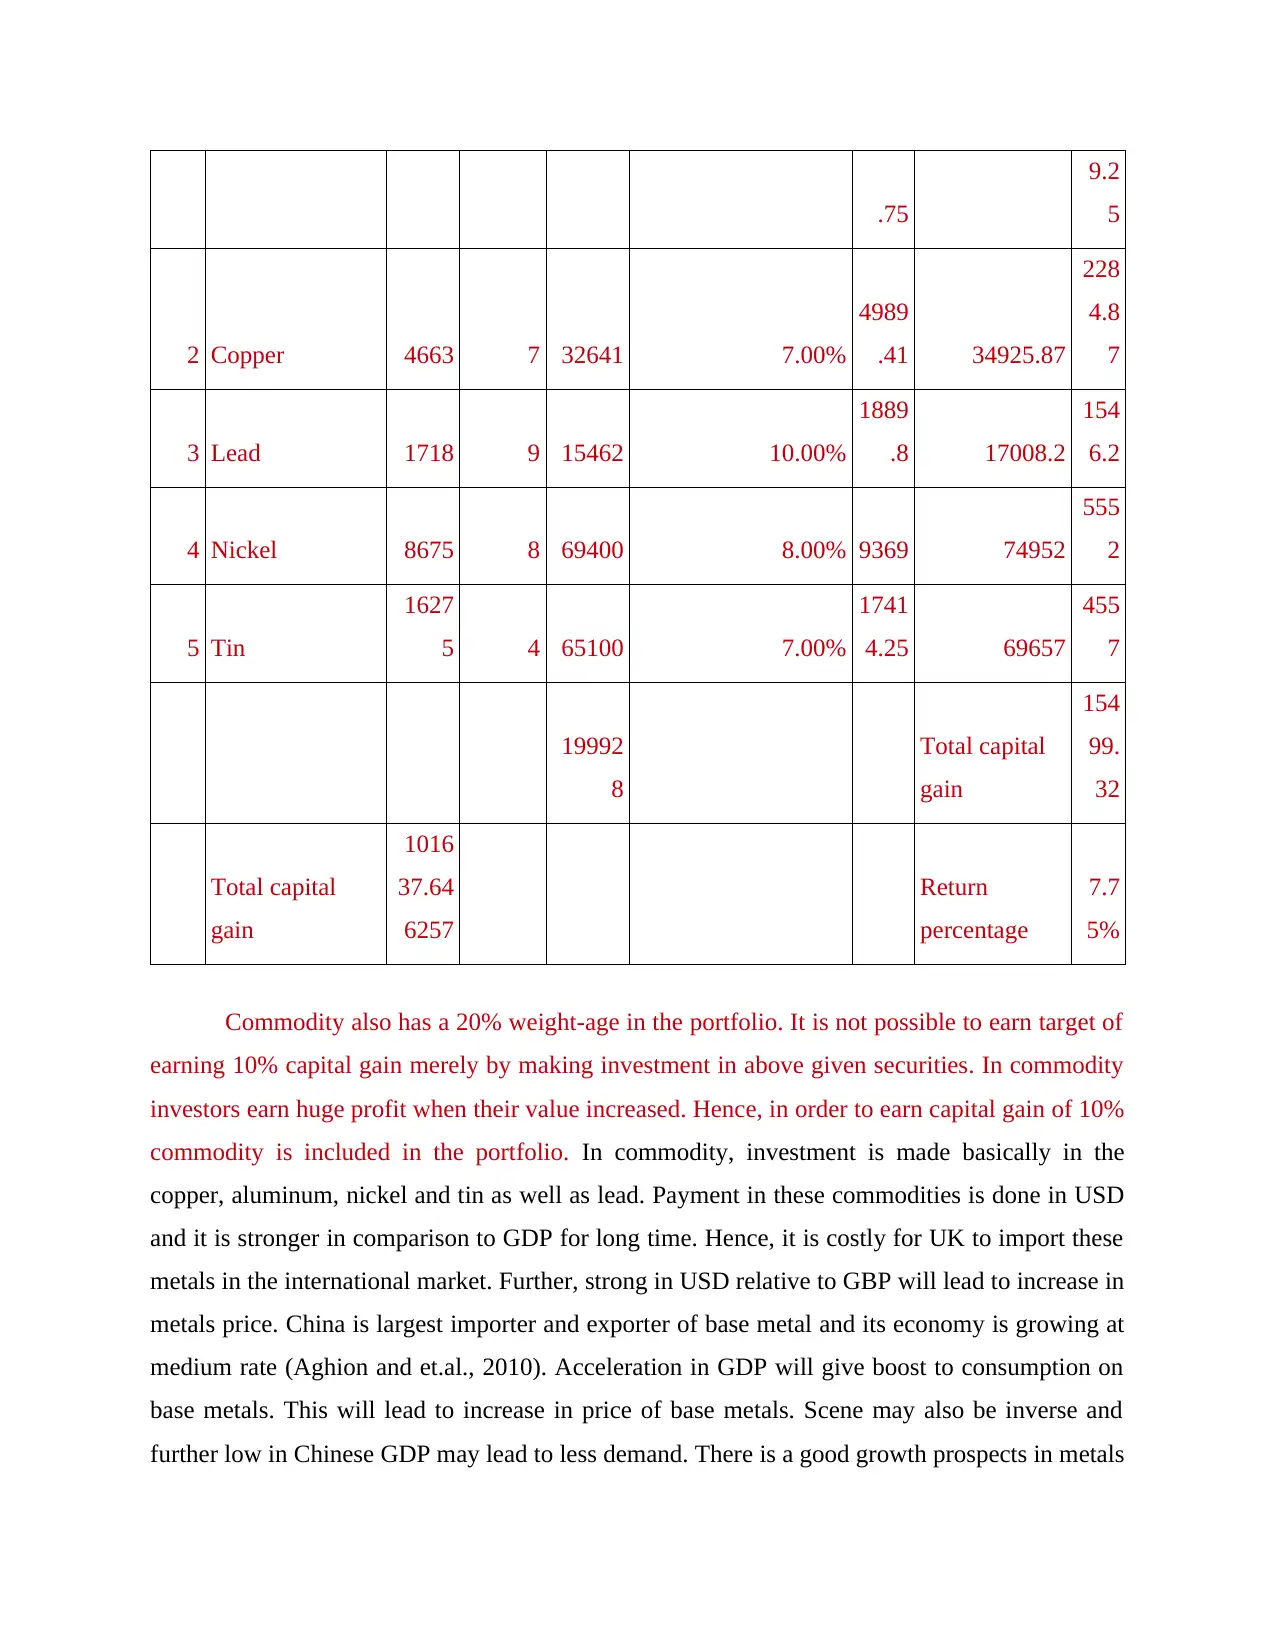
2 Copper 4663 7 32641 7.00%
4989
.41 34925.87
228
4.8
7
3 Lead 1718 9 15462 10.00%
1889
.8 17008.2
154
6.2
4 Nickel 8675 8 69400 8.00% 9369 74952
555
2
5 Tin
1627
5 4 65100 7.00%
1741
4.25 69657
455
7
19992
8
Total capital
gain
154
99.
32
Total capital
gain
1016
37.64
6257
Return
percentage
7.7
5%
Commodity also has a 20% weight-age in the portfolio. It is not possible to earn target of
earning 10% capital gain merely by making investment in above given securities. In commodity
investors earn huge profit when their value increased. Hence, in order to earn capital gain of 10%
commodity is included in the portfolio. In commodity, investment is made basically in the
copper, aluminum, nickel and tin as well as lead. Payment in these commodities is done in USD
and it is stronger in comparison to GDP for long time. Hence, it is costly for UK to import these
metals in the international market. Further, strong in USD relative to GBP will lead to increase in
metals price. China is largest importer and exporter of base metal and its economy is growing at
medium rate (Aghion and et.al., 2010). Acceleration in GDP will give boost to consumption on
base metals. This will lead to increase in price of base metals. Scene may also be inverse and
further low in Chinese GDP may lead to less demand. There is a good growth prospects in metals
9.2
5
2 Copper 4663 7 32641 7.00%
4989
.41 34925.87
228
4.8
7
3 Lead 1718 9 15462 10.00%
1889
.8 17008.2
154
6.2
4 Nickel 8675 8 69400 8.00% 9369 74952
555
2
5 Tin
1627
5 4 65100 7.00%
1741
4.25 69657
455
7
19992
8
Total capital
gain
154
99.
32
Total capital
gain
1016
37.64
6257
Return
percentage
7.7
5%
Commodity also has a 20% weight-age in the portfolio. It is not possible to earn target of
earning 10% capital gain merely by making investment in above given securities. In commodity
investors earn huge profit when their value increased. Hence, in order to earn capital gain of 10%
commodity is included in the portfolio. In commodity, investment is made basically in the
copper, aluminum, nickel and tin as well as lead. Payment in these commodities is done in USD
and it is stronger in comparison to GDP for long time. Hence, it is costly for UK to import these
metals in the international market. Further, strong in USD relative to GBP will lead to increase in
metals price. China is largest importer and exporter of base metal and its economy is growing at
medium rate (Aghion and et.al., 2010). Acceleration in GDP will give boost to consumption on
base metals. This will lead to increase in price of base metals. Scene may also be inverse and
further low in Chinese GDP may lead to less demand. There is a good growth prospects in metals
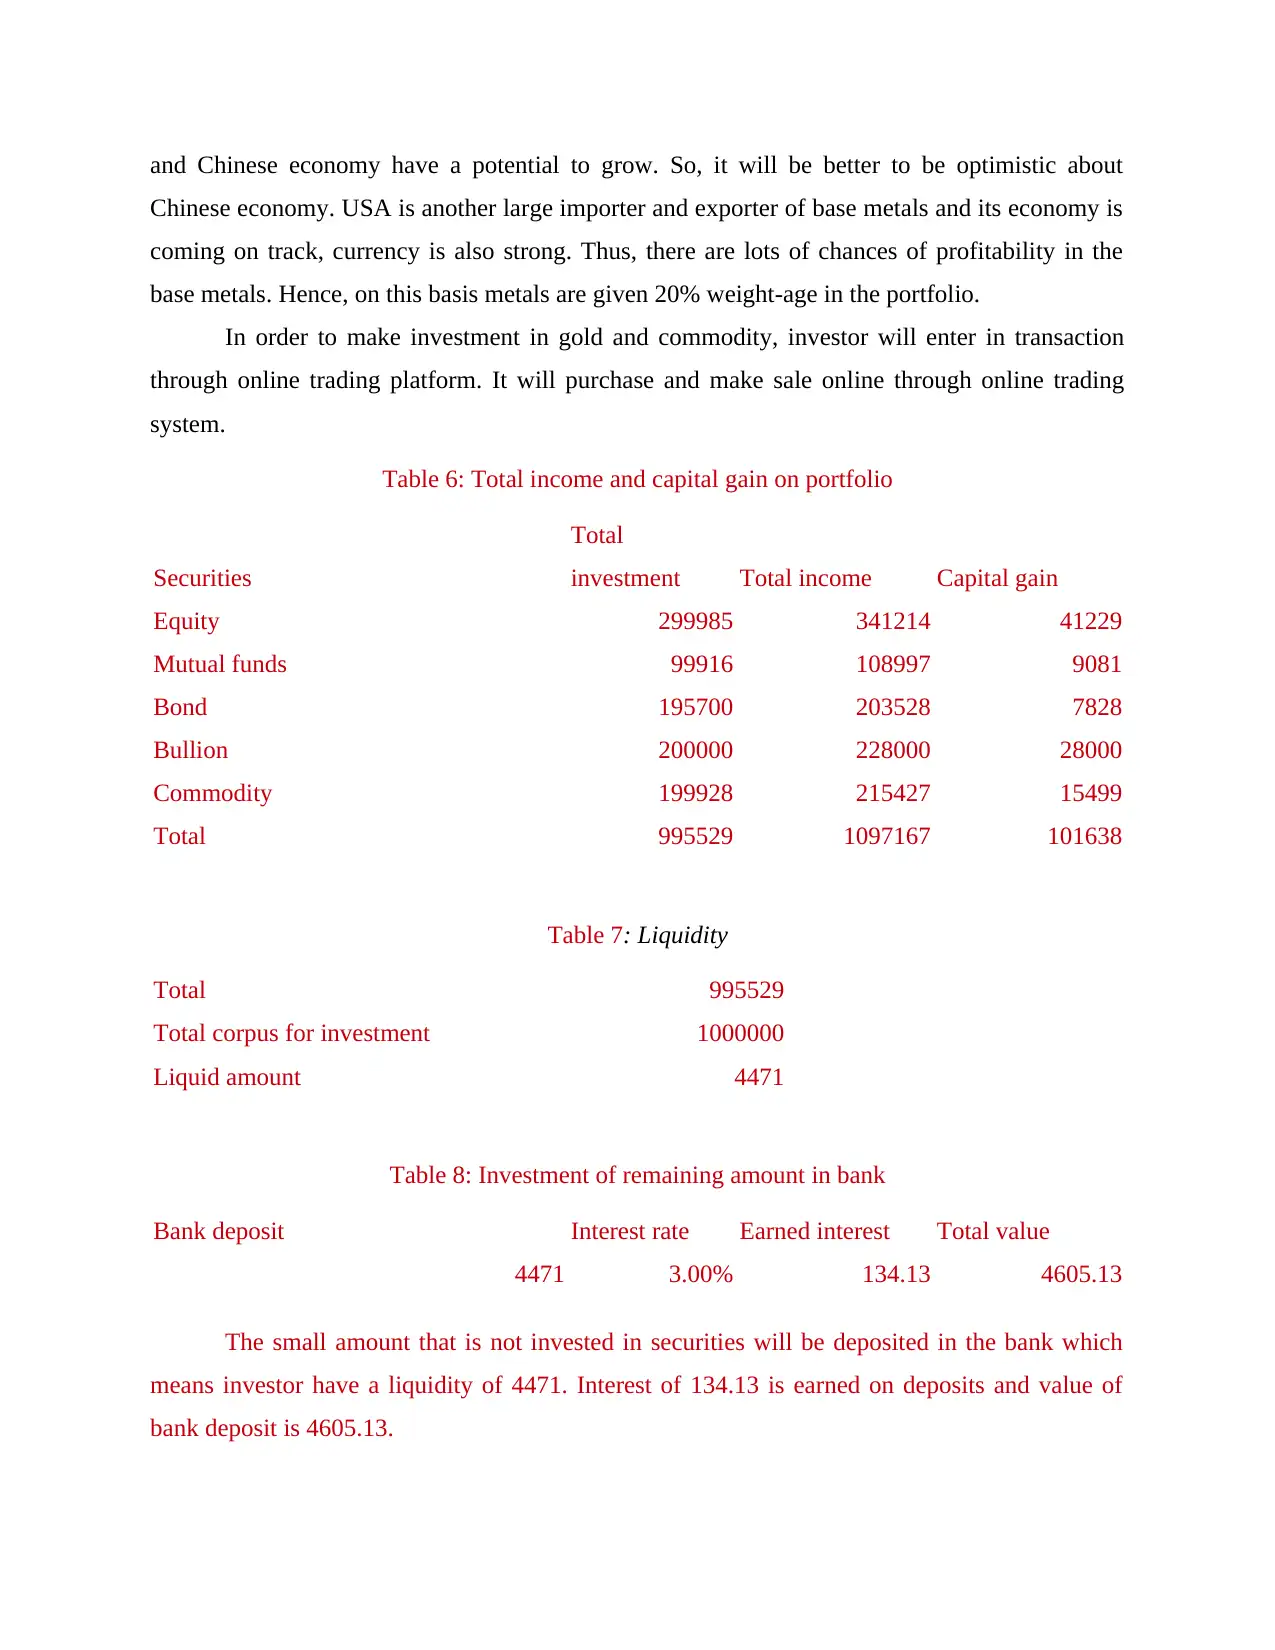
and Chinese economy have a potential to grow. So, it will be better to be optimistic about
Chinese economy. USA is another large importer and exporter of base metals and its economy is
coming on track, currency is also strong. Thus, there are lots of chances of profitability in the
base metals. Hence, on this basis metals are given 20% weight-age in the portfolio.
In order to make investment in gold and commodity, investor will enter in transaction
through online trading platform. It will purchase and make sale online through online trading
system.
Table 6: Total income and capital gain on portfolio
Securities
Total
investment Total income Capital gain
Equity 299985 341214 41229
Mutual funds 99916 108997 9081
Bond 195700 203528 7828
Bullion 200000 228000 28000
Commodity 199928 215427 15499
Total 995529 1097167 101638
Table 7: Liquidity
Total 995529
Total corpus for investment 1000000
Liquid amount 4471
Table 8: Investment of remaining amount in bank
Bank deposit Interest rate Earned interest Total value
4471 3.00% 134.13 4605.13
The small amount that is not invested in securities will be deposited in the bank which
means investor have a liquidity of 4471. Interest of 134.13 is earned on deposits and value of
bank deposit is 4605.13.
Secure Best Marks with AI Grader
Need help grading? Try our AI Grader for instant feedback on your assignments.

Possible impact of inflation and tax
If inflation rate get increased then it means that economy is not in good condition.
Further, if government and central bank failed to curb elevation in inflation rate then it indicates
that these bodies are not getting success in bringing economy on track. Hence, possibility of
further decline in economy growth rate increased. In such a situation sale of security started and
value of instruments decline. Thus, investors earn less capital gain on invested amount. If capital
gain tax is increased then investors will earn less capital gain on sale of securities. Hence, in this
way both inflation and tax rate affect percentage of actual return that is earned by the investor on
investment.

CONCLUSION
From the above report, it can be concluded that investment must be made in a diversified
manner after identifying the growth prospects in different securities. By doing so, risk can be
minimized and profit can be maximized.
From the above report, it can be concluded that investment must be made in a diversified
manner after identifying the growth prospects in different securities. By doing so, risk can be
minimized and profit can be maximized.
REFRENCES
Books & journals
Aghion, P. et. al., 2010. Volatility and growth: Credit constraints and the composition of
investment. Journal of Monetary Economics. 57(3). pp.246-265.
Justiniano, A., Primiceri, G.E. and Tambalotti, A., 2010. Investment shocks and business cycles.
Journal of Monetary Economics. 57(2). pp.132-145.
Reilly, F. and Brown, K., 2011. Investment analysis and portfolio management. Cengage
Learning.
Sornarajah, M., 2010. The international law on foreign investment. Cambridge University Press.
Online
Gold price, 2016. [Online]. Available through: < http://goldprice.org/gold-price-history.html>.
[Accessed on 24th February 2016].
Paraphrase This Document
Need a fresh take? Get an instant paraphrase of this document with our AI Paraphraser
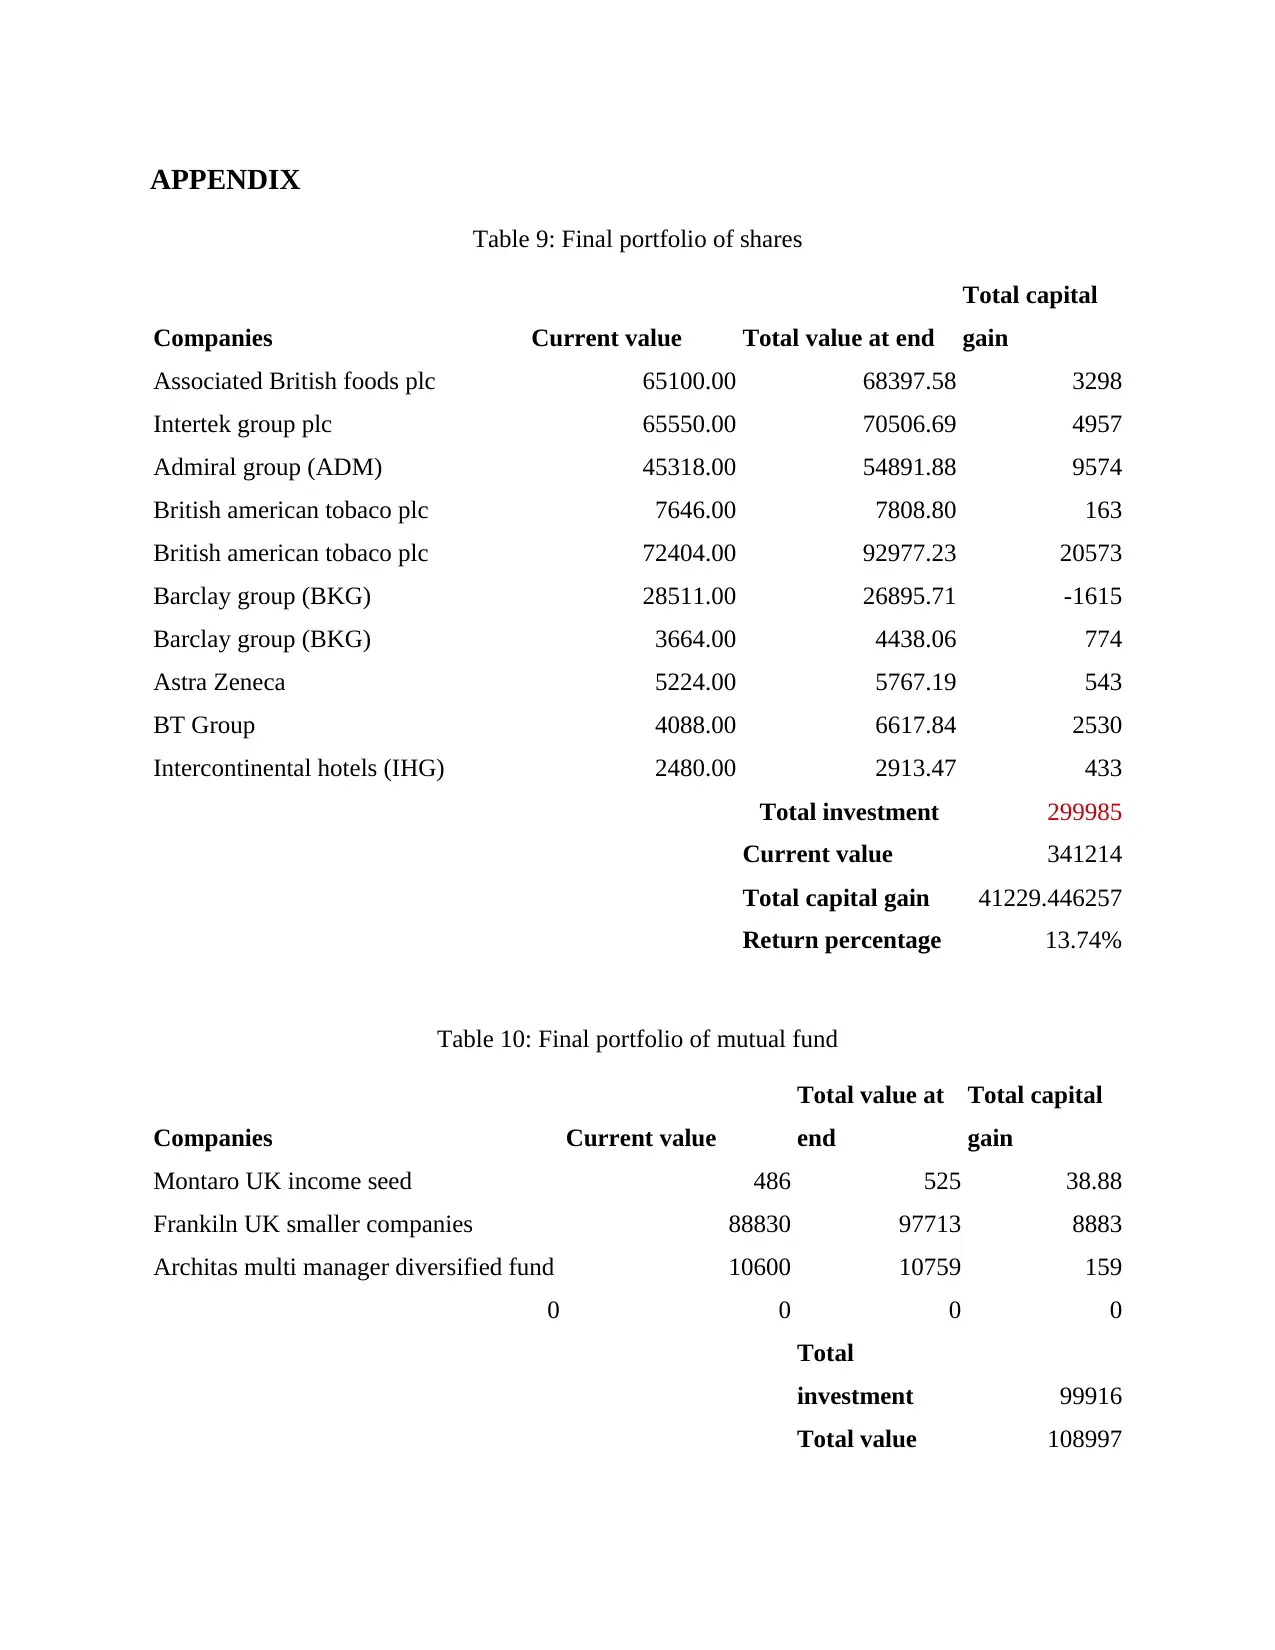
APPENDIX
Table 9: Final portfolio of shares
Companies Current value Total value at end
Total capital
gain
Associated British foods plc 65100.00 68397.58 3298
Intertek group plc 65550.00 70506.69 4957
Admiral group (ADM) 45318.00 54891.88 9574
British american tobaco plc 7646.00 7808.80 163
British american tobaco plc 72404.00 92977.23 20573
Barclay group (BKG) 28511.00 26895.71 -1615
Barclay group (BKG) 3664.00 4438.06 774
Astra Zeneca 5224.00 5767.19 543
BT Group 4088.00 6617.84 2530
Intercontinental hotels (IHG) 2480.00 2913.47 433
Total investment 299985
Current value 341214
Total capital gain 41229.446257
Return percentage 13.74%
Table 10: Final portfolio of mutual fund
Companies Current value
Total value at
end
Total capital
gain
Montaro UK income seed 486 525 38.88
Frankiln UK smaller companies 88830 97713 8883
Architas multi manager diversified fund 10600 10759 159
0 0 0 0
Total
investment 99916
Total value 108997
1 out of 14
Related Documents


Your All-in-One AI-Powered Toolkit for Academic Success.
+13062052269
info@desklib.com
Available 24*7 on WhatsApp / Email
![[object Object]](/_next/static/media/star-bottom.7253800d.svg)
Unlock your academic potential
© 2024 | Zucol Services PVT LTD | All rights reserved.