Digital Signal Processing (ENGT5111)
Added on 2022-01-04
16 Pages3008 Words17 Views
Digital signal processing
Technical report
Engt5111 2018-19
Signal Analysis and Video Compression
Student Name
Student ID Number
Institutional Affiliation
Location
Date of Submission
Technical report
Engt5111 2018-19
Signal Analysis and Video Compression
Student Name
Student ID Number
Institutional Affiliation
Location
Date of Submission

PART I (FILTER DESIGN & SIGNAL ANALYSIS)
PROBLEM 1
Question 1
An ECG is corrupted by muscle noise. The use of this filter to process the signal is quite
necessary as it eliminates the high frequency harmonics which are brought about by measuring
the muscle movements. The ECG signal is measured on the skin using the sensors. The filter is
obtained using the input-output difference equation given as,
y [n ]= 1
21 (−2 x [n ]+3 x [n−1 ]+ 6 x [n−2 ]+7 x [n−3 ]+3 x [n−5 ]−2 x [n−6 ] )
Question 2
Recursive filter design for the ECG signal above,
Digital filter are used to remove frequencies in the low band, high band or a section band from a
digital signal which may be converted from continuous time function to an output function. The
recursive filter repeats itself by using the past output values for the computation of the current
output, such that,
past output vales ( y [n−i ])
current values y [n ]
For instance,
y [n ]= 1
21 (−2 x [n ]+3 x [n−1 ]+ 6 x [n−2 ]+7 x [n−3 ]+3 x [n−5 ]−2 x [n−6 ] )
The generalized difference equation for the linear time invariant system, considering it to be a
causal system,
∑
k=0
N
a [ k ] y [ n−k ]=∑
k=0
M
b [ k ] x [ n−k ]
When the value of a[0] is unity, the equation is given as,
1
y [ n ]=∑
k=0
M
b [k ] x [n−k ]−∑
k=0
N
a [ k ] y [ n−k ]
To obtain the frequency response of the system,
H ( Ω )=
∑
k=0
M
b [ k ] e−ik Ω
e0 +∑
k=1
N
a [ k ] e−ik Ω
=
∑
k=0
M
b [ k ] e−ik Ω
1+∑
k=1
N
a [k ] e−ik Ω
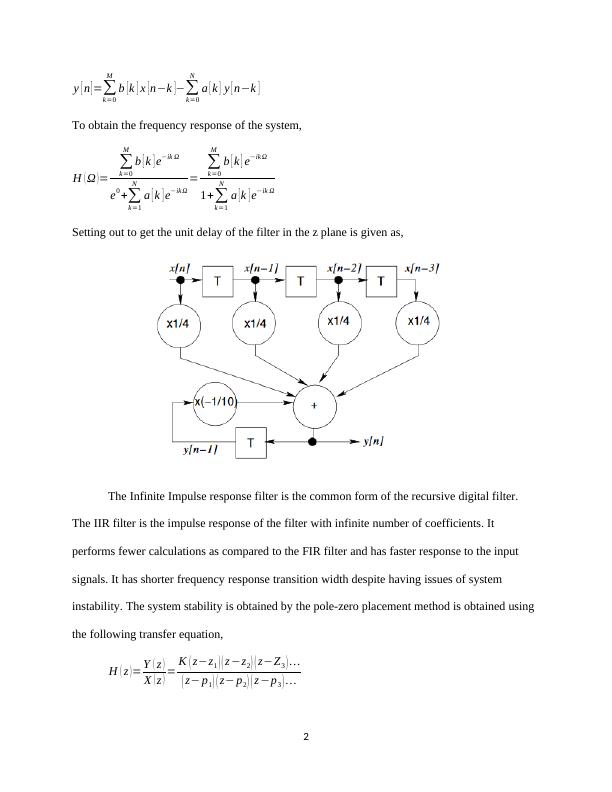
Setting out to get the unit delay of the filter in the z plane is given as,
The Infinite Impulse response filter is the common form of the recursive digital filter.
The IIR filter is the impulse response of the filter with infinite number of coefficients. It
performs fewer calculations as compared to the FIR filter and has faster response to the input
signals. It has shorter frequency response transition width despite having issues of system
instability. The system stability is obtained by the pole-zero placement method is obtained using
the following transfer equation,
H ( z )= Y ( z )
X ( z ) = K ( z−z1 ) ( z −z2) ( z−Z3 ) ...
( z− p1) ( z− p2) ( z −p3 ) ...
2
k=0
M
b [k ] x [n−k ]−∑
k=0
N
a [ k ] y [ n−k ]
To obtain the frequency response of the system,
H ( Ω )=
∑
k=0
M
b [ k ] e−ik Ω
e0 +∑
k=1
N
a [ k ] e−ik Ω
=
∑
k=0
M
b [ k ] e−ik Ω
1+∑
k=1
N
a [k ] e−ik Ω
Setting out to get the unit delay of the filter in the z plane is given as,
The Infinite Impulse response filter is the common form of the recursive digital filter.
The IIR filter is the impulse response of the filter with infinite number of coefficients. It
performs fewer calculations as compared to the FIR filter and has faster response to the input
signals. It has shorter frequency response transition width despite having issues of system
instability. The system stability is obtained by the pole-zero placement method is obtained using
the following transfer equation,
H ( z )= Y ( z )
X ( z ) = K ( z−z1 ) ( z −z2) ( z−Z3 ) ...
( z− p1) ( z− p2) ( z −p3 ) ...
2
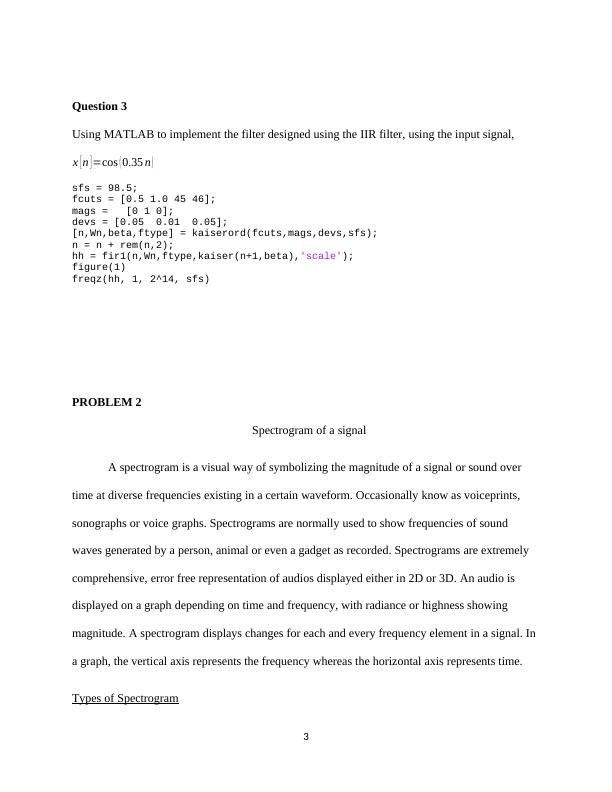
Question 3
Using MATLAB to implement the filter designed using the IIR filter, using the input signal,
x [n ]=cos (0.35 n )
sfs = 98.5;
fcuts = [0.5 1.0 45 46];
mags = [0 1 0];
devs = [0.05 0.01 0.05];
[n,Wn,beta,ftype] = kaiserord(fcuts,mags,devs,sfs);
n = n + rem(n,2);
hh = fir1(n,Wn,ftype,kaiser(n+1,beta),'scale');
figure(1)
freqz(hh, 1, 2^14, sfs)
PROBLEM 2
Spectrogram of a signal
A spectrogram is a visual way of symbolizing the magnitude of a signal or sound over
time at diverse frequencies existing in a certain waveform. Occasionally know as voiceprints,
sonographs or voice graphs. Spectrograms are normally used to show frequencies of sound
waves generated by a person, animal or even a gadget as recorded. Spectrograms are extremely
comprehensive, error free representation of audios displayed either in 2D or 3D. An audio is
displayed on a graph depending on time and frequency, with radiance or highness showing
magnitude. A spectrogram displays changes for each and every frequency element in a signal. In
a graph, the vertical axis represents the frequency whereas the horizontal axis represents time.
Types of Spectrogram
3
End of preview
Want to access all the pages? Upload your documents or become a member.
Related Documents
Digital Signal Processing PDFlg...
|15
|2551
|26
Design of a low pass FIR filter to remove the white noise that has corrupted the message receivedlg...
|7
|495
|100
DSP applications and arm technology PDFlg...
|25
|4783
|186
Spectrum Analyzer Project - Analyzing Modulated Signals and Time Domain Measurementslg...
|6
|1228
|185