Research Methods: A Quantitative Analysis of Windsor Castle Tourism
VerifiedAdded on 2023/09/21
|13
|1309
|113
Report
AI Summary
This report presents a quantitative analysis of tourist satisfaction at Windsor Castle, employing statistical methods to evaluate visitor experiences. The research includes questionnaire design aimed at measuring satisfaction levels across various aspects of the visit, such as opening hours, staff, fa...
DIMITRIOS- TLH251: RESEARCH METHODS
FOR THE SERVICE SECTOR (USL)
QUALITATIVE PORTFOLIO
FOR THE SERVICE SECTOR (USL)
QUALITATIVE PORTFOLIO
Paraphrase This Document
Need a fresh take? Get an instant paraphrase of this document with our AI Paraphraser
Table of Contents
Assessment 2: Quantitative Research Portfolio...............................................................................3
Questionnaire Design Task:.............................................................................................................3
Statistical Testing: Descriptive Analysis:........................................................................................6
Statistical Testing: Chi-Square Test:................................................................................................9
Cross tabulation Tests:.....................................................................................................................9
Graph:............................................................................................................................................10
Significance of the Test:.................................................................................................................11
References:....................................................................................................................................12
2 | P a g e
Assessment 2: Quantitative Research Portfolio
Questionnaire Design Task:
Measuring the tourist satisfaction at Windsor Castle:
We are students of University of Sunderland, and we are conducting the interview as a part of
course assignment. If you could participate in this activity by simply answering a few questions,
we would appreciate it. This interview exercise will provide us with some insights which will be
further helpful for measuring tourist satisfaction at Windsor Castle. All the answers gathered
from you will be kept confidential. Thank You.
1. Is it your first visit to Windsor Castle?
o Yes
o No
2. How often have you visited Windsor Castle before?
o Weekly
o Monthly
o Once in 6 months
o Once a year
o Rarely
o Never
3. What is your aim for visiting Windsor Castle?
o Sightseeing
o Special Event Activity
o Cultural Event
o Education
o Media
o Other ____
3 | P a g e
⊘ This is a preview!⊘
Do you want full access?
Subscribe today to unlock all pages.
Trusted by 1+ million students worldwide
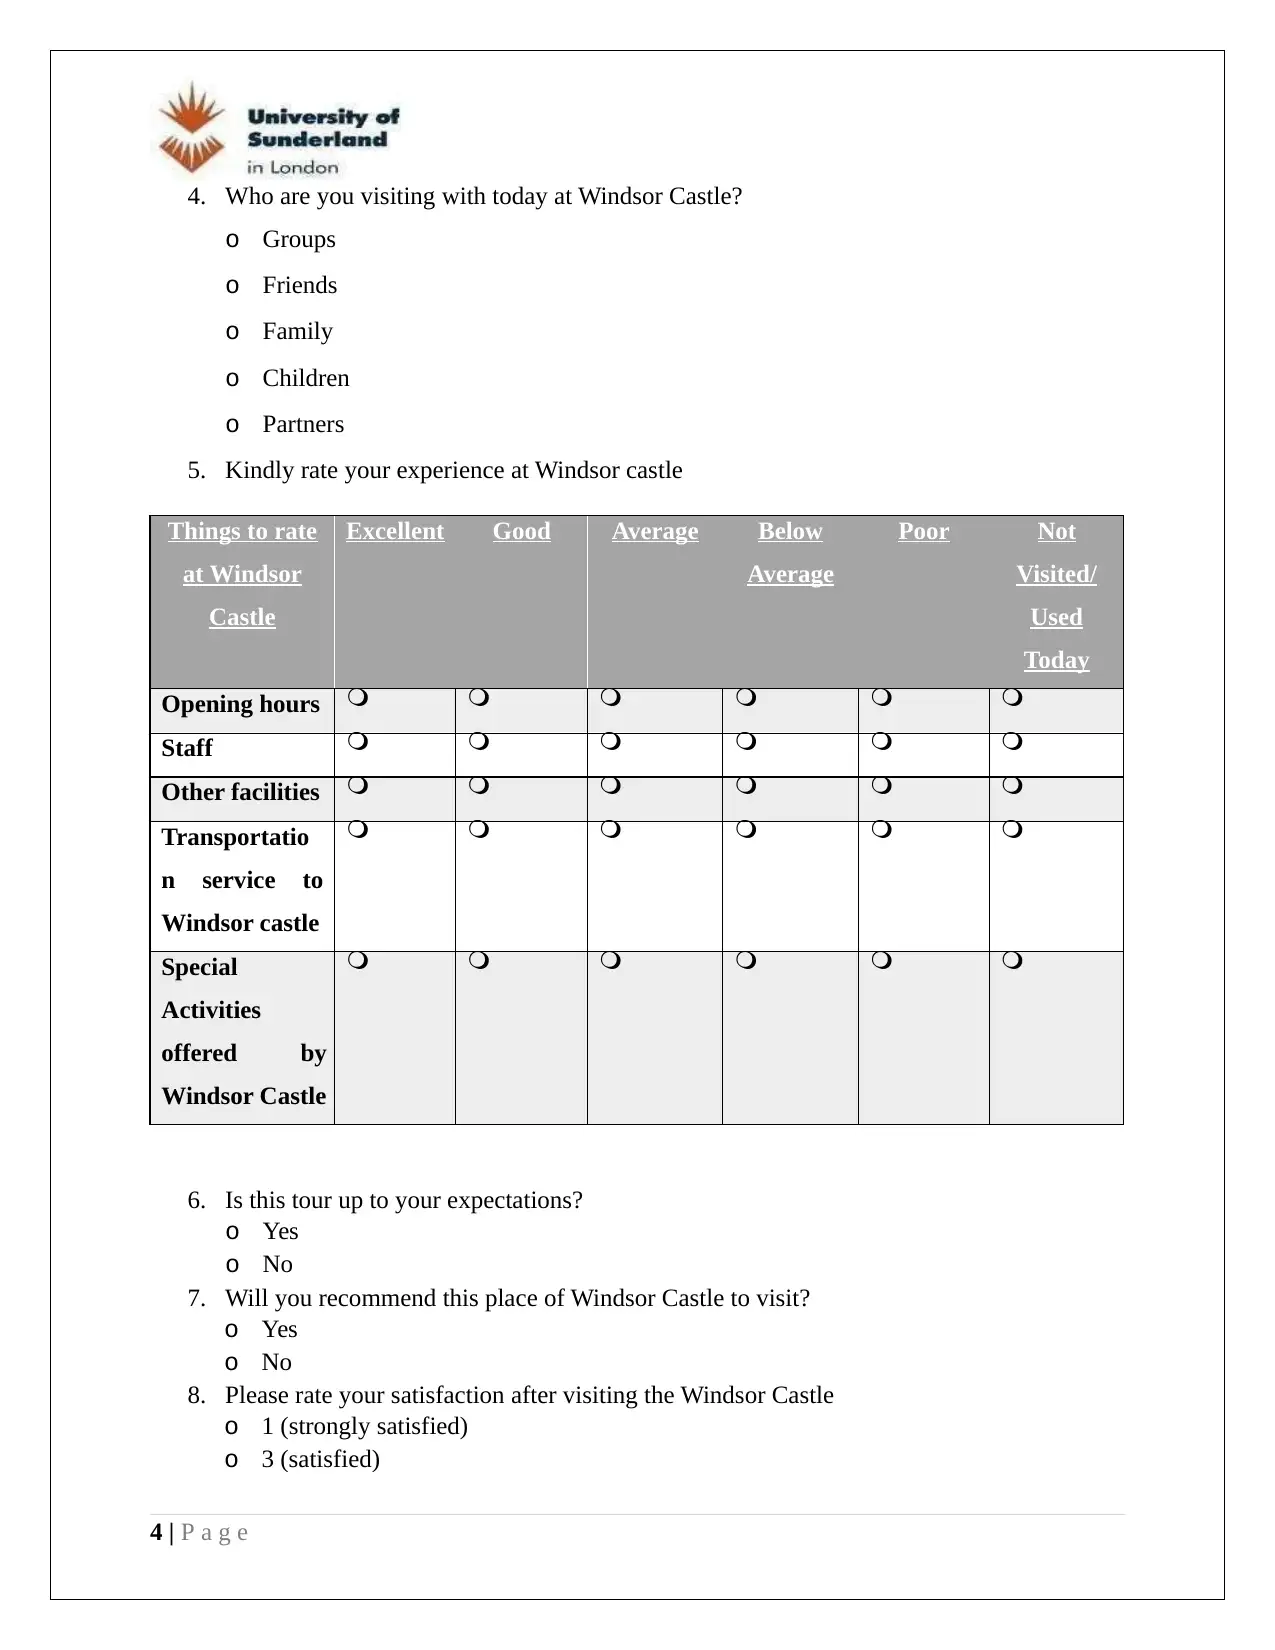
4. Who are you visiting with today at Windsor Castle?
o Groups
o Friends
o Family
o Children
o Partners
5. Kindly rate your experience at Windsor castle
Things to rate
at Windsor
Castle
Excellent Good Average Below
Average
Poor Not
Visited/
Used
Today
Opening hours
Staff
Other facilities
Transportatio
n service to
Windsor castle
Special
Activities
offered by
Windsor Castle
6. Is this tour up to your expectations?
o Yes
o No
7. Will you recommend this place of Windsor Castle to visit?
o Yes
o No
8. Please rate your satisfaction after visiting the Windsor Castle
o 1 (strongly satisfied)
o 3 (satisfied)
4 | P a g e
Paraphrase This Document
Need a fresh take? Get an instant paraphrase of this document with our AI Paraphraser
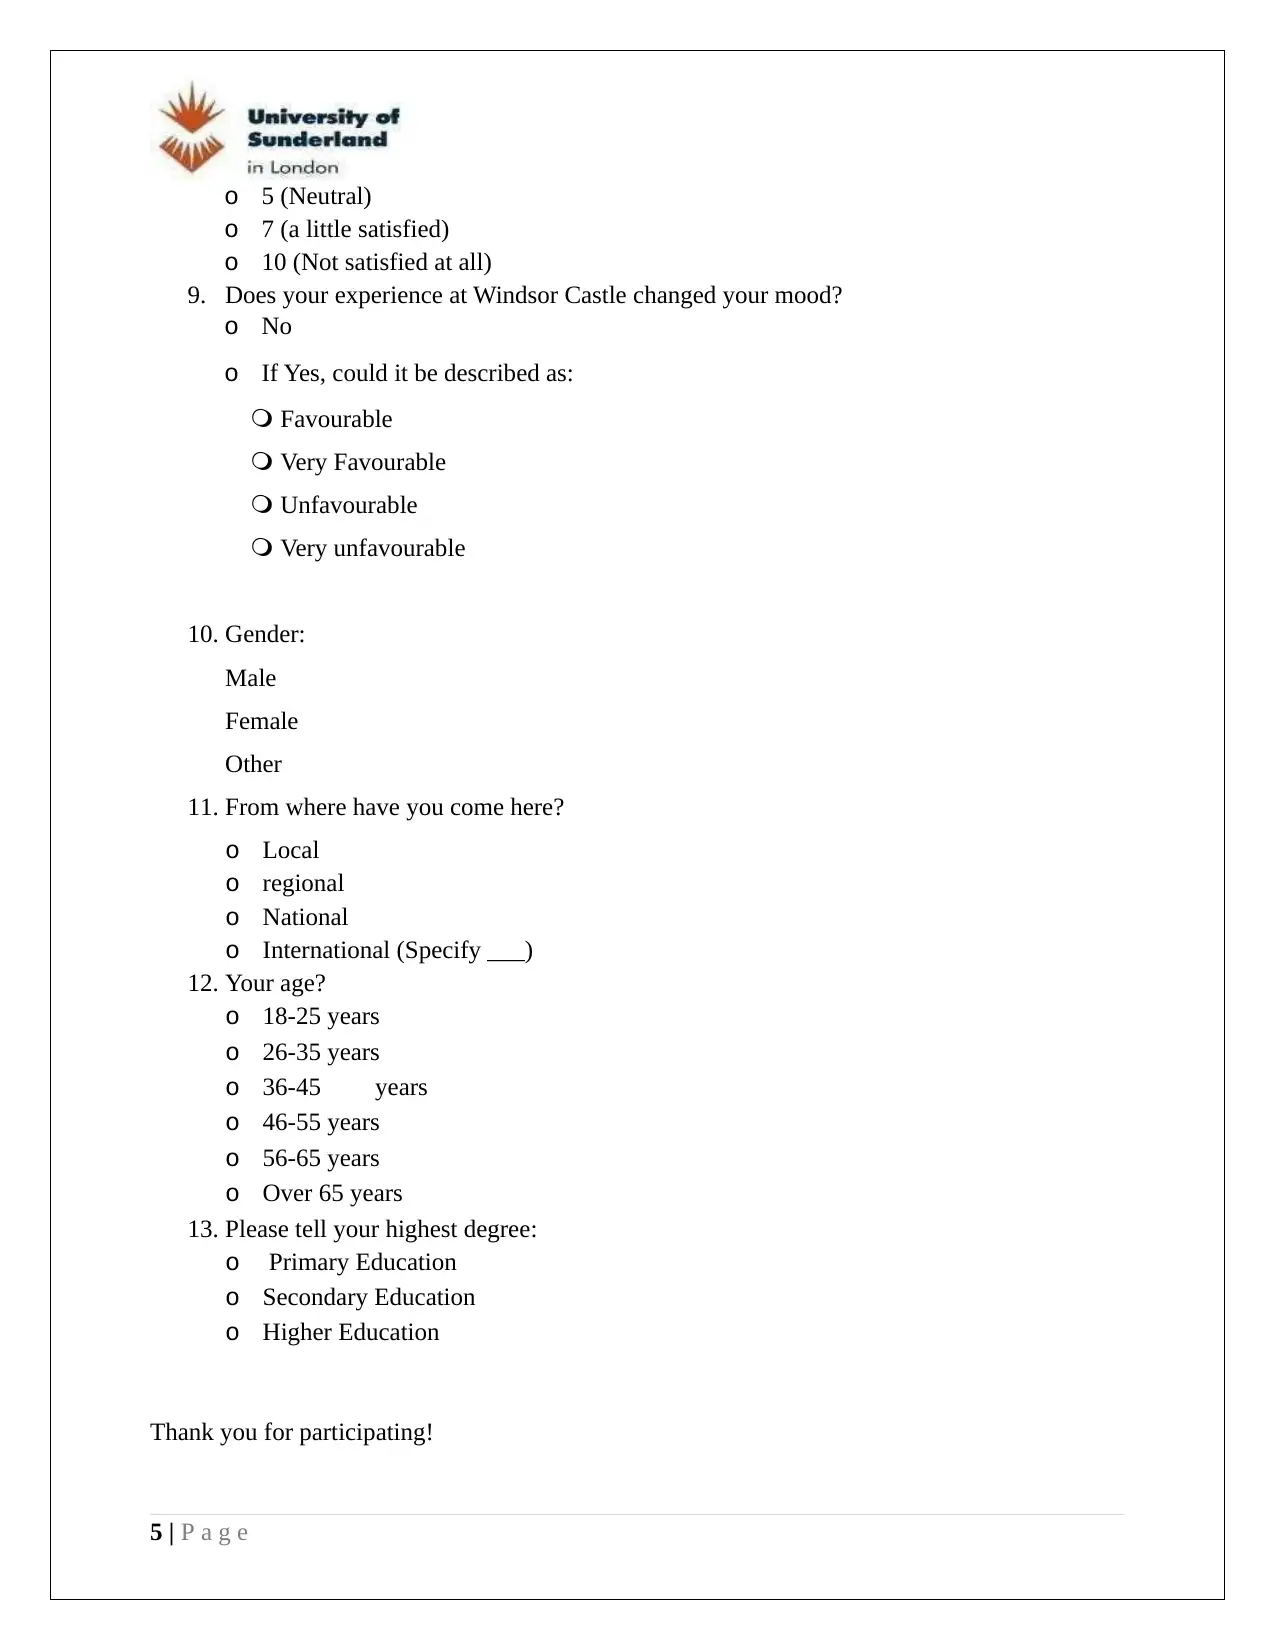
o 5 (Neutral)
o 7 (a little satisfied)
o 10 (Not satisfied at all)
9. Does your experience at Windsor Castle changed your mood?
o No
o If Yes, could it be described as:
Favourable
Very Favourable
Unfavourable
Very unfavourable
10. Gender:
Male
Female
Other
11. From where have you come here?
o Local
o regional
o National
o International (Specify ___)
12. Your age?
o 18-25 years
o 26-35 years
o 36-45 years
o 46-55 years
o 56-65 years
o Over 65 years
13. Please tell your highest degree:
o Primary Education
o Secondary Education
o Higher Education
Thank you for participating!
5 | P a g e

6 | P a g e
⊘ This is a preview!⊘
Do you want full access?
Subscribe today to unlock all pages.
Trusted by 1+ million students worldwide
Statistical Testing: Descriptive Analysis:
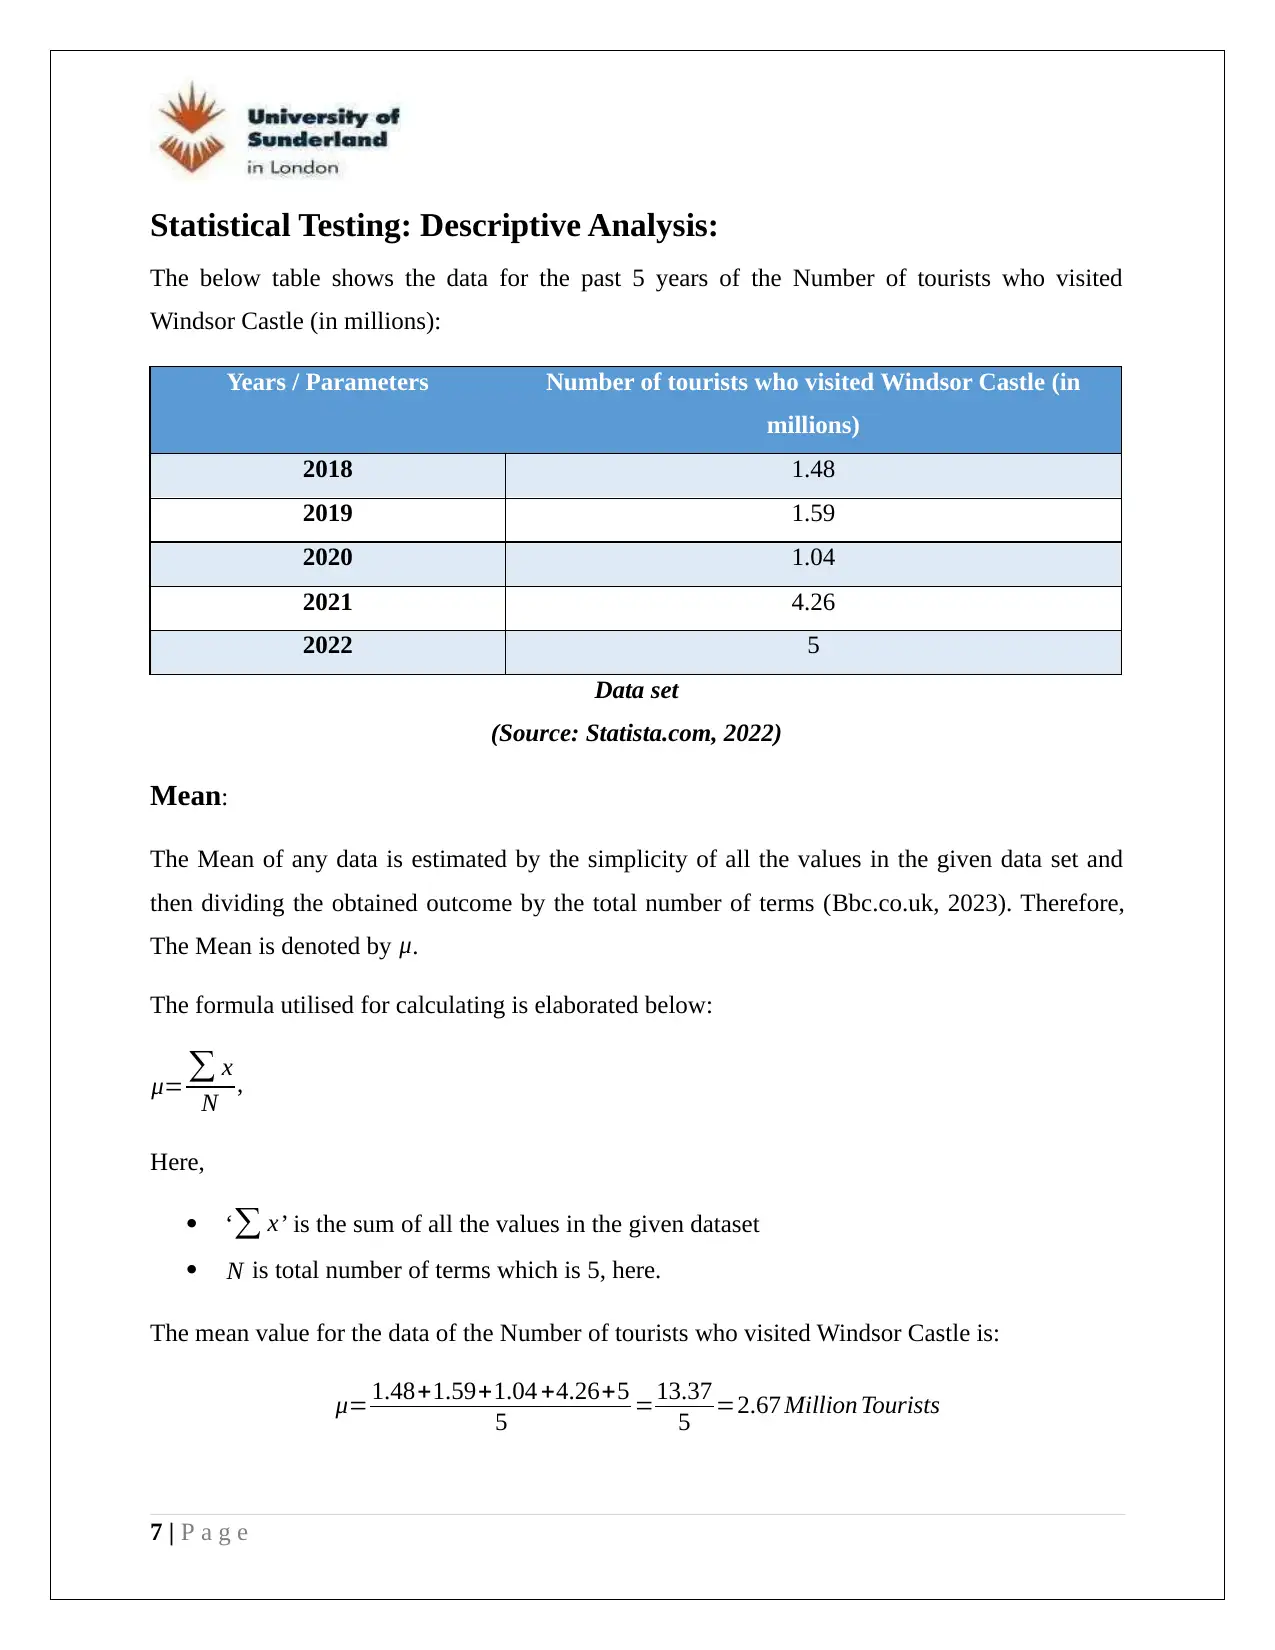
The below table shows the data for the past 5 years of the Number of tourists who visited
Windsor Castle (in millions):
Years / Parameters Number of tourists who visited Windsor Castle (in
millions)
2018 1.48
2019 1.59
2020 1.04
2021 4.26
2022 5
Data set
(Source: Statista.com, 2022)
Mean:
The Mean of any data is estimated by the simplicity of all the values in the given data set and
then dividing the obtained outcome by the total number of terms (Bbc.co.uk, 2023). Therefore,
The Mean is denoted by μ.
The formula utilised for calculating is elaborated below:
μ= ∑ x
N ,
Here,
‘∑ x’ is the sum of all the values in the given dataset
N is total number of terms which is 5, here.
The mean value for the data of the Number of tourists who visited Windsor Castle is:
μ= 1.48+1.59+1.04 +4.26+5
5 =13.37
5 =2.67 Million Tourists
7 | P a g e
Paraphrase This Document
Need a fresh take? Get an instant paraphrase of this document with our AI Paraphraser
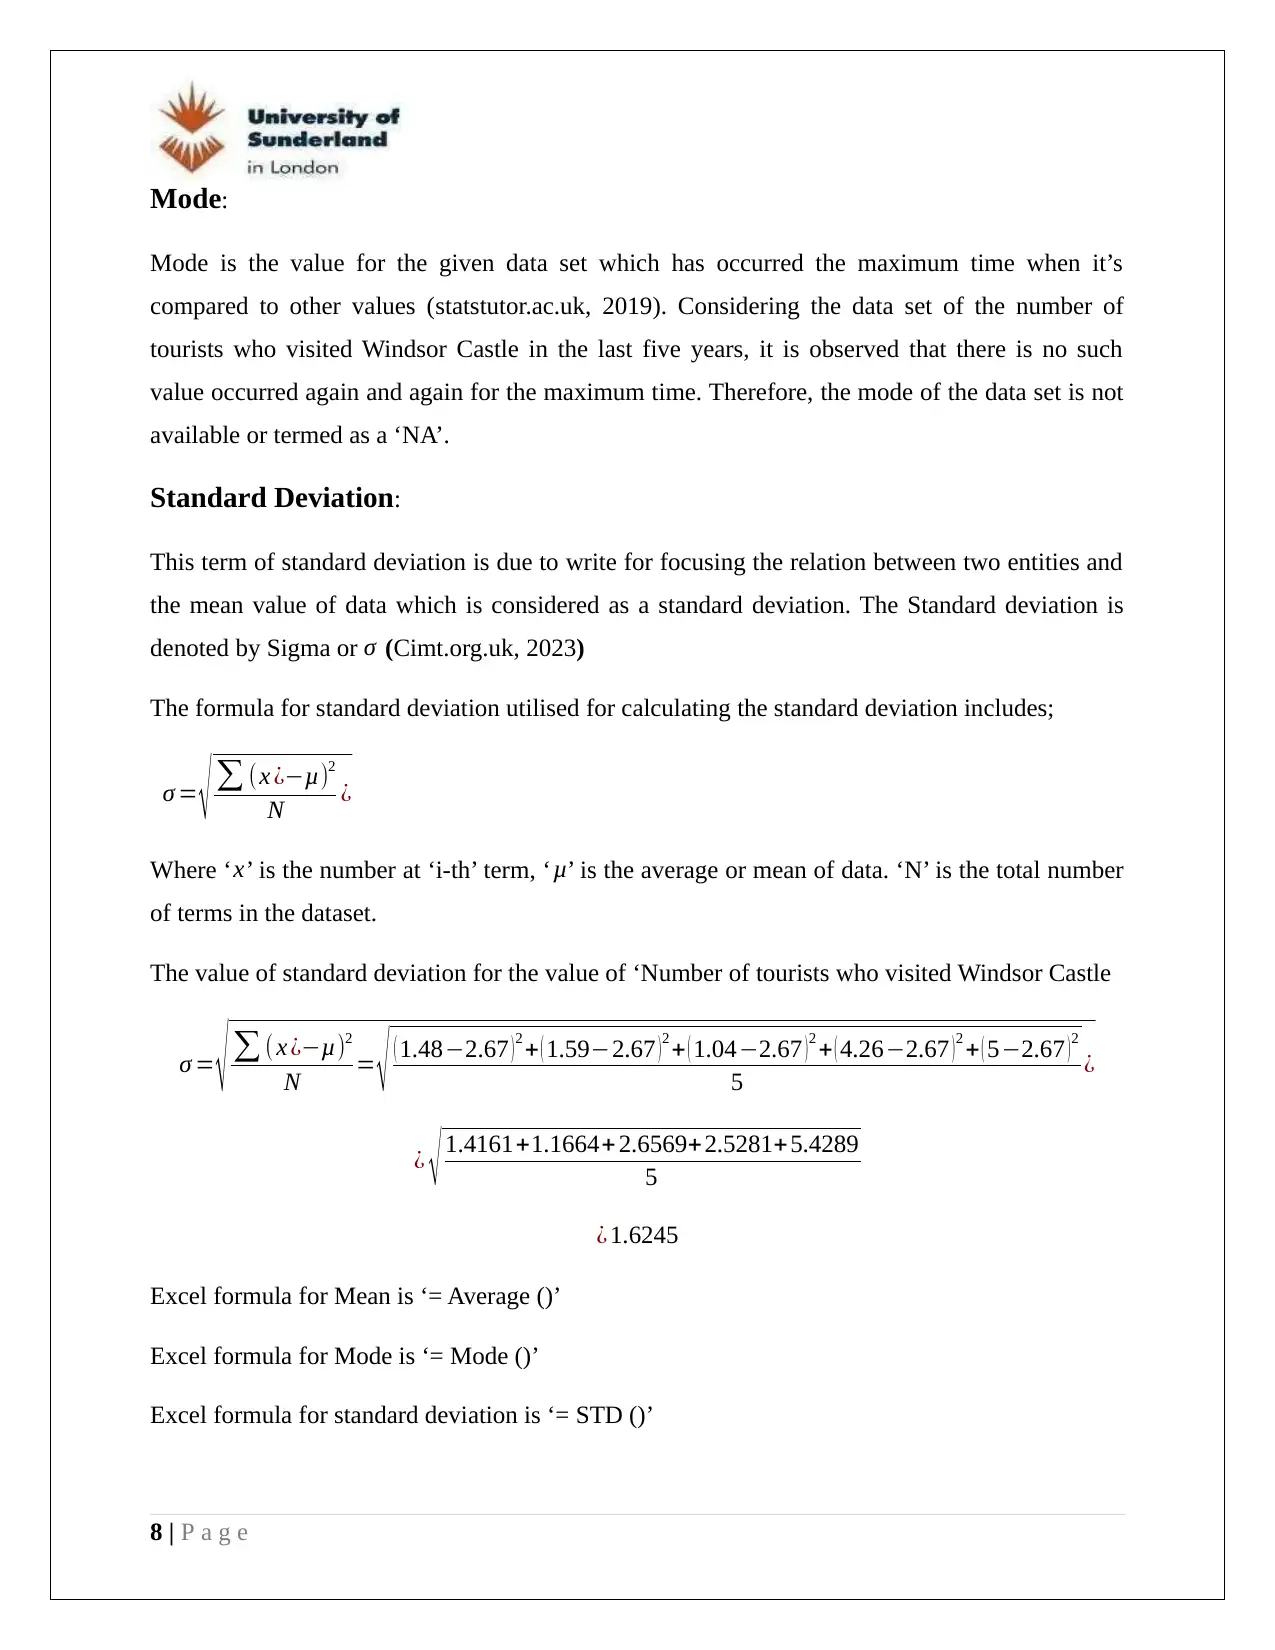
Mode:
Mode is the value for the given data set which has occurred the maximum time when it’s
compared to other values (statstutor.ac.uk, 2019). Considering the data set of the number of
tourists who visited Windsor Castle in the last five years, it is observed that there is no such
value occurred again and again for the maximum time. Therefore, the mode of the data set is not
available or termed as a ‘NA’.
Standard Deviation:
This term of standard deviation is due to write for focusing the relation between two entities and
the mean value of data which is considered as a standard deviation. The Standard deviation is
denoted by Sigma or σ (Cimt.org.uk, 2023)
The formula for standard deviation utilised for calculating the standard deviation includes;
σ = √ ∑ (x ¿−μ)2
N ¿
Where ‘x’ is the number at ‘i-th’ term, ‘ μ’ is the average or mean of data. ‘N’ is the total number
of terms in the dataset.
The value of standard deviation for the value of ‘Number of tourists who visited Windsor Castle
σ = √ ∑ ( x ¿−μ)2
N = √ ( 1.48−2.67 ) 2 + ( 1.59−2.67 ) 2 + ( 1.04−2.67 ) 2 + ( 4.26−2.67 ) 2 + ( 5−2.67 ) 2
5 ¿
¿ √ 1.4161+1.1664+ 2.6569+2.5281+5.4289
5
¿ 1.6245
Excel formula for Mean is ‘= Average ()’
Excel formula for Mode is ‘= Mode ()’
Excel formula for standard deviation is ‘= STD ()’
8 | P a g e
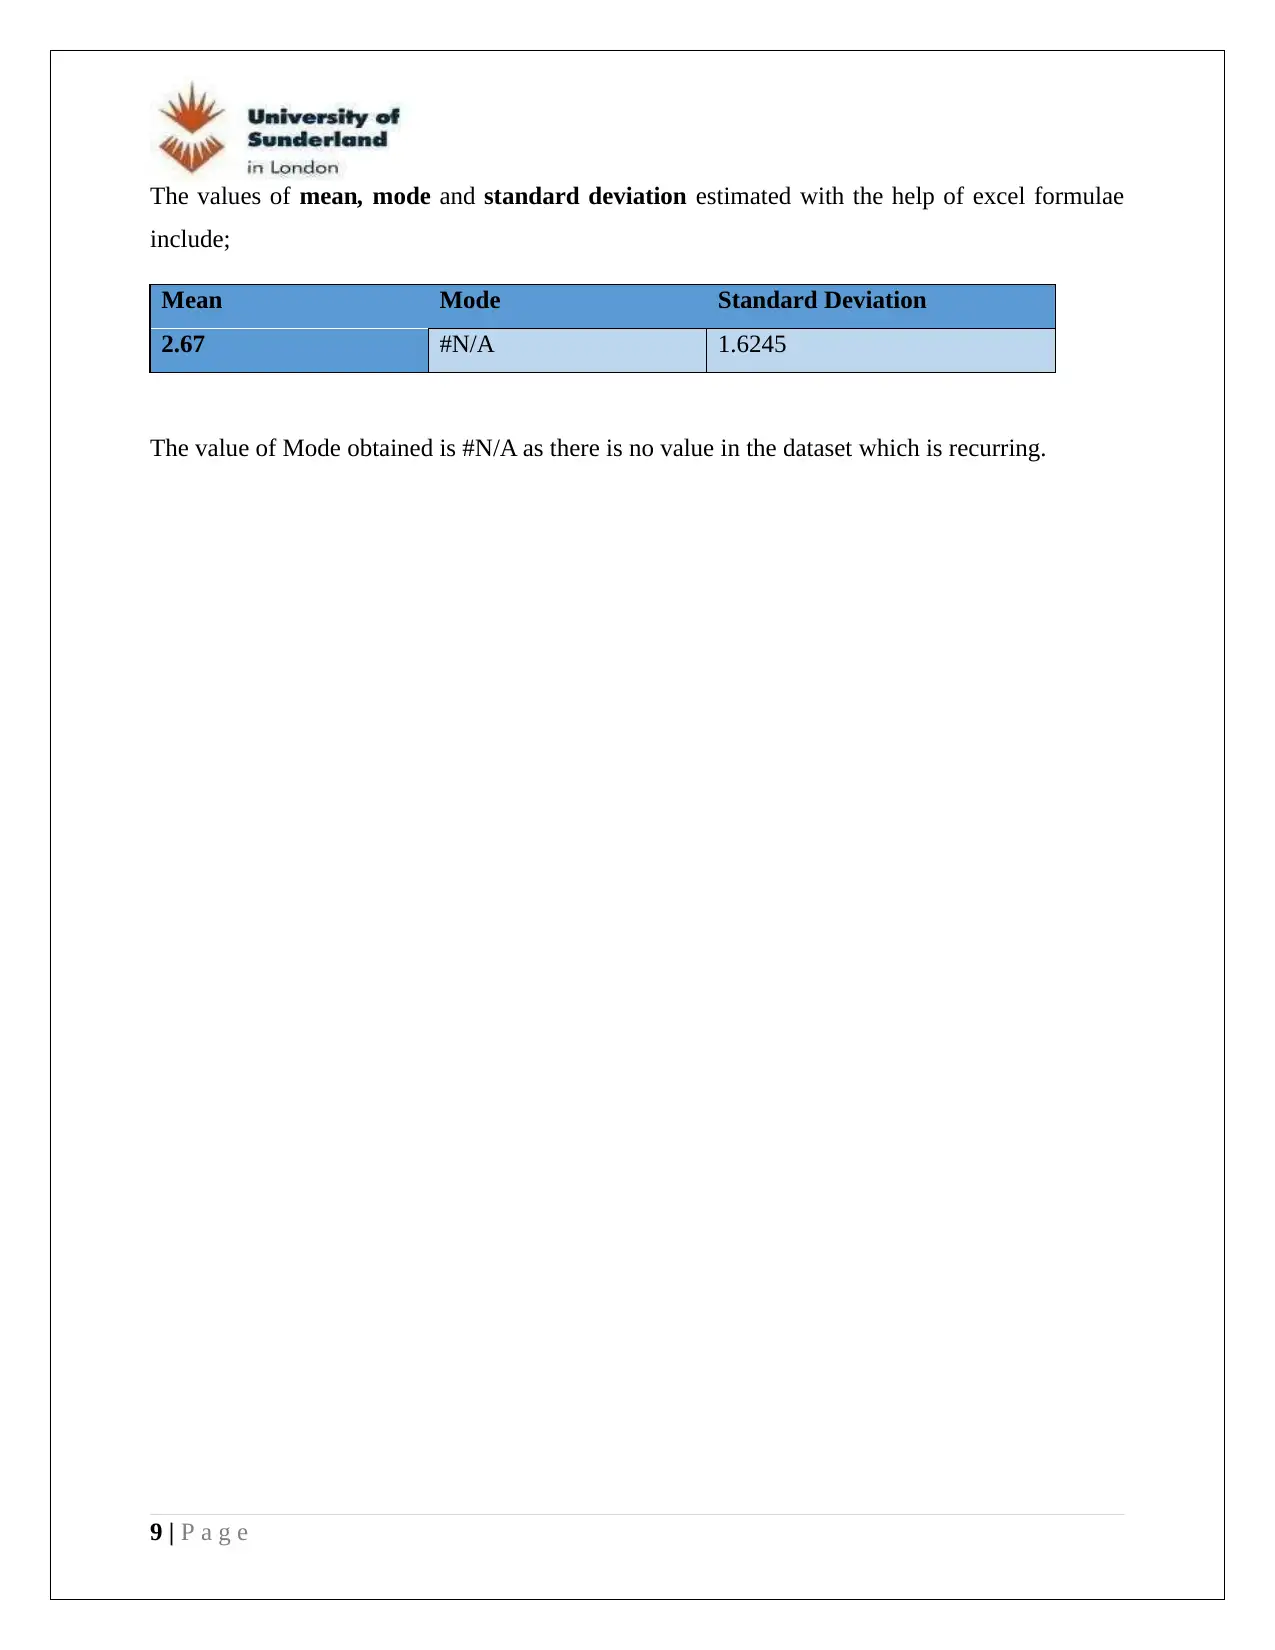
The values of mean, mode and standard deviation estimated with the help of excel formulae
include;
Mean Mode Standard Deviation
2.67 #N/A 1.6245
The value of Mode obtained is #N/A as there is no value in the dataset which is recurring.
9 | P a g e
include;
Mean Mode Standard Deviation
2.67 #N/A 1.6245
The value of Mode obtained is #N/A as there is no value in the dataset which is recurring.
9 | P a g e
⊘ This is a preview!⊘
Do you want full access?
Subscribe today to unlock all pages.
Trusted by 1+ million students worldwide
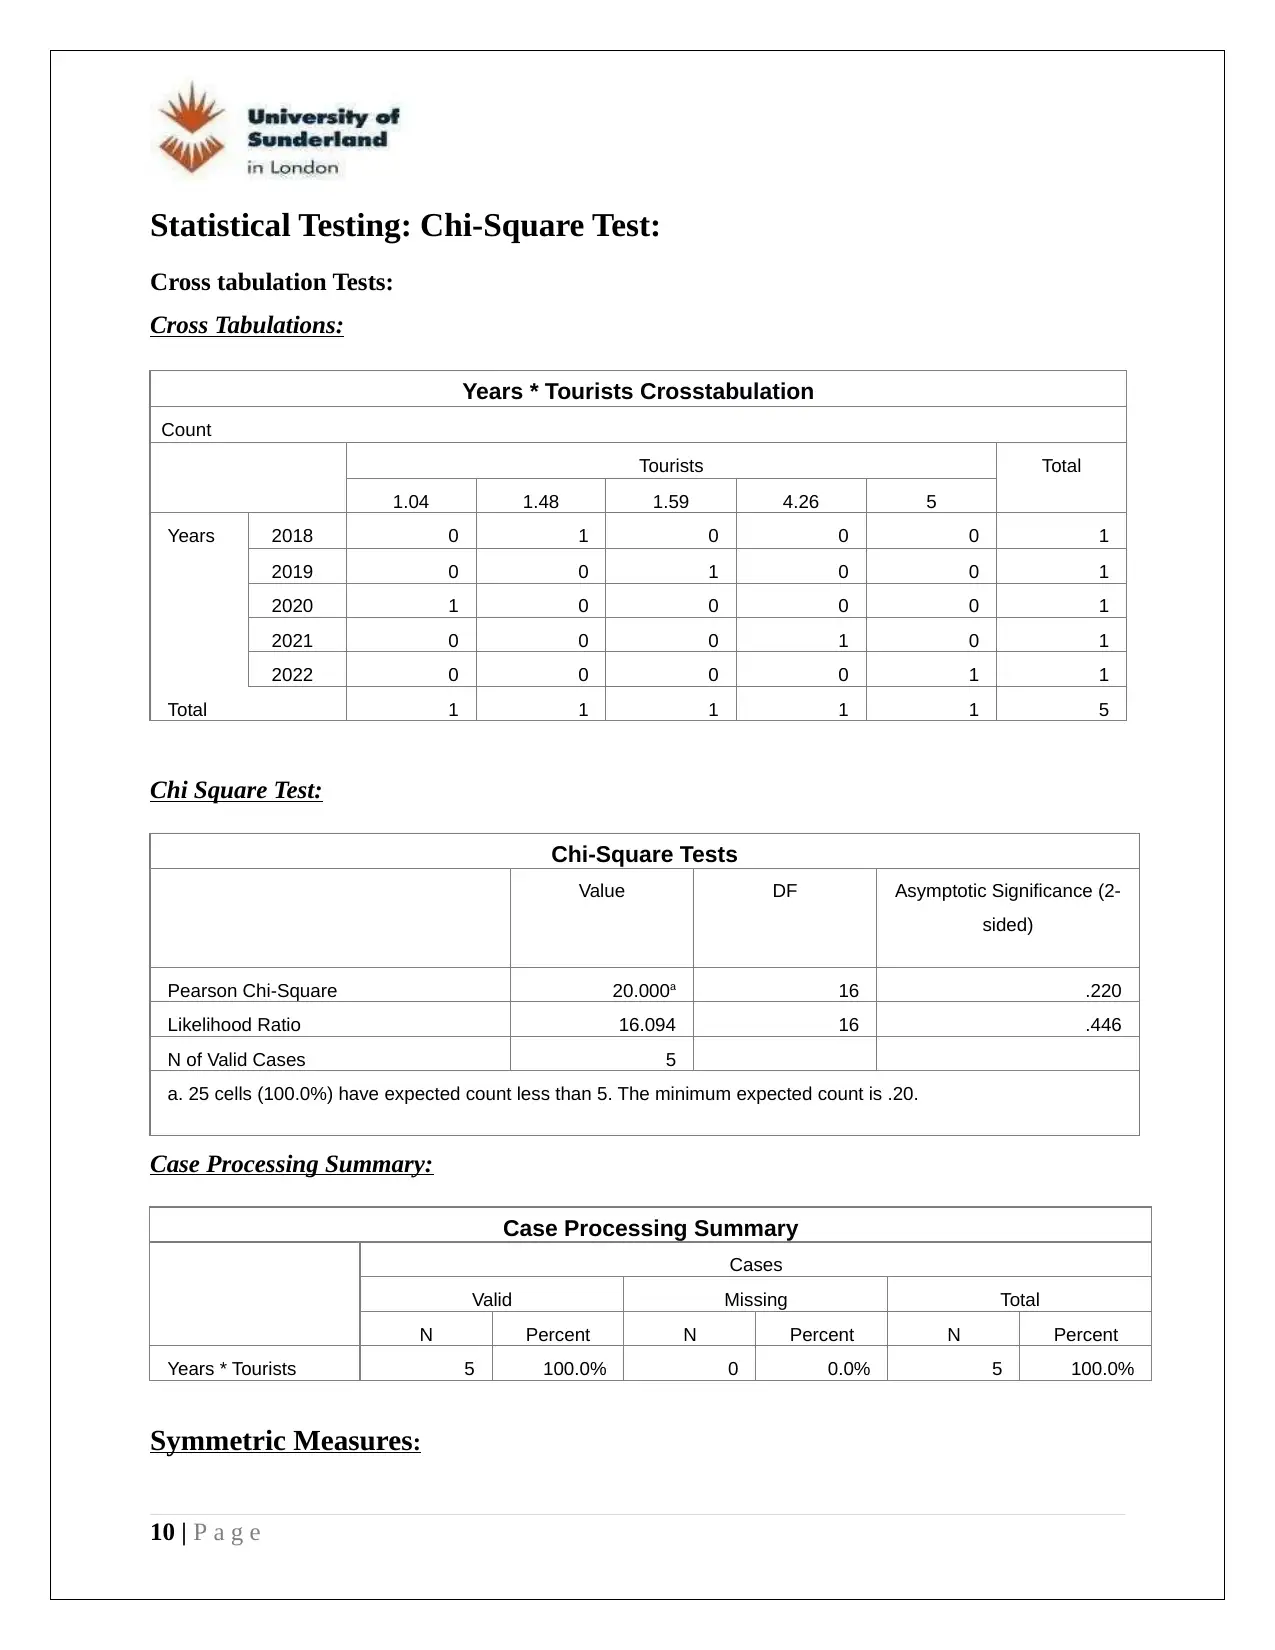
Statistical Testing: Chi-Square Test:
Cross tabulation Tests:
Cross Tabulations:
Years * Tourists Crosstabulation
Count
Tourists Total
1.04 1.48 1.59 4.26 5
Years 2018 0 1 0 0 0 1
2019 0 0 1 0 0 1
2020 1 0 0 0 0 1
2021 0 0 0 1 0 1
2022 0 0 0 0 1 1
Total 1 1 1 1 1 5
Chi Square Test:
Chi-Square Tests
Value DF Asymptotic Significance (2-
sided)
Pearson Chi-Square 20.000a 16 .220
Likelihood Ratio 16.094 16 .446
N of Valid Cases 5
a. 25 cells (100.0%) have expected count less than 5. The minimum expected count is .20.
Case Processing Summary:
Case Processing Summary
Cases
Valid Missing Total
N Percent N Percent N Percent
Years * Tourists 5 100.0% 0 0.0% 5 100.0%
Symmetric Measures:
10 | P a g e
Paraphrase This Document
Need a fresh take? Get an instant paraphrase of this document with our AI Paraphraser
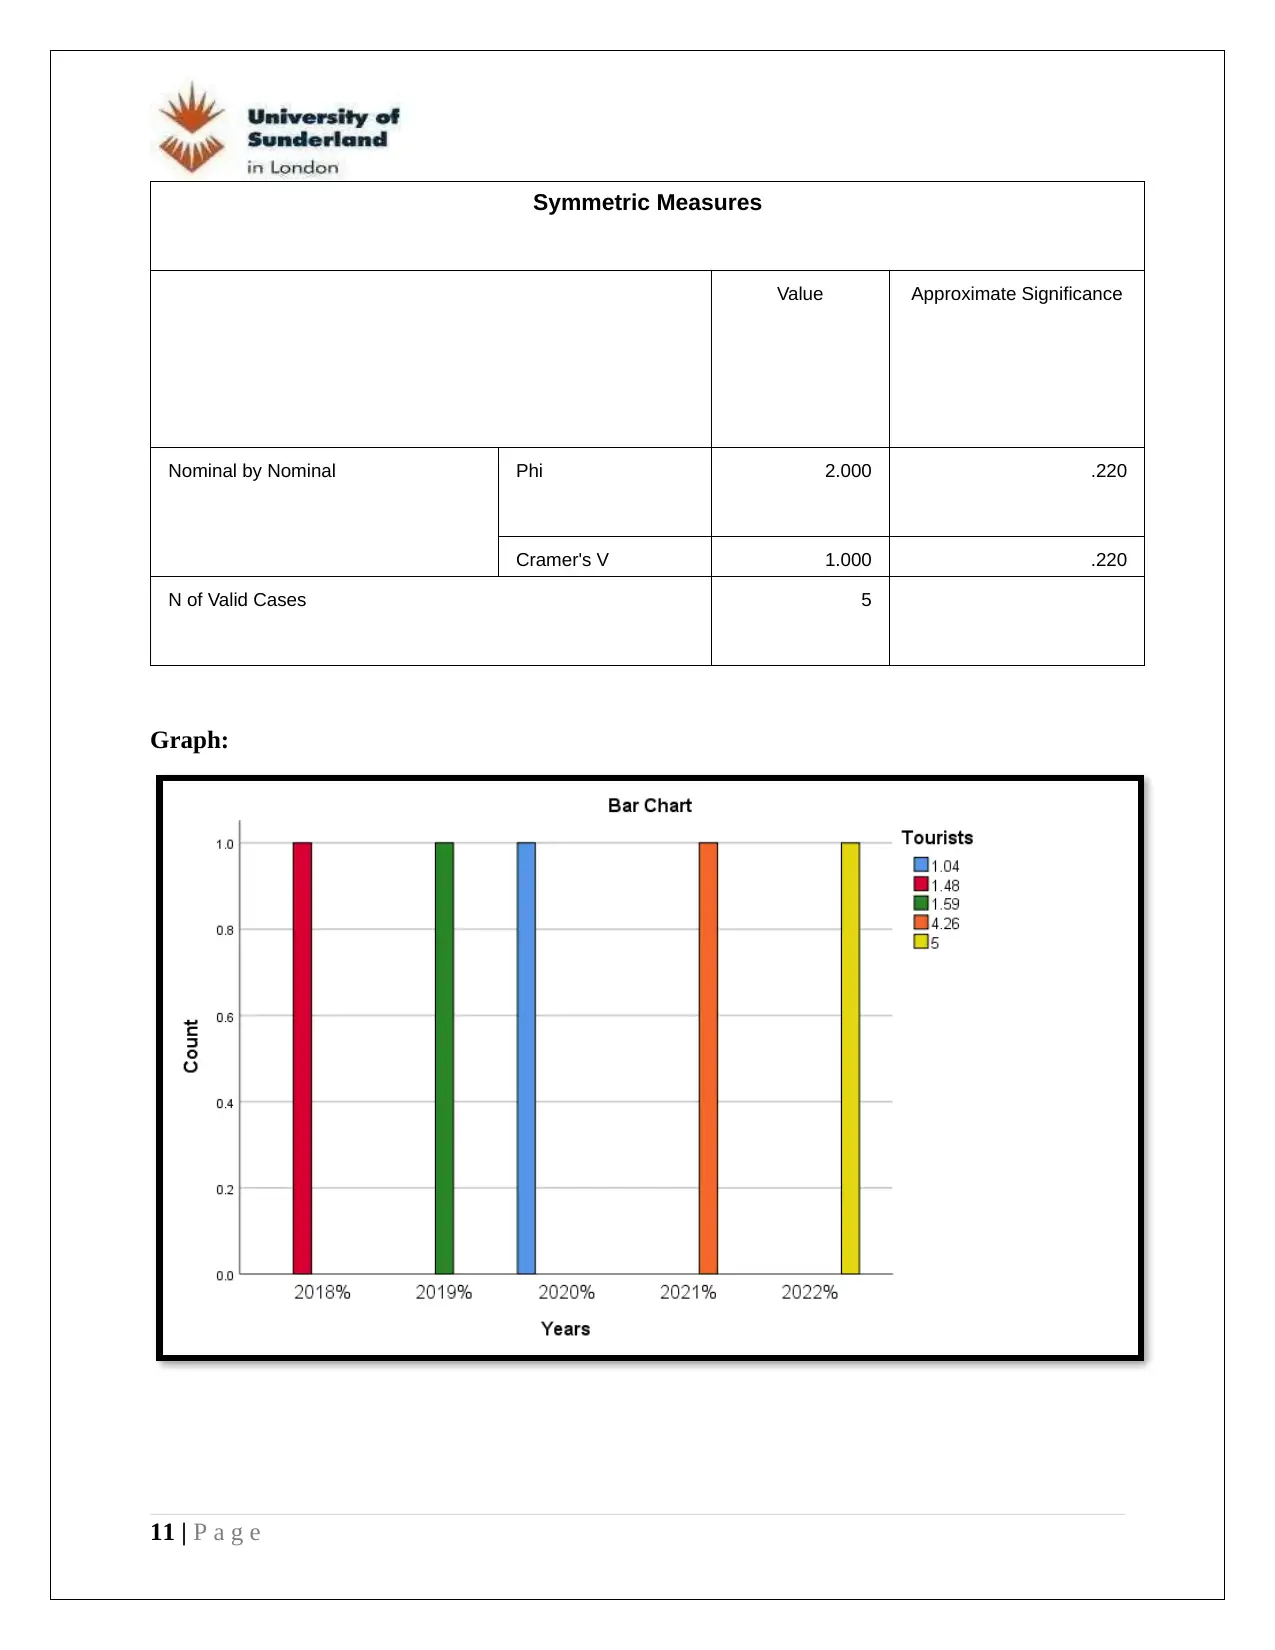
Symmetric Measures
Value Approximate Significance
Nominal by Nominal Phi 2.000 .220
Cramer's V 1.000 .220
N of Valid Cases 5
Graph:
11 | P a g e
Value Approximate Significance
Nominal by Nominal Phi 2.000 .220
Cramer's V 1.000 .220
N of Valid Cases 5
Graph:
11 | P a g e
Significance of the Test:
The taken Chi-square test is significant. As the value of chi-square is 20.000a. The P value
appears in the same row in the ‘Asymptotic significance (2-sided)” column (.220). The result is
significant for this chi-square test as the value is equal to or less than the designated alpha level
which is taken as 0.05.
In this case, the P-value is smaller than the standard alpha value, so here in this case we reject the
null hypothesis that basically asserts the two variables which are independent of each other. In
simple words, result is significant as the data suggests that the variables Years and number of
tourists visited Windsor castle are linked with each other.
12 | P a g e
⊘ This is a preview!⊘
Do you want full access?
Subscribe today to unlock all pages.
Trusted by 1+ million students worldwide
References:
Bbc.co.uk, (2023). How to find the mean, median, mode and range. [online] Available at:
https://www.bbc.co.uk/bitesize/topics/zm49q6f/articles/z99jpbk [Accessed 25 Jul. 2023].
Cimt.org.uk. (2023). Unit 5 Section 2: Mean, Median, Mode and Range. [online] Available at:
https://www.cimt.org.uk/projects/mepres/book8/bk8i5/bk8_5i2.htm [Accessed 25 Jul.
2023].
Statista.com (2022). Royal tourism: admissions by establishment UK 2022 | Statista. [online]
Available at: https://www.statista.com/statistics/373081/uk-royal-tourism-admission-
numbers-by-establishment/#:~:text=Windsor%20Castle%20and%20Frogmore
%20House,April%202021%20and%20March%202022. [Accessed 25 Jul. 2023].
statstutor.ac.uk, (2019) Mean, Median and Mode. [online] Available at:
https://www.statstutor.ac.uk/resources/uploaded/meanmedianmode.pdf. [Accessed 25
Jul. 2023].
13 | P a g e
1 out of 13
Related Documents


Your All-in-One AI-Powered Toolkit for Academic Success.
+13062052269
info@desklib.com
Available 24*7 on WhatsApp / Email
![[object Object]](/_next/static/media/star-bottom.7253800d.svg)
Unlock your academic potential
© 2024 | Zucol Services PVT LTD | All rights reserved.