Predicting Financial Distress in Indonesian Manufacturing Industry
VerifiedAdded on 2023/04/21
|22
|8279
|487
AI Summary
This paper aims to develop and evaluate financial distress prediction models using financial ratios derived from financial statements of companies in Indonesian manufacturing industry. The models employ traditional statistical modeling (Logistic Regression and Discriminant Analysis) and modern modeling tool (Neural Network). The research identifies a set of ratios that significantly contribute to financial distress condition of the companies in the sample group.
Contribute Materials
Your contribution can guide someone’s learning journey. Share your
documents today.
Data Science and Service Research
Discussion Paper
Discussion Paper No. 62
Predicting Financial Distress in Indonesian
Manufacturing Industry
MUHAMMAD RIFQI and YOSHIO KANAZAKI
June, 2016
May 2016
Center for Data Science and Service Research
Graduate School of Economic and Management
Tohoku University
27-1 Kawauchi, Aobaku
Sendai 980-8576, JAPAN
Secure Best Marks with AI Grader
Need help grading? Try our AI Grader for instant feedback on your assignments.
1
Predicting Financial Distress in Indonesian Manufacturing
Industry
MUHAMMAD RIFQI and YOSHIO KANAZAKI *
ABSTRACT
We attempt to develop and evaluate financial distress prediction models using
financial ratios derived from financial statements of companies in Indonesian
manufacturing industry. The samples are manufacturing companies listed in
Indonesian Stock Exchange during 2003-2011. The models employ two kinds of
methods: traditional statistical modeling (Logistic Regression and Discriminant
Analysis) and modern modeling tool (Neural Network). We evaluate 23 financial
ratios (that measure a company’s liquidity, profitability, leverage, and cash
position) and are able to identify a set of ratios that significantly contribute to
financial distress condition of the companies in sample group. By utilizing those
ratios, prediction models are developed and evaluated based on accuracy and
error rates to determine the best model. The result shows that the ratios
identified by logistic regression and the model built on that basis is more
appropriate than those derived from discriminant analysis. The research also
shows that although the best performing prediction model is a neural network
model, but we have no solid proof of neural network’s absolute superiority over
traditional modeling methods.
Keywords: financial distress, prediction model, discriminant analysis, logistic
regression, neural network.
1. INTRODUCTION
The topic of financial distress prediction has been attracting many researchers’ attention,
especially those in accounting field. Financial distress prediction models have been created
to cope with financial difficulties condition faced by companies, especially in post-crisis
period (Shirata, 1998). The development of prediction models started when Beaver
introduced a simple univariate analysis of financial ratios to predict future bankruptcy
(Beaver, 1966). Since then, many researchers have been struggling to develop financial
distress prediction techniques using statistical models. The most popular example was
* Graduate School of Economics and Management, Tohoku University, Sendai, Japan
This work was supported by JSPS KAKENHI Grant Number JP25380385.
2
Altman Z-Score model which utilizes 5 different financial ratios in his prediction model
(Altman, 1968). Other notable models include Ohlson model in 1980 (Ohlson, 1980), Fulmer
model in 1984 (Fulmer, 1984), and Springate model in 1978 (Springate, 1978). Besides
western researchers, accounting researchers from Asia also present their models, such as
Shirata who presented her first model in 1998 and then updating it in 2003 (the updated
version, being known as SAF2002 model, is widely used in Japan). Sung, Chang, and Lee
(1999) analyzes financial pattern and significant financial ratios to discriminate future
bankrupt companies under different macroeconomic circumstances. Bae (2012) develops a
distress prediction model based on radial basis support vector machine (RSVM) for
companies in South Korean manufacturing industry. In the case of Indonesia, there have
been several but still limited models developed by researchers to predict financial distress.
Indonesian researchers focused mainly on Indonesian manufacturing Industry, such as
Luciana (2003) and Brahmana (2005).
It is important to note that “financial distress” and “bankruptcy” is not the same thing.
Financial distress typically takes place before bankruptcy; therefore it can be considered as
an indicator of bankruptcy (Luciana, 2003). Due to the convenience in obtaining the legal
data and the relatively efficient process of bankruptcy filing, most researchers that use US
companies in their study use the legal definition of bankruptcy in their prediction models. In
other words, they classify the firms which filed for bankruptcy in legal court as the
“bankrupt” group, thus they are developing bankruptcy prediction models, not financial
distress prediction models. Same thing also applies in relatively developed countries where
the bankruptcy filing process can be conducted efficiently, such as Canada (Springate, 1978)
and Japan (Shirata, 1998). Meanwhile, some other researchers use delisting status from the
exchange as their bankruptcy proxy, for example Shumway (2001).
However, for researchers who take the companies in developing economies as their
sample, using legal definition of bankruptcy might pose a grave problem. This is due to the
fact that bankruptcy filing process in a developing country typically takes years to complete,
so it will be a long process until a company can be declared bankrupt. For example, in the
case of Indonesia, a bankruptcy filing process in court usually takes a considerably long time
to undergo, and the data of bankruptcy filing is very hard to obtain from Indonesian
Corporate Court (Zu’amah, 2005). If they decided to use the bankruptcy data for their
prediction models, there will be a significant amount of time lag between the date of
bankruptcy declaration and the financial numbers they use to predict the bankruptcy event,
thus greatly reducing the relevance of their model to predicting the bankruptcy event. Due
to this problem, the researchers in developing countries resort to an alternative strategy:
they use “financial distress” status instead of “bankruptcy” status, thus making their
3
prediction models a little different in nature to those of developed countries. However, in
this study we will use the term “financial distress” and “bankruptcy” interchangeably.
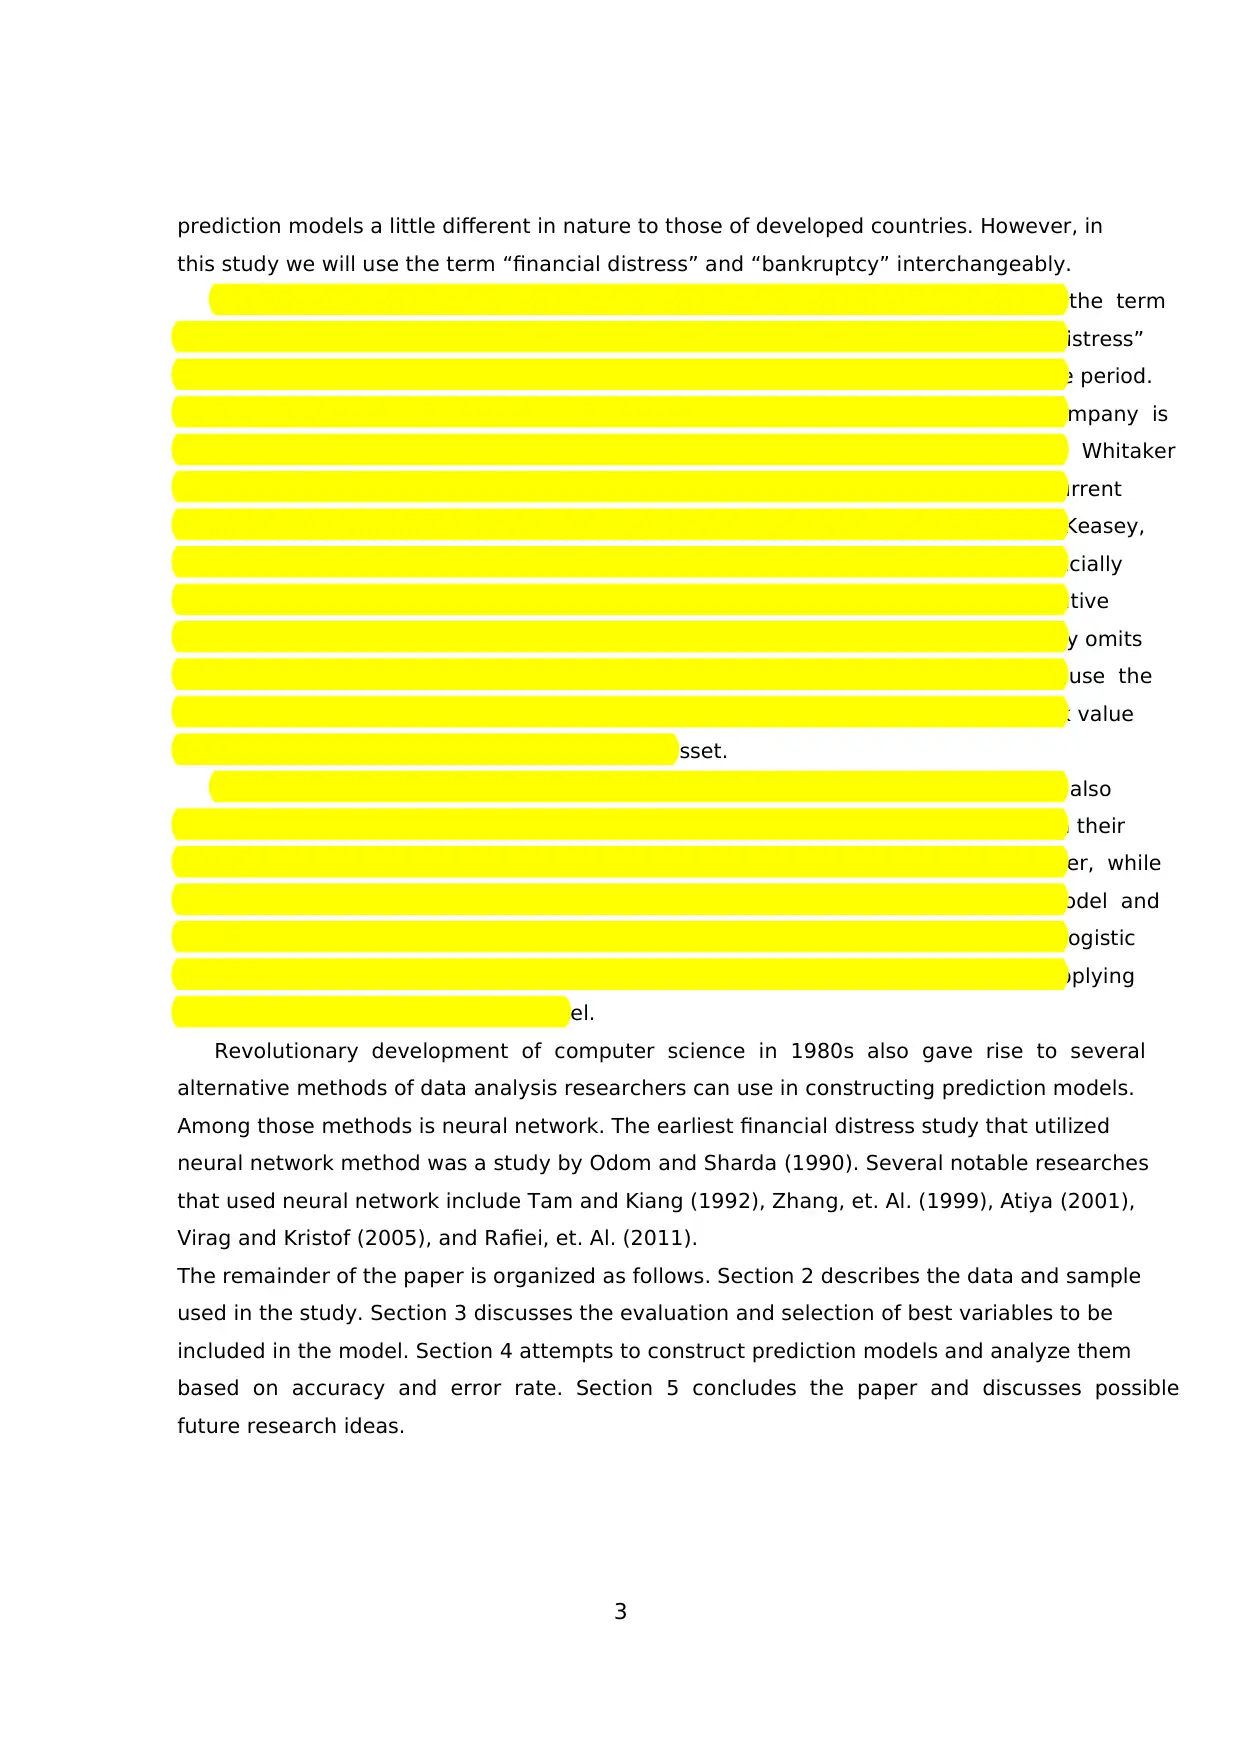
It is necessary to understand that there is no single accurate definition of the term
“financial distress” itself. Hofer (1980) as noted in Luciana (2006) defines “financial distress”
as a condition in which a company suffers from negative net income for a consecutive period.
Luciana (2006) herself defines “financial distress” as a condition in which a company is
delisted as a consequence of having negative net income and negative equity. Whitaker
(1999) identifies the condition in which the cash flow of a company is less than the current
portion of company’s long-term debt as definition of company in “financial distress”. Keasey,
et. Al. (2009) and Asquith, Gertner, and Scharfstein (1994) classify a firm as “financially
distressed” if the company’s EBITDA is less than its financial expense for two consecutive
years. Lau (1987) prefers to see “financial distress” as a condition in which a company omits
or reduces dividend payment to its shareholders. In our study, we decided to use the
financial distress definition as stated by Ross (2008) and Luciana (2006), i.e. the book value
of total debt exceeding the book value of total asset.
The statistical methods used to analyze the variables and constructing the model also
vary between researchers. Early researchers in this field used discriminant analysis in their
studies. Beaver (1966) used univariate form of discriminant analysis in his paper, while
multivariate discriminate analysis was used by Altman (1968) in his Z-score model and
Springate (1984). Then Ohlson (1980) opened the alternative way by utilizing logistic
regression in bankruptcy prediction models. Zmijewski (1983) followed suit by also applying
logistic regression analysis in his model.
Revolutionary development of computer science in 1980s also gave rise to several
alternative methods of data analysis researchers can use in constructing prediction models.
Among those methods is neural network. The earliest financial distress study that utilized
neural network method was a study by Odom and Sharda (1990). Several notable researches
that used neural network include Tam and Kiang (1992), Zhang, et. Al. (1999), Atiya (2001),
Virag and Kristof (2005), and Rafiei, et. Al. (2011).
The remainder of the paper is organized as follows. Section 2 describes the data and sample
used in the study. Section 3 discusses the evaluation and selection of best variables to be
included in the model. Section 4 attempts to construct prediction models and analyze them
based on accuracy and error rate. Section 5 concludes the paper and discusses possible
future research ideas.
prediction models a little different in nature to those of developed countries. However, in
this study we will use the term “financial distress” and “bankruptcy” interchangeably.
It is necessary to understand that there is no single accurate definition of the term
“financial distress” itself. Hofer (1980) as noted in Luciana (2006) defines “financial distress”
as a condition in which a company suffers from negative net income for a consecutive period.
Luciana (2006) herself defines “financial distress” as a condition in which a company is
delisted as a consequence of having negative net income and negative equity. Whitaker
(1999) identifies the condition in which the cash flow of a company is less than the current
portion of company’s long-term debt as definition of company in “financial distress”. Keasey,
et. Al. (2009) and Asquith, Gertner, and Scharfstein (1994) classify a firm as “financially
distressed” if the company’s EBITDA is less than its financial expense for two consecutive
years. Lau (1987) prefers to see “financial distress” as a condition in which a company omits
or reduces dividend payment to its shareholders. In our study, we decided to use the
financial distress definition as stated by Ross (2008) and Luciana (2006), i.e. the book value
of total debt exceeding the book value of total asset.
The statistical methods used to analyze the variables and constructing the model also
vary between researchers. Early researchers in this field used discriminant analysis in their
studies. Beaver (1966) used univariate form of discriminant analysis in his paper, while
multivariate discriminate analysis was used by Altman (1968) in his Z-score model and
Springate (1984). Then Ohlson (1980) opened the alternative way by utilizing logistic
regression in bankruptcy prediction models. Zmijewski (1983) followed suit by also applying
logistic regression analysis in his model.
Revolutionary development of computer science in 1980s also gave rise to several
alternative methods of data analysis researchers can use in constructing prediction models.
Among those methods is neural network. The earliest financial distress study that utilized
neural network method was a study by Odom and Sharda (1990). Several notable researches
that used neural network include Tam and Kiang (1992), Zhang, et. Al. (1999), Atiya (2001),
Virag and Kristof (2005), and Rafiei, et. Al. (2011).
The remainder of the paper is organized as follows. Section 2 describes the data and sample
used in the study. Section 3 discusses the evaluation and selection of best variables to be
included in the model. Section 4 attempts to construct prediction models and analyze them
based on accuracy and error rate. Section 5 concludes the paper and discusses possible
future research ideas.
Secure Best Marks with AI Grader
Need help grading? Try our AI Grader for instant feedback on your assignments.
4
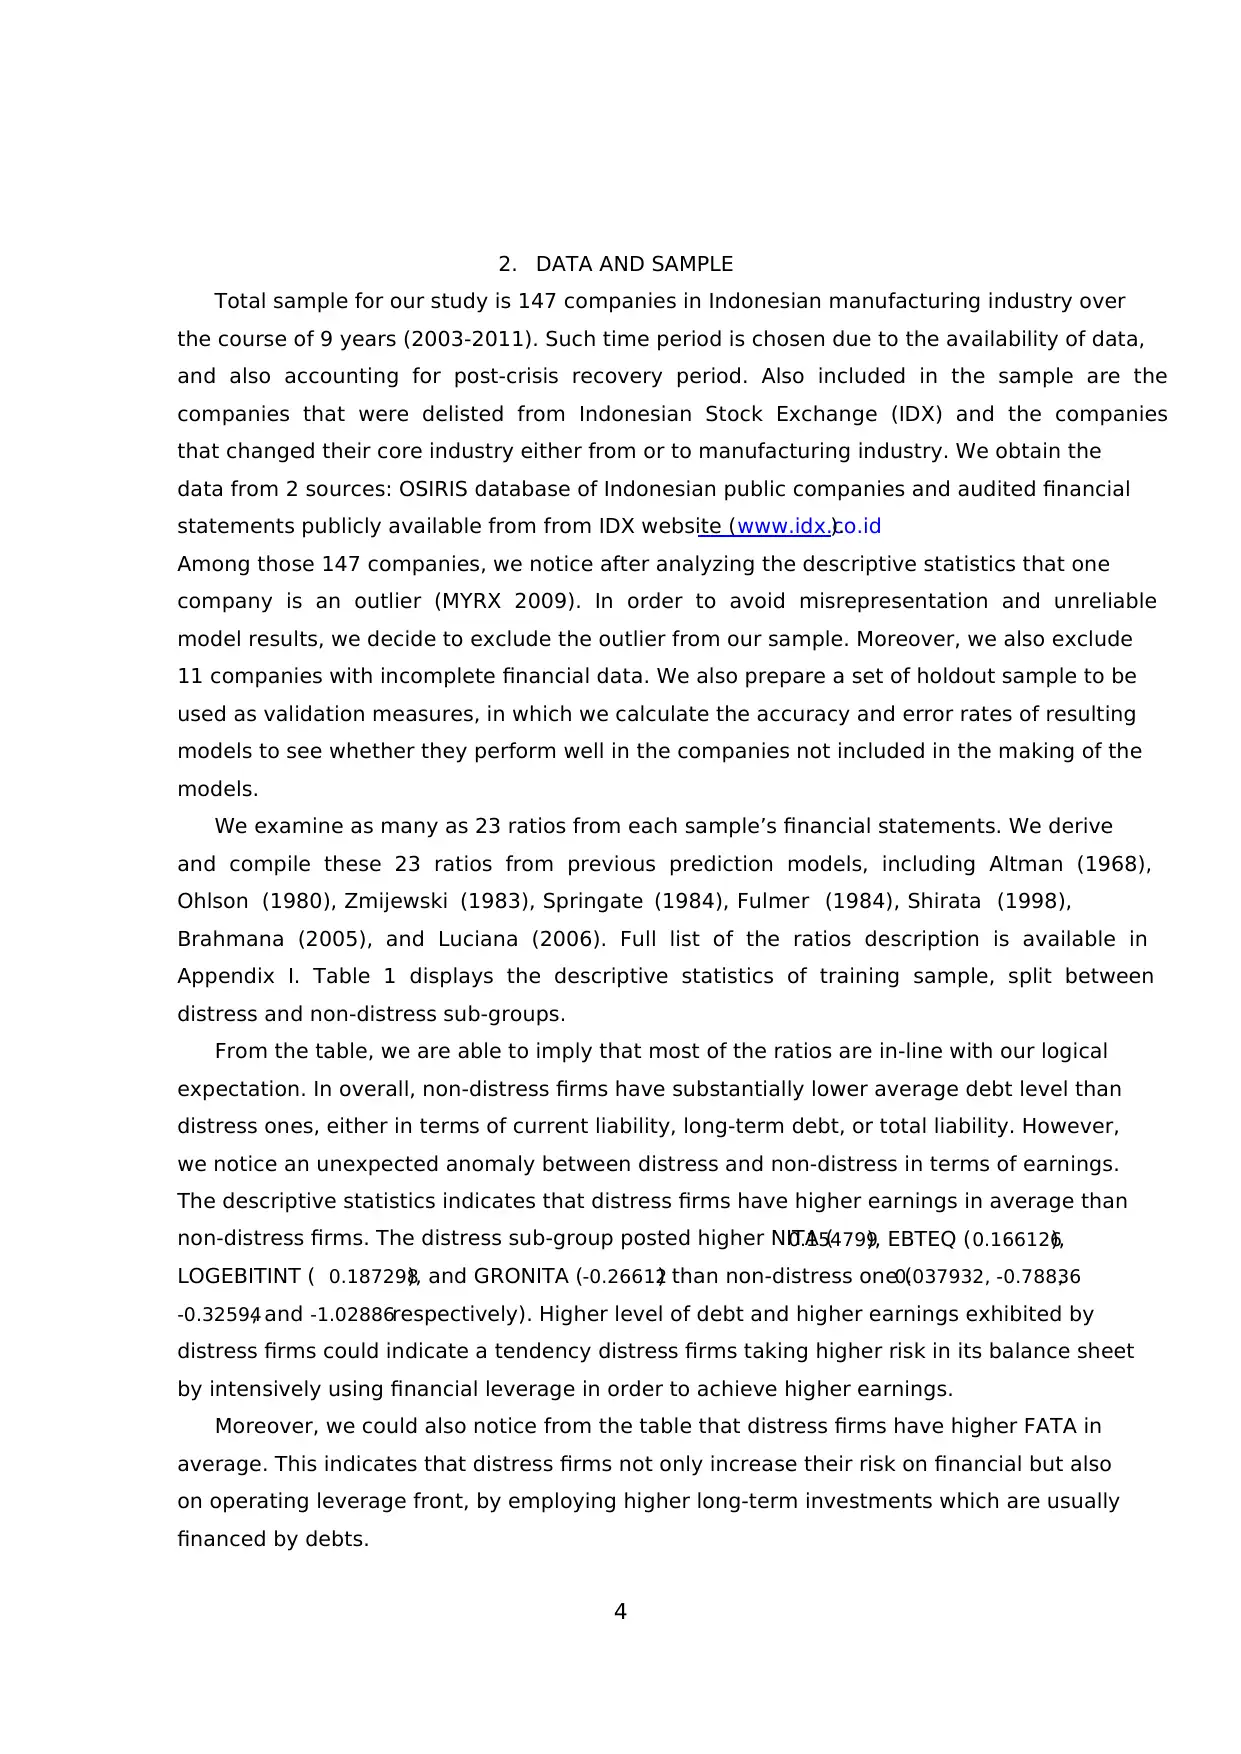
2. DATA AND SAMPLE
Total sample for our study is 147 companies in Indonesian manufacturing industry over
the course of 9 years (2003-2011). Such time period is chosen due to the availability of data,
and also accounting for post-crisis recovery period. Also included in the sample are the
companies that were delisted from Indonesian Stock Exchange (IDX) and the companies
that changed their core industry either from or to manufacturing industry. We obtain the
data from 2 sources: OSIRIS database of Indonesian public companies and audited financial
statements publicly available from from IDX website (www.idx.co.id).
Among those 147 companies, we notice after analyzing the descriptive statistics that one
company is an outlier (MYRX 2009). In order to avoid misrepresentation and unreliable
model results, we decide to exclude the outlier from our sample. Moreover, we also exclude
11 companies with incomplete financial data. We also prepare a set of holdout sample to be
used as validation measures, in which we calculate the accuracy and error rates of resulting
models to see whether they perform well in the companies not included in the making of the
models.
We examine as many as 23 ratios from each sample’s financial statements. We derive
and compile these 23 ratios from previous prediction models, including Altman (1968),
Ohlson (1980), Zmijewski (1983), Springate (1984), Fulmer (1984), Shirata (1998),
Brahmana (2005), and Luciana (2006). Full list of the ratios description is available in
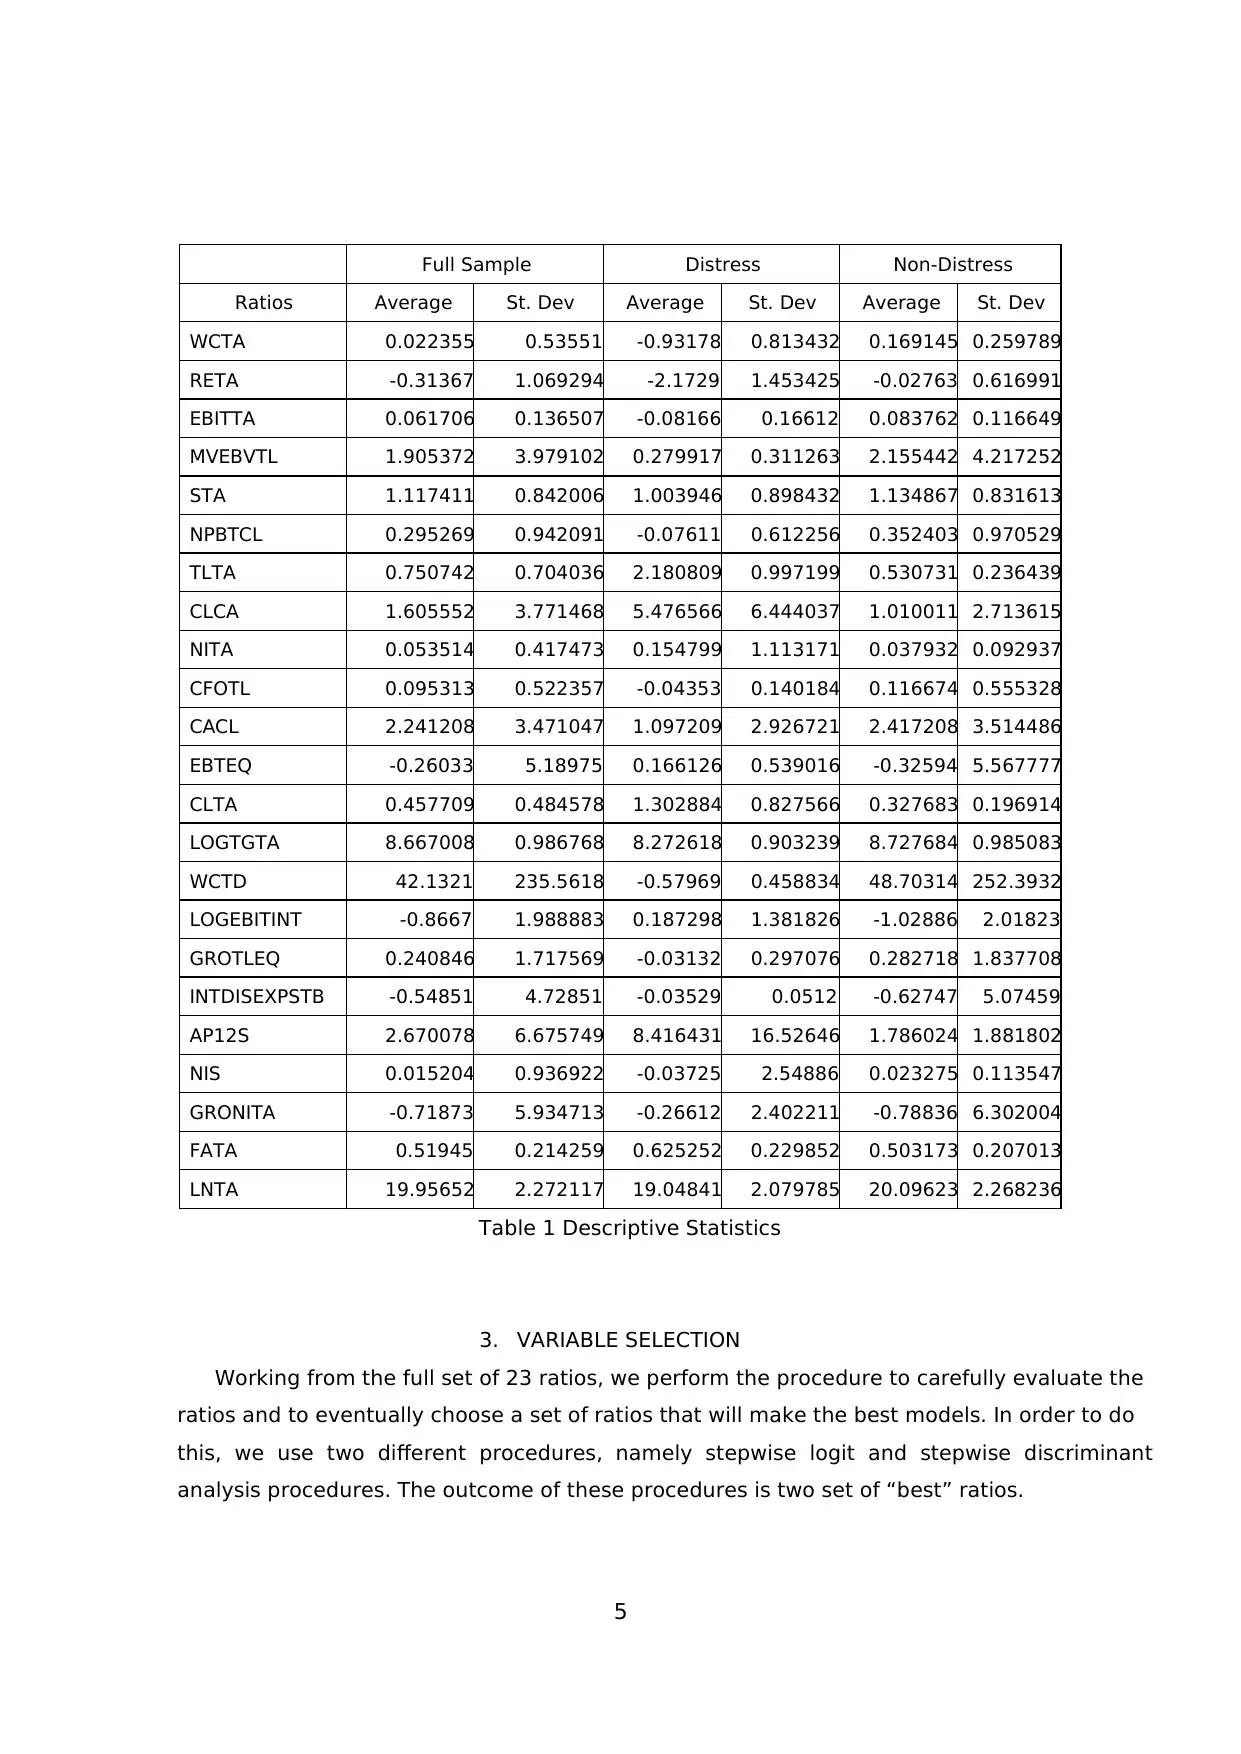
Appendix I. Table 1 displays the descriptive statistics of training sample, split between
distress and non-distress sub-groups.
From the table, we are able to imply that most of the ratios are in-line with our logical
expectation. In overall, non-distress firms have substantially lower average debt level than
distress ones, either in terms of current liability, long-term debt, or total liability. However,
we notice an unexpected anomaly between distress and non-distress in terms of earnings.
The descriptive statistics indicates that distress firms have higher earnings in average than
non-distress firms. The distress sub-group posted higher NITA (0.154799), EBTEQ (0.166126),
LOGEBITINT ( 0.187298), and GRONITA (-0.26612) than non-distress one (0.037932, -0.78836,
-0.32594, and -1.02886respectively). Higher level of debt and higher earnings exhibited by
distress firms could indicate a tendency distress firms taking higher risk in its balance sheet
by intensively using financial leverage in order to achieve higher earnings.
Moreover, we could also notice from the table that distress firms have higher FATA in
average. This indicates that distress firms not only increase their risk on financial but also
on operating leverage front, by employing higher long-term investments which are usually
financed by debts.
2. DATA AND SAMPLE
Total sample for our study is 147 companies in Indonesian manufacturing industry over
the course of 9 years (2003-2011). Such time period is chosen due to the availability of data,
and also accounting for post-crisis recovery period. Also included in the sample are the
companies that were delisted from Indonesian Stock Exchange (IDX) and the companies
that changed their core industry either from or to manufacturing industry. We obtain the
data from 2 sources: OSIRIS database of Indonesian public companies and audited financial
statements publicly available from from IDX website (www.idx.co.id).
Among those 147 companies, we notice after analyzing the descriptive statistics that one
company is an outlier (MYRX 2009). In order to avoid misrepresentation and unreliable
model results, we decide to exclude the outlier from our sample. Moreover, we also exclude
11 companies with incomplete financial data. We also prepare a set of holdout sample to be
used as validation measures, in which we calculate the accuracy and error rates of resulting
models to see whether they perform well in the companies not included in the making of the
models.
We examine as many as 23 ratios from each sample’s financial statements. We derive
and compile these 23 ratios from previous prediction models, including Altman (1968),
Ohlson (1980), Zmijewski (1983), Springate (1984), Fulmer (1984), Shirata (1998),
Brahmana (2005), and Luciana (2006). Full list of the ratios description is available in
Appendix I. Table 1 displays the descriptive statistics of training sample, split between
distress and non-distress sub-groups.
From the table, we are able to imply that most of the ratios are in-line with our logical
expectation. In overall, non-distress firms have substantially lower average debt level than
distress ones, either in terms of current liability, long-term debt, or total liability. However,
we notice an unexpected anomaly between distress and non-distress in terms of earnings.
The descriptive statistics indicates that distress firms have higher earnings in average than
non-distress firms. The distress sub-group posted higher NITA (0.154799), EBTEQ (0.166126),
LOGEBITINT ( 0.187298), and GRONITA (-0.26612) than non-distress one (0.037932, -0.78836,
-0.32594, and -1.02886respectively). Higher level of debt and higher earnings exhibited by
distress firms could indicate a tendency distress firms taking higher risk in its balance sheet
by intensively using financial leverage in order to achieve higher earnings.
Moreover, we could also notice from the table that distress firms have higher FATA in
average. This indicates that distress firms not only increase their risk on financial but also
on operating leverage front, by employing higher long-term investments which are usually
financed by debts.
5
Full Sample Distress Non-Distress
Ratios Average St. Dev Average St. Dev Average St. Dev
WCTA 0.022355 0.53551 -0.93178 0.813432 0.169145 0.259789
RETA -0.31367 1.069294 -2.1729 1.453425 -0.02763 0.616991
EBITTA 0.061706 0.136507 -0.08166 0.16612 0.083762 0.116649
MVEBVTL 1.905372 3.979102 0.279917 0.311263 2.155442 4.217252
STA 1.117411 0.842006 1.003946 0.898432 1.134867 0.831613
NPBTCL 0.295269 0.942091 -0.07611 0.612256 0.352403 0.970529
TLTA 0.750742 0.704036 2.180809 0.997199 0.530731 0.236439
CLCA 1.605552 3.771468 5.476566 6.444037 1.010011 2.713615
NITA 0.053514 0.417473 0.154799 1.113171 0.037932 0.092937
CFOTL 0.095313 0.522357 -0.04353 0.140184 0.116674 0.555328
CACL 2.241208 3.471047 1.097209 2.926721 2.417208 3.514486
EBTEQ -0.26033 5.18975 0.166126 0.539016 -0.32594 5.567777
CLTA 0.457709 0.484578 1.302884 0.827566 0.327683 0.196914
LOGTGTA 8.667008 0.986768 8.272618 0.903239 8.727684 0.985083
WCTD 42.1321 235.5618 -0.57969 0.458834 48.70314 252.3932
LOGEBITINT -0.8667 1.988883 0.187298 1.381826 -1.02886 2.01823
GROTLEQ 0.240846 1.717569 -0.03132 0.297076 0.282718 1.837708
INTDISEXPSTB -0.54851 4.72851 -0.03529 0.0512 -0.62747 5.07459
AP12S 2.670078 6.675749 8.416431 16.52646 1.786024 1.881802
NIS 0.015204 0.936922 -0.03725 2.54886 0.023275 0.113547
GRONITA -0.71873 5.934713 -0.26612 2.402211 -0.78836 6.302004
FATA 0.51945 0.214259 0.625252 0.229852 0.503173 0.207013
LNTA 19.95652 2.272117 19.04841 2.079785 20.09623 2.268236
Table 1 Descriptive Statistics
3. VARIABLE SELECTION
Working from the full set of 23 ratios, we perform the procedure to carefully evaluate the
ratios and to eventually choose a set of ratios that will make the best models. In order to do
this, we use two different procedures, namely stepwise logit and stepwise discriminant
analysis procedures. The outcome of these procedures is two set of “best” ratios.
6
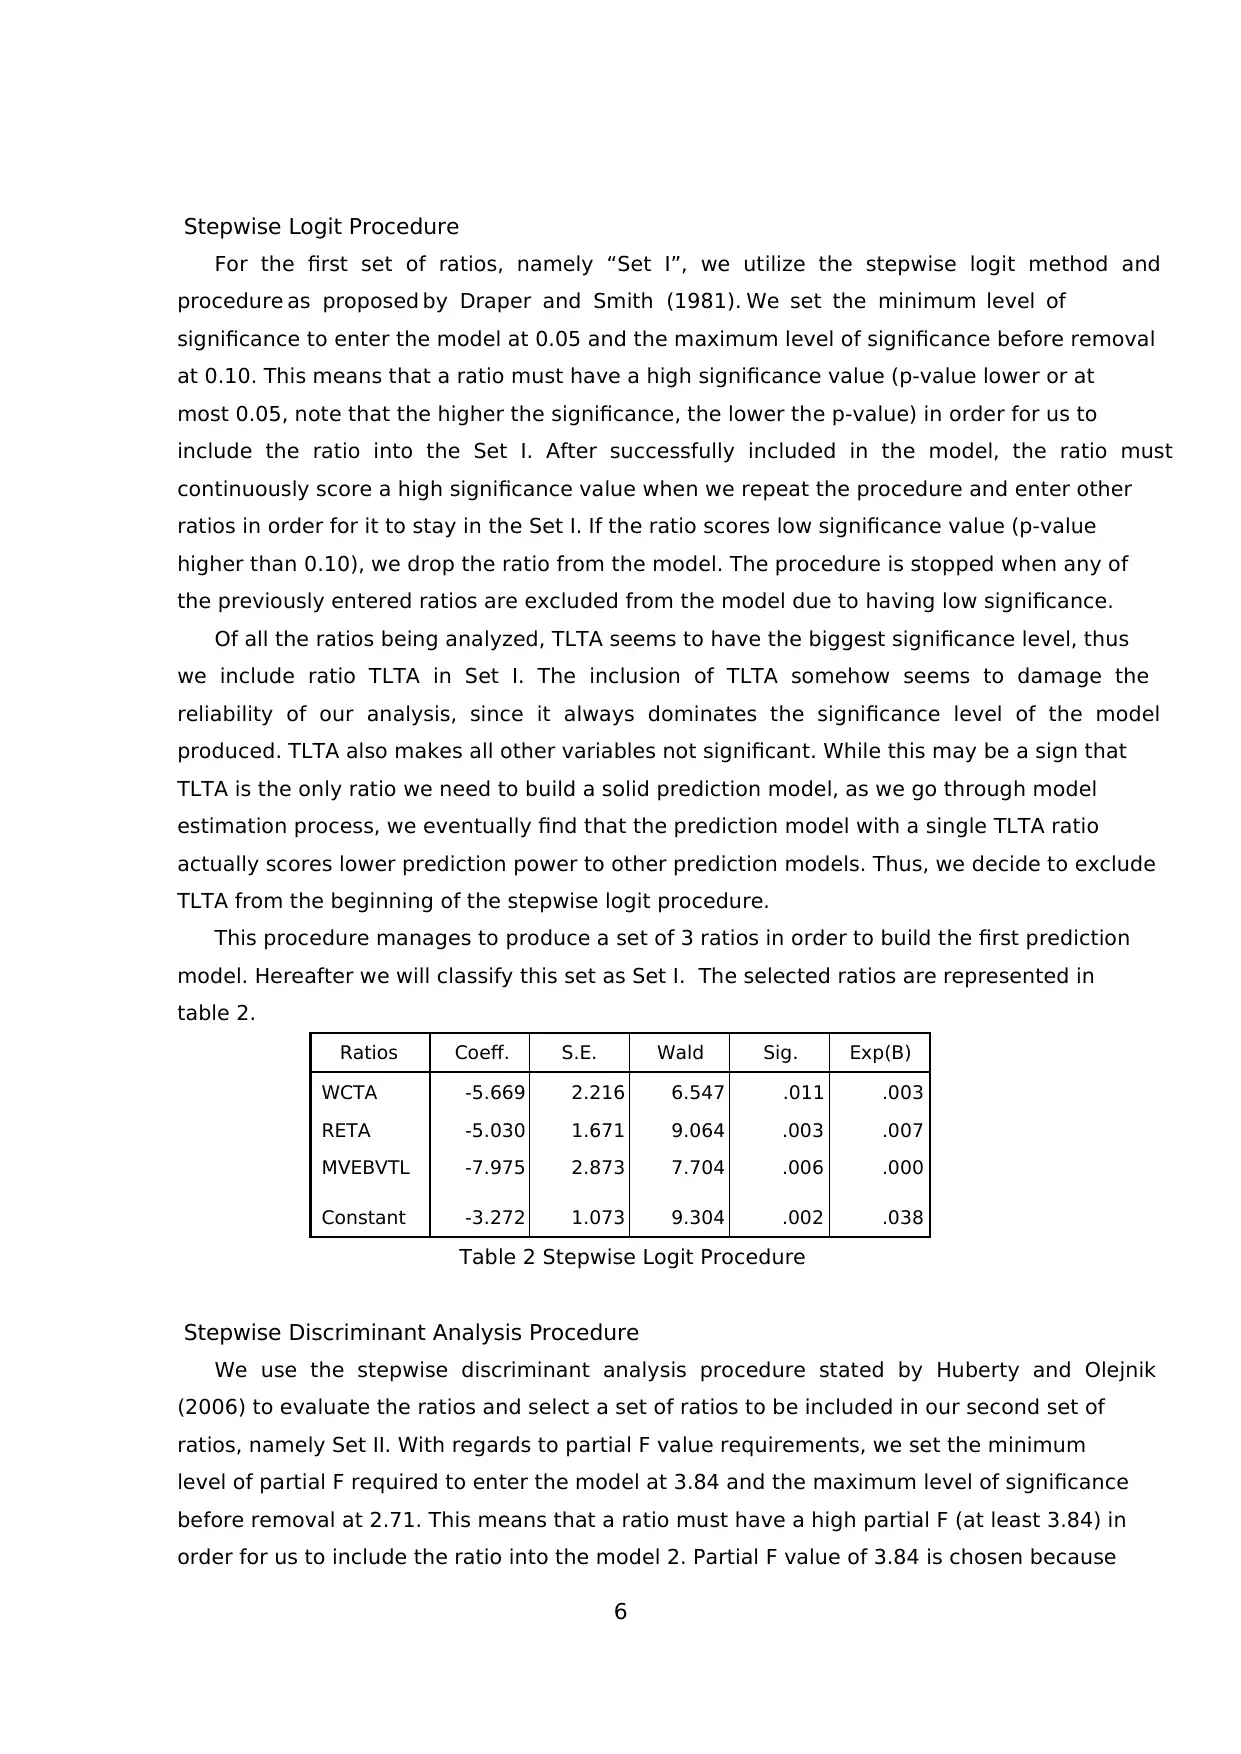
Stepwise Logit Procedure
For the first set of ratios, namely “Set I”, we utilize the stepwise logit method and
procedure as proposed by Draper and Smith (1981). We set the minimum level of
significance to enter the model at 0.05 and the maximum level of significance before removal
at 0.10. This means that a ratio must have a high significance value (p-value lower or at
most 0.05, note that the higher the significance, the lower the p-value) in order for us to
include the ratio into the Set I. After successfully included in the model, the ratio must
continuously score a high significance value when we repeat the procedure and enter other
ratios in order for it to stay in the Set I. If the ratio scores low significance value (p-value
higher than 0.10), we drop the ratio from the model. The procedure is stopped when any of
the previously entered ratios are excluded from the model due to having low significance.
Of all the ratios being analyzed, TLTA seems to have the biggest significance level, thus
we include ratio TLTA in Set I. The inclusion of TLTA somehow seems to damage the
reliability of our analysis, since it always dominates the significance level of the model
produced. TLTA also makes all other variables not significant. While this may be a sign that
TLTA is the only ratio we need to build a solid prediction model, as we go through model
estimation process, we eventually find that the prediction model with a single TLTA ratio
actually scores lower prediction power to other prediction models. Thus, we decide to exclude
TLTA from the beginning of the stepwise logit procedure.
This procedure manages to produce a set of 3 ratios in order to build the first prediction
model. Hereafter we will classify this set as Set I. The selected ratios are represented in
table 2.
Ratios Coeff. S.E. Wald Sig. Exp(B)
WCTA -5.669 2.216 6.547 .011 .003
RETA -5.030 1.671 9.064 .003 .007
MVEBVTL -7.975 2.873 7.704 .006 .000
Constant -3.272 1.073 9.304 .002 .038
Table 2 Stepwise Logit Procedure
Stepwise Discriminant Analysis Procedure
We use the stepwise discriminant analysis procedure stated by Huberty and Olejnik
(2006) to evaluate the ratios and select a set of ratios to be included in our second set of
ratios, namely Set II. With regards to partial F value requirements, we set the minimum
level of partial F required to enter the model at 3.84 and the maximum level of significance
before removal at 2.71. This means that a ratio must have a high partial F (at least 3.84) in
order for us to include the ratio into the model 2. Partial F value of 3.84 is chosen because
Paraphrase This Document
Need a fresh take? Get an instant paraphrase of this document with our AI Paraphraser
7
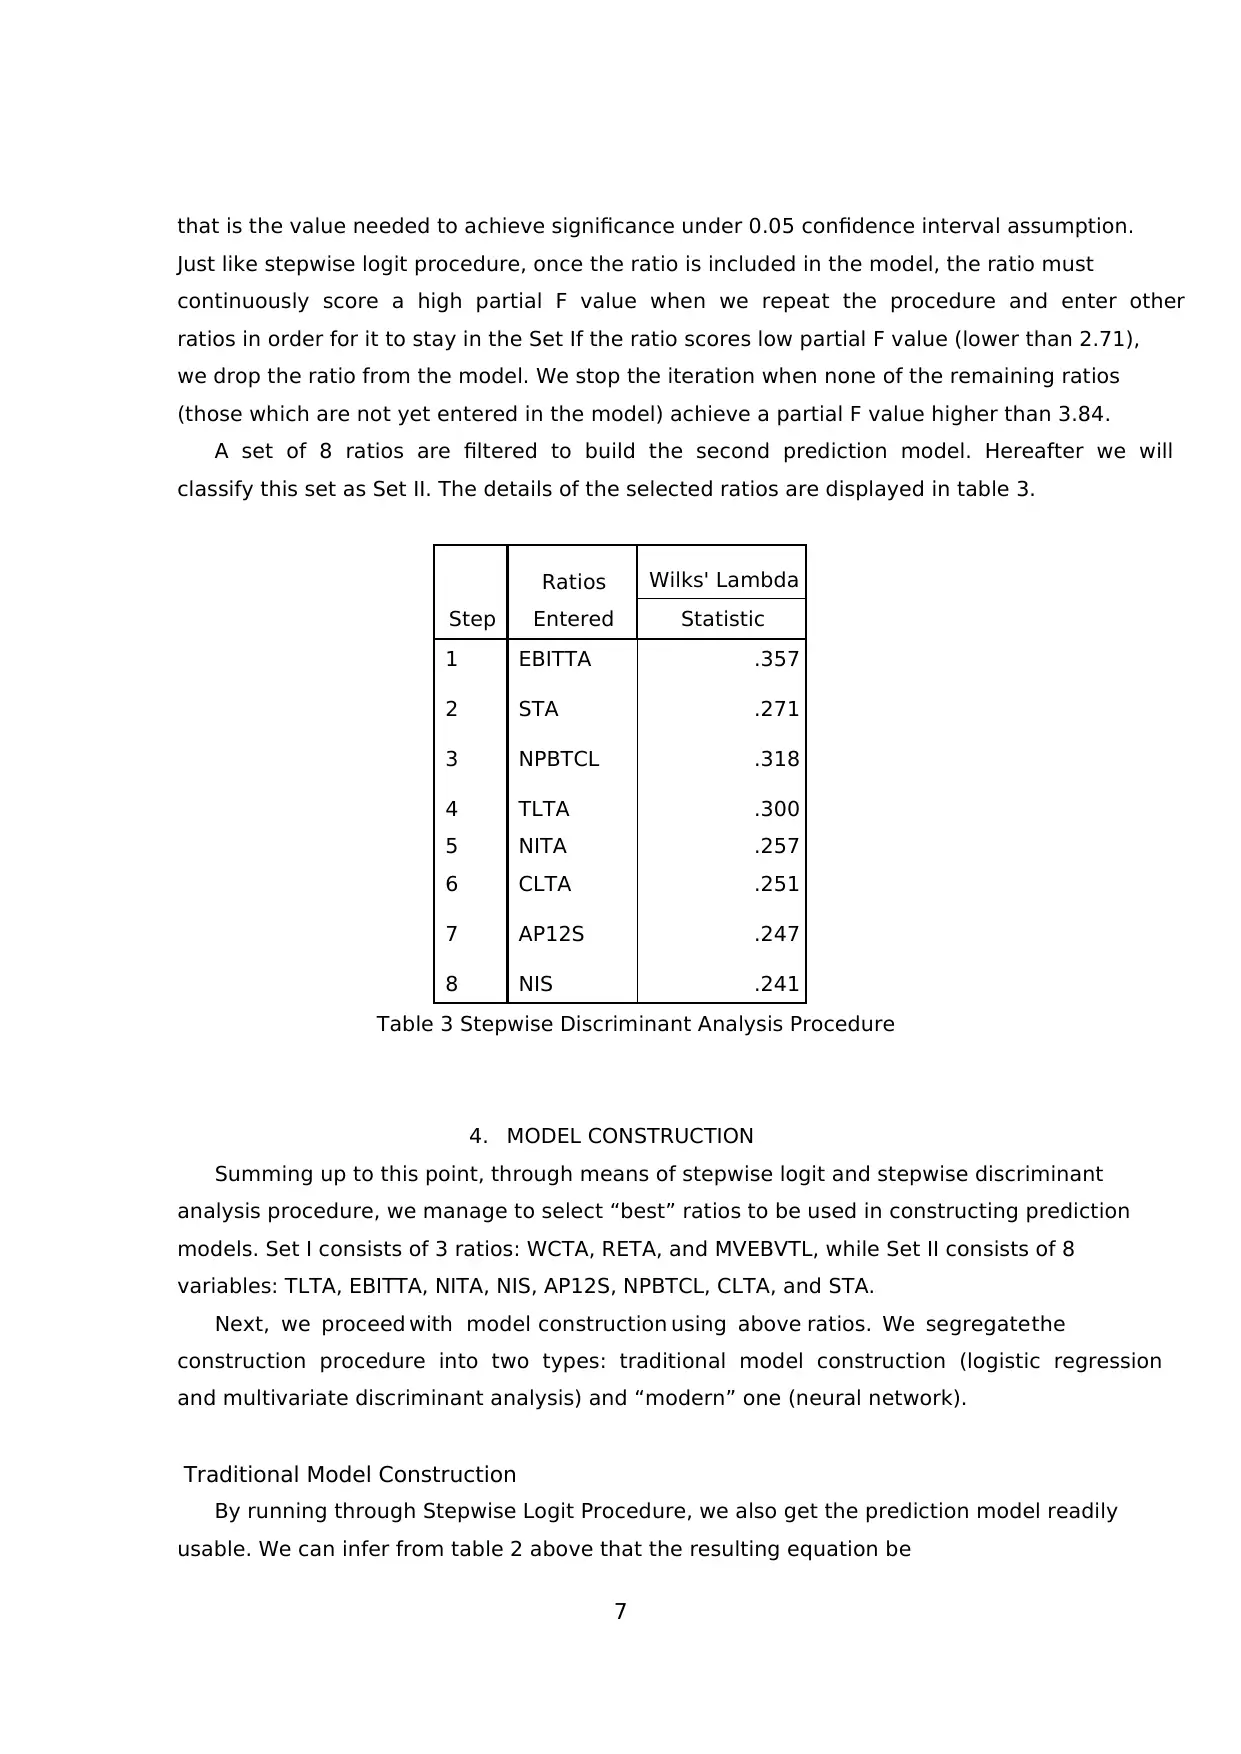
that is the value needed to achieve significance under 0.05 confidence interval assumption.
Just like stepwise logit procedure, once the ratio is included in the model, the ratio must
continuously score a high partial F value when we repeat the procedure and enter other
ratios in order for it to stay in the Set If the ratio scores low partial F value (lower than 2.71),
we drop the ratio from the model. We stop the iteration when none of the remaining ratios
(those which are not yet entered in the model) achieve a partial F value higher than 3.84.
A set of 8 ratios are filtered to build the second prediction model. Hereafter we will
classify this set as Set II. The details of the selected ratios are displayed in table 3.
Step
Ratios
Entered
Wilks' Lambda
Statistic
1 EBITTA .357
2 STA .271
3 NPBTCL .318
4 TLTA .300
5 NITA .257
6 CLTA .251
7 AP12S .247
8 NIS .241
Table 3 Stepwise Discriminant Analysis Procedure
4. MODEL CONSTRUCTION
Summing up to this point, through means of stepwise logit and stepwise discriminant
analysis procedure, we manage to select “best” ratios to be used in constructing prediction
models. Set I consists of 3 ratios: WCTA, RETA, and MVEBVTL, while Set II consists of 8
variables: TLTA, EBITTA, NITA, NIS, AP12S, NPBTCL, CLTA, and STA.
Next, we proceed with model construction using above ratios. We segregate the
construction procedure into two types: traditional model construction (logistic regression
and multivariate discriminant analysis) and “modern” one (neural network).
Traditional Model Construction
By running through Stepwise Logit Procedure, we also get the prediction model readily
usable. We can infer from table 2 above that the resulting equation be
8
1 ; where:
1 y
distress e −
= +
3.272 5.669 5.03 7.975y WCTA RETA MVEBVTL= − − − − …….(1)
Variable distress implies the probability of company suffering from financial distress in
the next fiscal period, WCTA refers to Working Capital per Total Asset, RETA is Retained
Earnings per Total Asset, and MVEBVTL refers to Market Value of Equity divided by Book
Value of Total Liability.
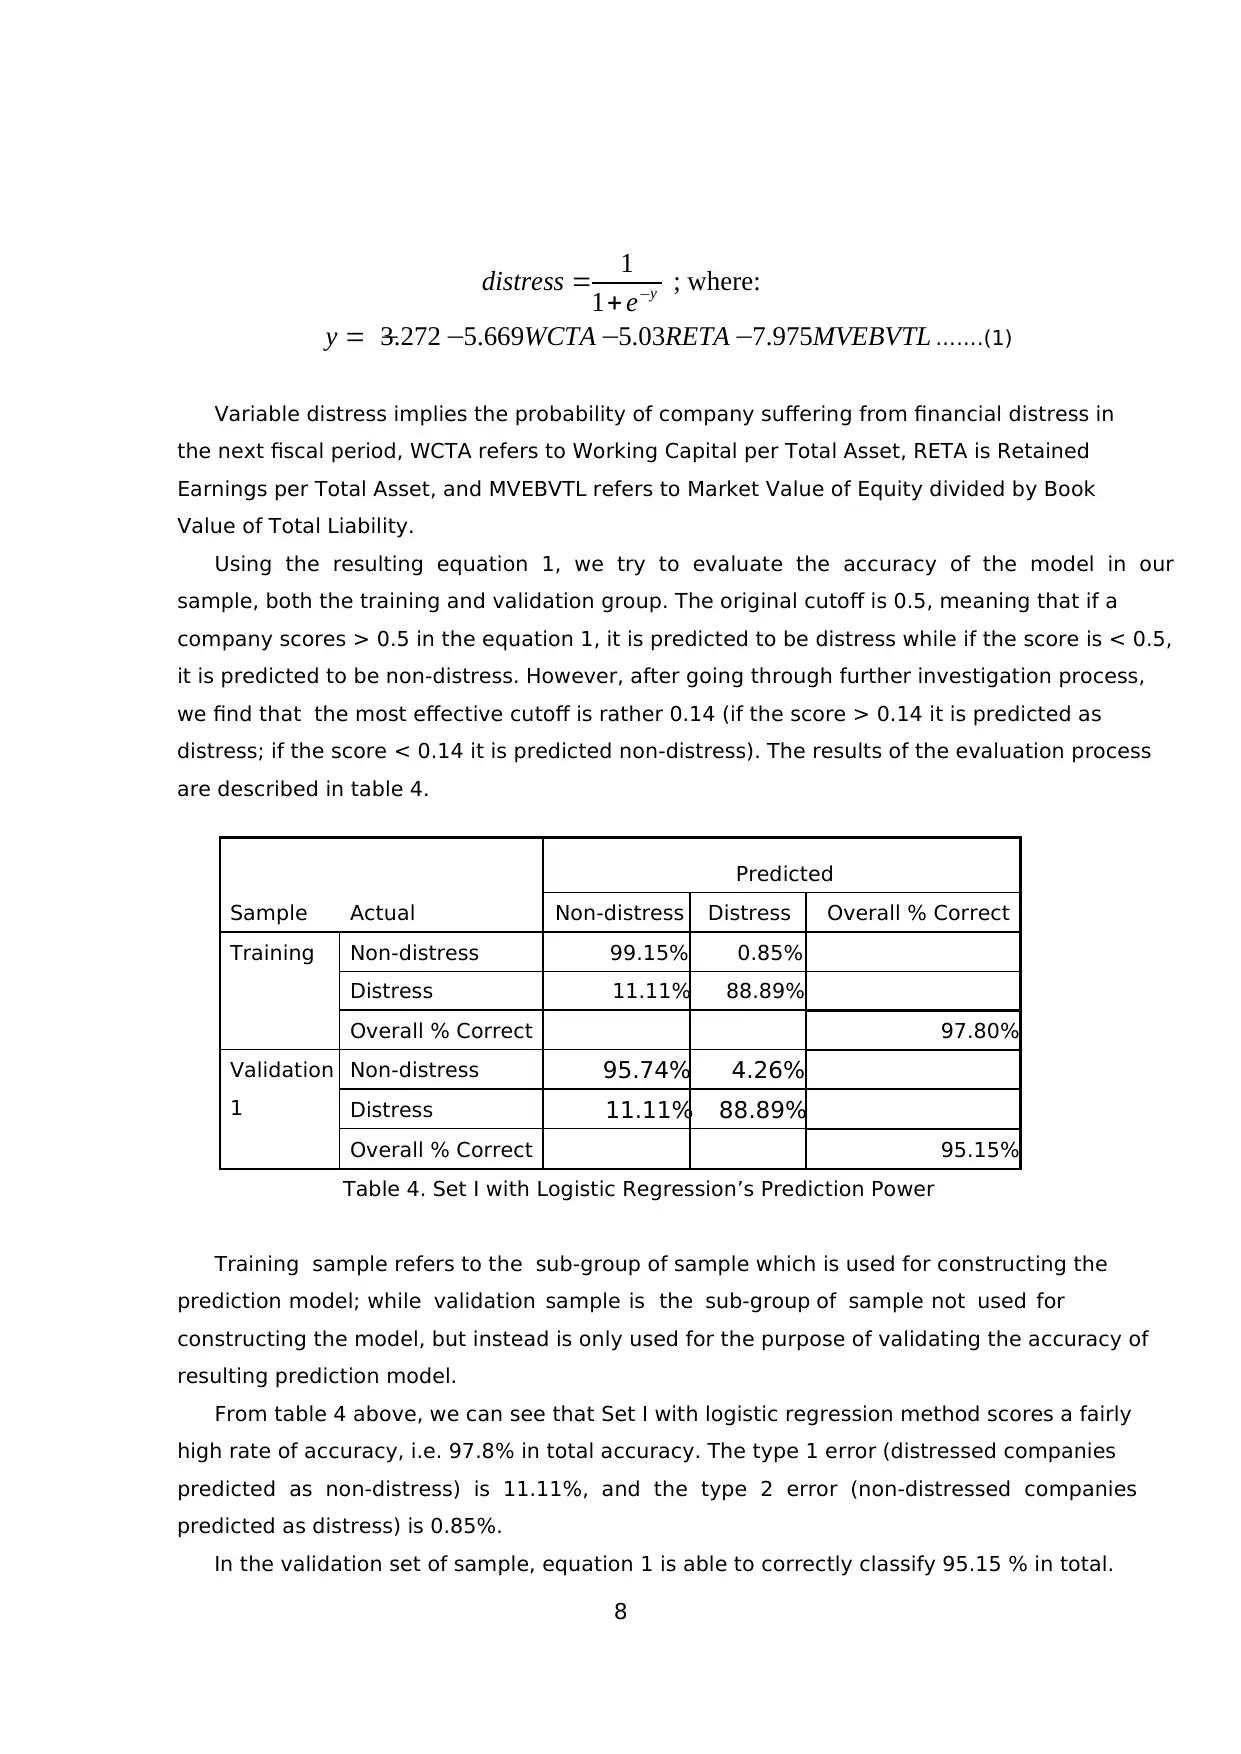
Using the resulting equation 1, we try to evaluate the accuracy of the model in our
sample, both the training and validation group. The original cutoff is 0.5, meaning that if a
company scores > 0.5 in the equation 1, it is predicted to be distress while if the score is < 0.5,
it is predicted to be non-distress. However, after going through further investigation process,
we find that the most effective cutoff is rather 0.14 (if the score > 0.14 it is predicted as
distress; if the score < 0.14 it is predicted non-distress). The results of the evaluation process
are described in table 4.
Sample Actual
Predicted
Non-distress Distress Overall % Correct
Training Non-distress 99.15% 0.85%
Distress 11.11% 88.89%
Overall % Correct 97.80%
Validation
1
Non-distress 95.74% 4.26%
Distress 11.11% 88.89%
Overall % Correct 95.15%
Table 4. Set I with Logistic Regression’s Prediction Power
Training sample refers to the sub-group of sample which is used for constructing the
prediction model; while validation sample is the sub-group of sample not used for
constructing the model, but instead is only used for the purpose of validating the accuracy of
resulting prediction model.
From table 4 above, we can see that Set I with logistic regression method scores a fairly
high rate of accuracy, i.e. 97.8% in total accuracy. The type 1 error (distressed companies
predicted as non-distress) is 11.11%, and the type 2 error (non-distressed companies
predicted as distress) is 0.85%.
In the validation set of sample, equation 1 is able to correctly classify 95.15 % in total.
1 ; where:
1 y
distress e −
= +
3.272 5.669 5.03 7.975y WCTA RETA MVEBVTL= − − − − …….(1)
Variable distress implies the probability of company suffering from financial distress in
the next fiscal period, WCTA refers to Working Capital per Total Asset, RETA is Retained
Earnings per Total Asset, and MVEBVTL refers to Market Value of Equity divided by Book
Value of Total Liability.
Using the resulting equation 1, we try to evaluate the accuracy of the model in our
sample, both the training and validation group. The original cutoff is 0.5, meaning that if a
company scores > 0.5 in the equation 1, it is predicted to be distress while if the score is < 0.5,
it is predicted to be non-distress. However, after going through further investigation process,
we find that the most effective cutoff is rather 0.14 (if the score > 0.14 it is predicted as
distress; if the score < 0.14 it is predicted non-distress). The results of the evaluation process
are described in table 4.
Sample Actual
Predicted
Non-distress Distress Overall % Correct
Training Non-distress 99.15% 0.85%
Distress 11.11% 88.89%
Overall % Correct 97.80%
Validation
1
Non-distress 95.74% 4.26%
Distress 11.11% 88.89%
Overall % Correct 95.15%
Table 4. Set I with Logistic Regression’s Prediction Power
Training sample refers to the sub-group of sample which is used for constructing the
prediction model; while validation sample is the sub-group of sample not used for
constructing the model, but instead is only used for the purpose of validating the accuracy of
resulting prediction model.
From table 4 above, we can see that Set I with logistic regression method scores a fairly
high rate of accuracy, i.e. 97.8% in total accuracy. The type 1 error (distressed companies
predicted as non-distress) is 11.11%, and the type 2 error (non-distressed companies
predicted as distress) is 0.85%.
In the validation set of sample, equation 1 is able to correctly classify 95.15 % in total.
9
The characteristic of error is also quite acceptable, with type 1 error at 11.11% and type 2
error at 4.26%.
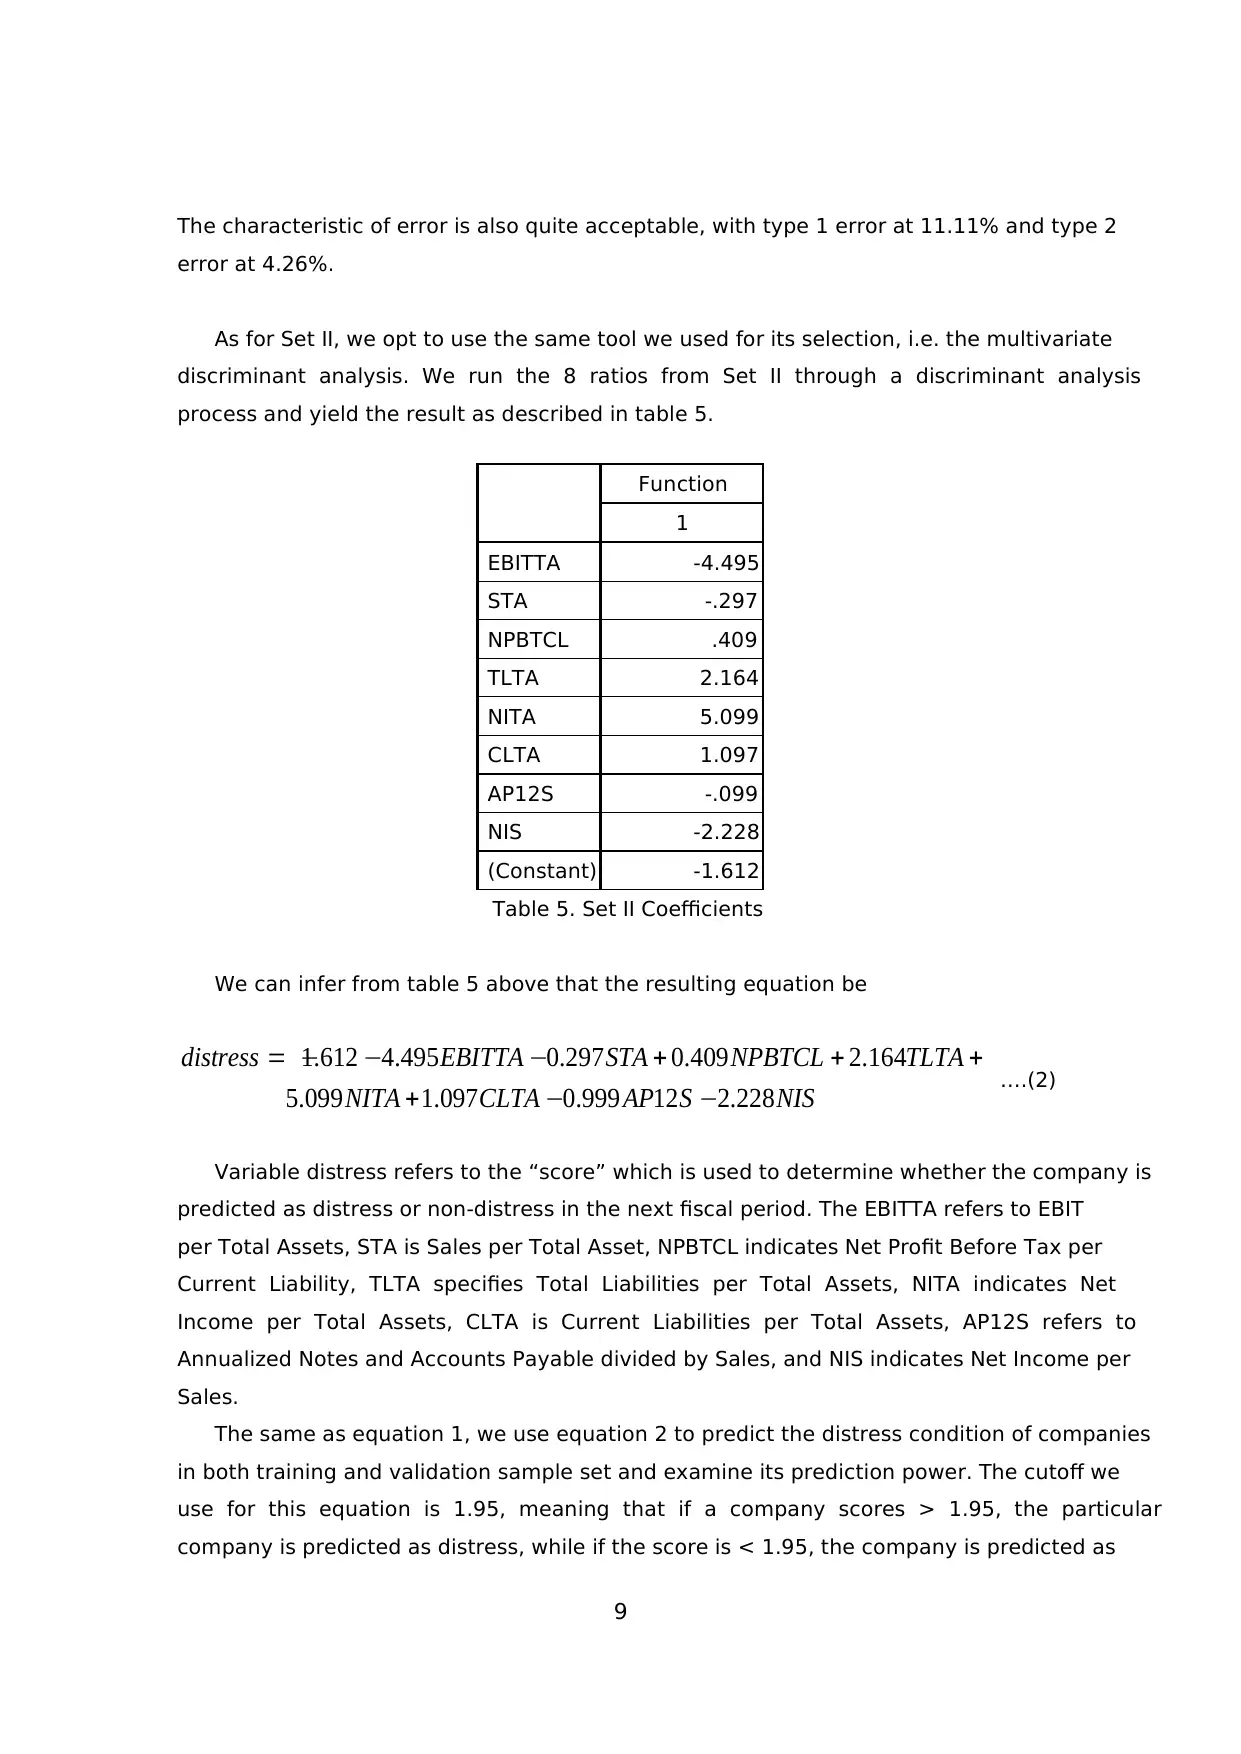
As for Set II, we opt to use the same tool we used for its selection, i.e. the multivariate
discriminant analysis. We run the 8 ratios from Set II through a discriminant analysis
process and yield the result as described in table 5.
Function
1
EBITTA -4.495
STA -.297
NPBTCL .409
TLTA 2.164
NITA 5.099
CLTA 1.097
AP12S -.099
NIS -2.228
(Constant) -1.612
Table 5. Set II Coefficients
We can infer from table 5 above that the resulting equation be
1.612 4.495 0.297 0.409 2.164
5.099 1.097 0.999 12 2.228
distress EBITTA STA NPBTCL TLTA
NITA CLTA AP S NIS
= − − − + + +
+ − − ….(2)
Variable distress refers to the “score” which is used to determine whether the company is
predicted as distress or non-distress in the next fiscal period. The EBITTA refers to EBIT
per Total Assets, STA is Sales per Total Asset, NPBTCL indicates Net Profit Before Tax per
Current Liability, TLTA specifies Total Liabilities per Total Assets, NITA indicates Net
Income per Total Assets, CLTA is Current Liabilities per Total Assets, AP12S refers to
Annualized Notes and Accounts Payable divided by Sales, and NIS indicates Net Income per
Sales.
The same as equation 1, we use equation 2 to predict the distress condition of companies
in both training and validation sample set and examine its prediction power. The cutoff we
use for this equation is 1.95, meaning that if a company scores > 1.95, the particular
company is predicted as distress, while if the score is < 1.95, the company is predicted as
The characteristic of error is also quite acceptable, with type 1 error at 11.11% and type 2
error at 4.26%.
As for Set II, we opt to use the same tool we used for its selection, i.e. the multivariate
discriminant analysis. We run the 8 ratios from Set II through a discriminant analysis
process and yield the result as described in table 5.
Function
1
EBITTA -4.495
STA -.297
NPBTCL .409
TLTA 2.164
NITA 5.099
CLTA 1.097
AP12S -.099
NIS -2.228
(Constant) -1.612
Table 5. Set II Coefficients
We can infer from table 5 above that the resulting equation be
1.612 4.495 0.297 0.409 2.164
5.099 1.097 0.999 12 2.228
distress EBITTA STA NPBTCL TLTA
NITA CLTA AP S NIS
= − − − + + +
+ − − ….(2)
Variable distress refers to the “score” which is used to determine whether the company is
predicted as distress or non-distress in the next fiscal period. The EBITTA refers to EBIT
per Total Assets, STA is Sales per Total Asset, NPBTCL indicates Net Profit Before Tax per
Current Liability, TLTA specifies Total Liabilities per Total Assets, NITA indicates Net
Income per Total Assets, CLTA is Current Liabilities per Total Assets, AP12S refers to
Annualized Notes and Accounts Payable divided by Sales, and NIS indicates Net Income per
Sales.
The same as equation 1, we use equation 2 to predict the distress condition of companies
in both training and validation sample set and examine its prediction power. The cutoff we
use for this equation is 1.95, meaning that if a company scores > 1.95, the particular
company is predicted as distress, while if the score is < 1.95, the company is predicted as
Secure Best Marks with AI Grader
Need help grading? Try our AI Grader for instant feedback on your assignments.
10
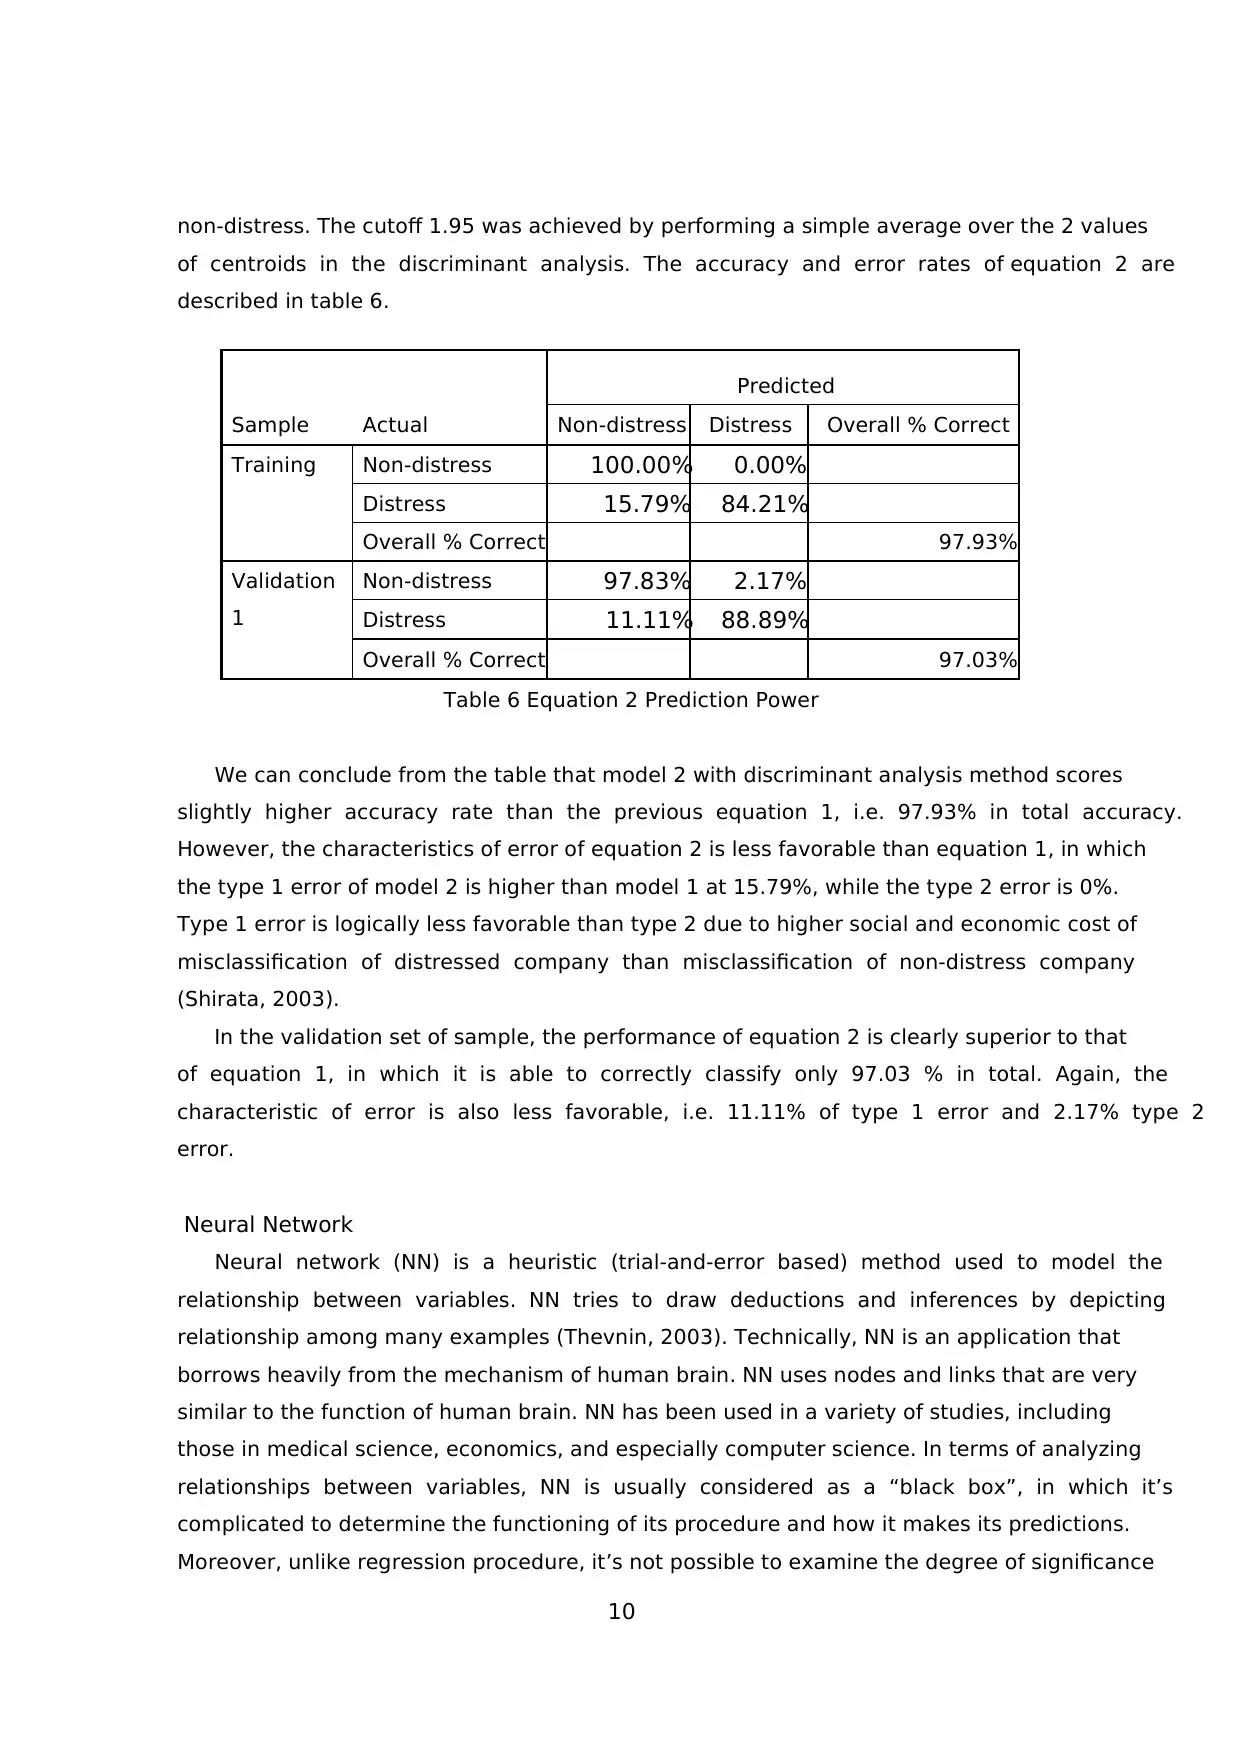
non-distress. The cutoff 1.95 was achieved by performing a simple average over the 2 values
of centroids in the discriminant analysis. The accuracy and error rates of equation 2 are
described in table 6.
Sample Actual
Predicted
Non-distress Distress Overall % Correct
Training Non-distress 100.00% 0.00%
Distress 15.79% 84.21%
Overall % Correct 97.93%
Validation
1
Non-distress 97.83% 2.17%
Distress 11.11% 88.89%
Overall % Correct 97.03%
Table 6 Equation 2 Prediction Power
We can conclude from the table that model 2 with discriminant analysis method scores
slightly higher accuracy rate than the previous equation 1, i.e. 97.93% in total accuracy.
However, the characteristics of error of equation 2 is less favorable than equation 1, in which
the type 1 error of model 2 is higher than model 1 at 15.79%, while the type 2 error is 0%.
Type 1 error is logically less favorable than type 2 due to higher social and economic cost of
misclassification of distressed company than misclassification of non-distress company
(Shirata, 2003).
In the validation set of sample, the performance of equation 2 is clearly superior to that
of equation 1, in which it is able to correctly classify only 97.03 % in total. Again, the
characteristic of error is also less favorable, i.e. 11.11% of type 1 error and 2.17% type 2
error.
Neural Network
Neural network (NN) is a heuristic (trial-and-error based) method used to model the
relationship between variables. NN tries to draw deductions and inferences by depicting
relationship among many examples (Thevnin, 2003). Technically, NN is an application that
borrows heavily from the mechanism of human brain. NN uses nodes and links that are very
similar to the function of human brain. NN has been used in a variety of studies, including
those in medical science, economics, and especially computer science. In terms of analyzing
relationships between variables, NN is usually considered as a “black box”, in which it’s
complicated to determine the functioning of its procedure and how it makes its predictions.
Moreover, unlike regression procedure, it’s not possible to examine the degree of significance
11
of each independent variable. Another major weakness of NN is that it is considerably more
complicated to use compared to a simple and ready-to-use equation produced by logistic
regression or discriminant analysis procedure. Thus a proven and good-performing NN
model might not be able to be exactly replicated by other researchers (for academic purpose)
or to be applied in practice by the common investor. However, unlike traditional statistical
tools which are incapable of identifying non-linear relationship, NN is able to identify either
linear or non-linear relationship that exists in the dataset (Khajanchi, 2002), thus making it
a relatively more powerful predictor than traditional statistical tools.
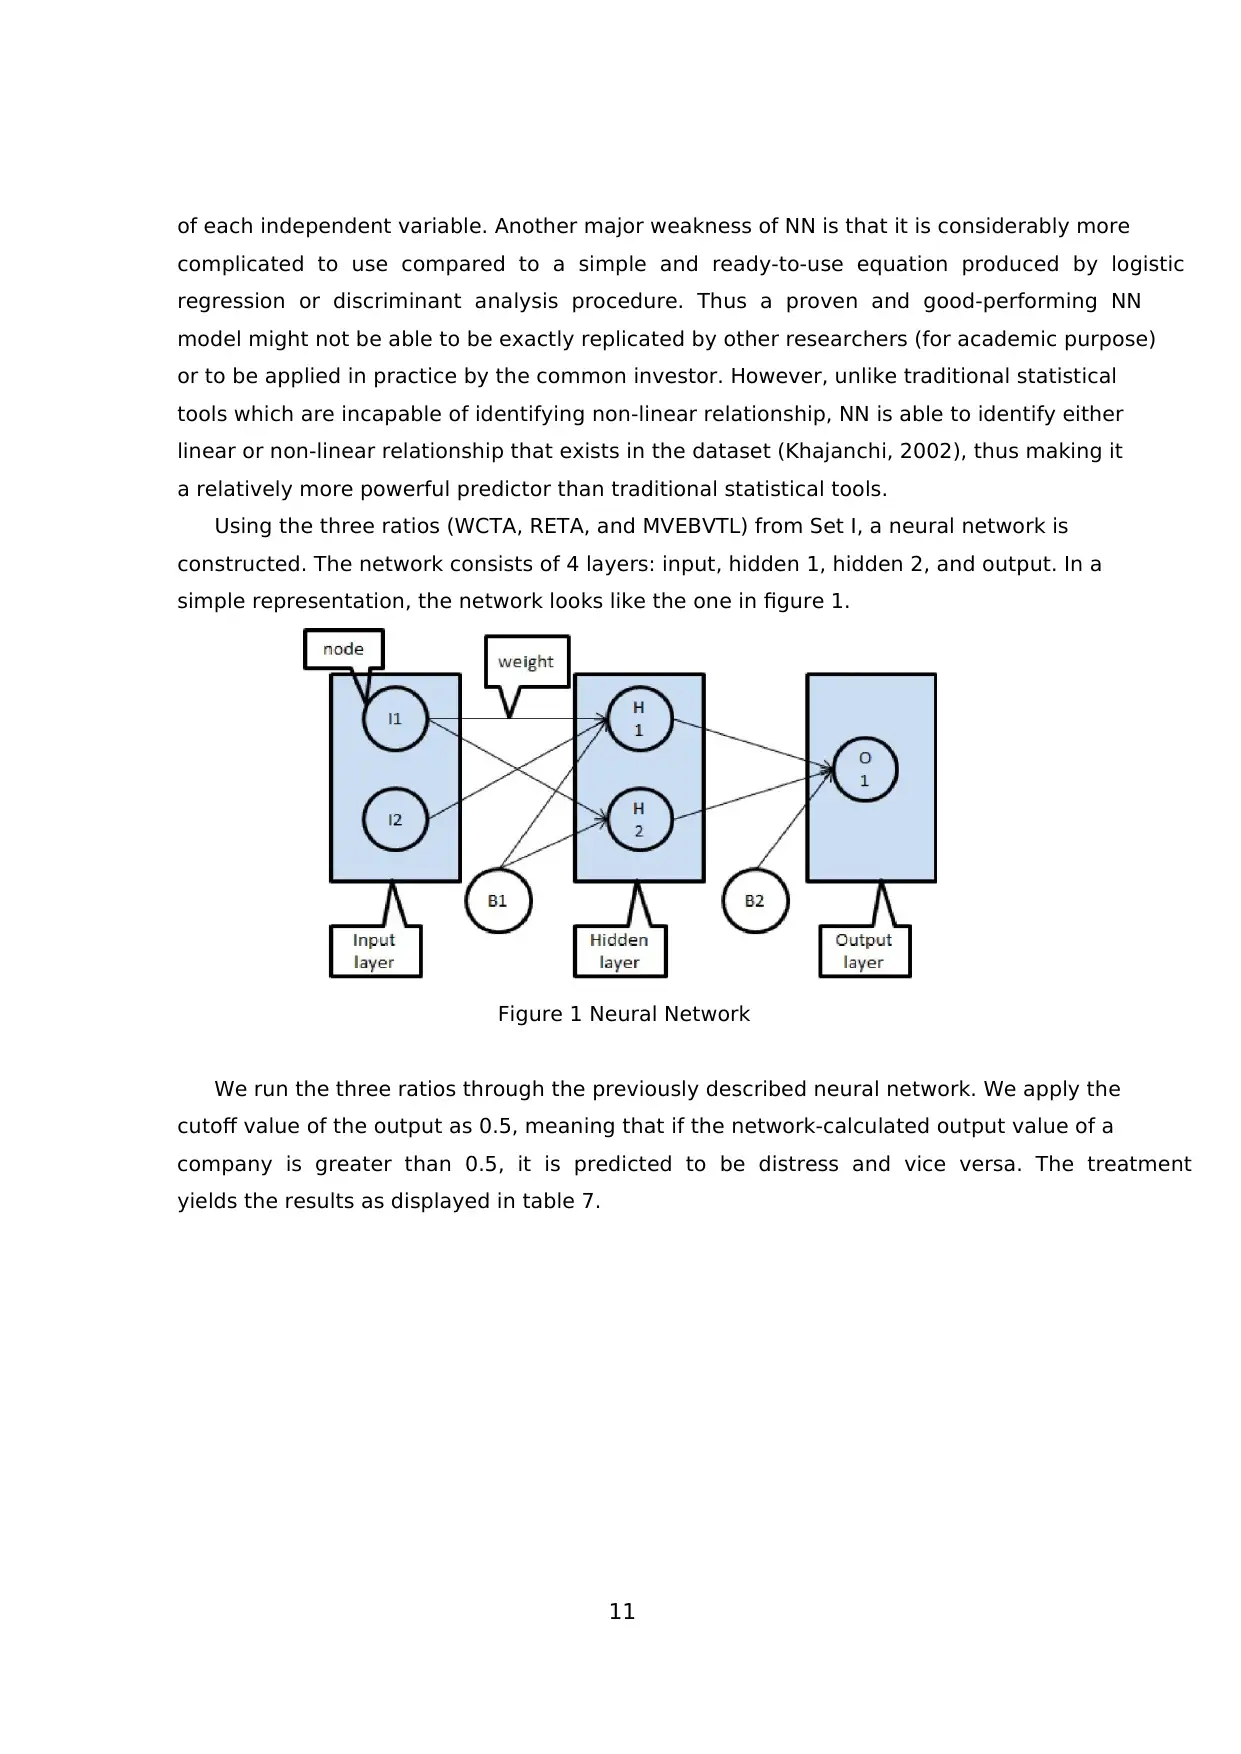
Using the three ratios (WCTA, RETA, and MVEBVTL) from Set I, a neural network is
constructed. The network consists of 4 layers: input, hidden 1, hidden 2, and output. In a
simple representation, the network looks like the one in figure 1.
Figure 1 Neural Network
We run the three ratios through the previously described neural network. We apply the
cutoff value of the output as 0.5, meaning that if the network-calculated output value of a
company is greater than 0.5, it is predicted to be distress and vice versa. The treatment
yields the results as displayed in table 7.
of each independent variable. Another major weakness of NN is that it is considerably more
complicated to use compared to a simple and ready-to-use equation produced by logistic
regression or discriminant analysis procedure. Thus a proven and good-performing NN
model might not be able to be exactly replicated by other researchers (for academic purpose)
or to be applied in practice by the common investor. However, unlike traditional statistical
tools which are incapable of identifying non-linear relationship, NN is able to identify either
linear or non-linear relationship that exists in the dataset (Khajanchi, 2002), thus making it
a relatively more powerful predictor than traditional statistical tools.
Using the three ratios (WCTA, RETA, and MVEBVTL) from Set I, a neural network is
constructed. The network consists of 4 layers: input, hidden 1, hidden 2, and output. In a
simple representation, the network looks like the one in figure 1.
Figure 1 Neural Network
We run the three ratios through the previously described neural network. We apply the
cutoff value of the output as 0.5, meaning that if the network-calculated output value of a
company is greater than 0.5, it is predicted to be distress and vice versa. The treatment
yields the results as displayed in table 7.
12
Sample Actual
Predicted
Non-distress Distress Overall % Correct
Training Non-distress 99.15% 0.85%
Distress 5.56% 94.44%
Overall % Correct 98.50%
Validation
1
Non-distress 95.24% 4.76%
Distress 33.33% 66.67%
Overall % Correct 94.44%
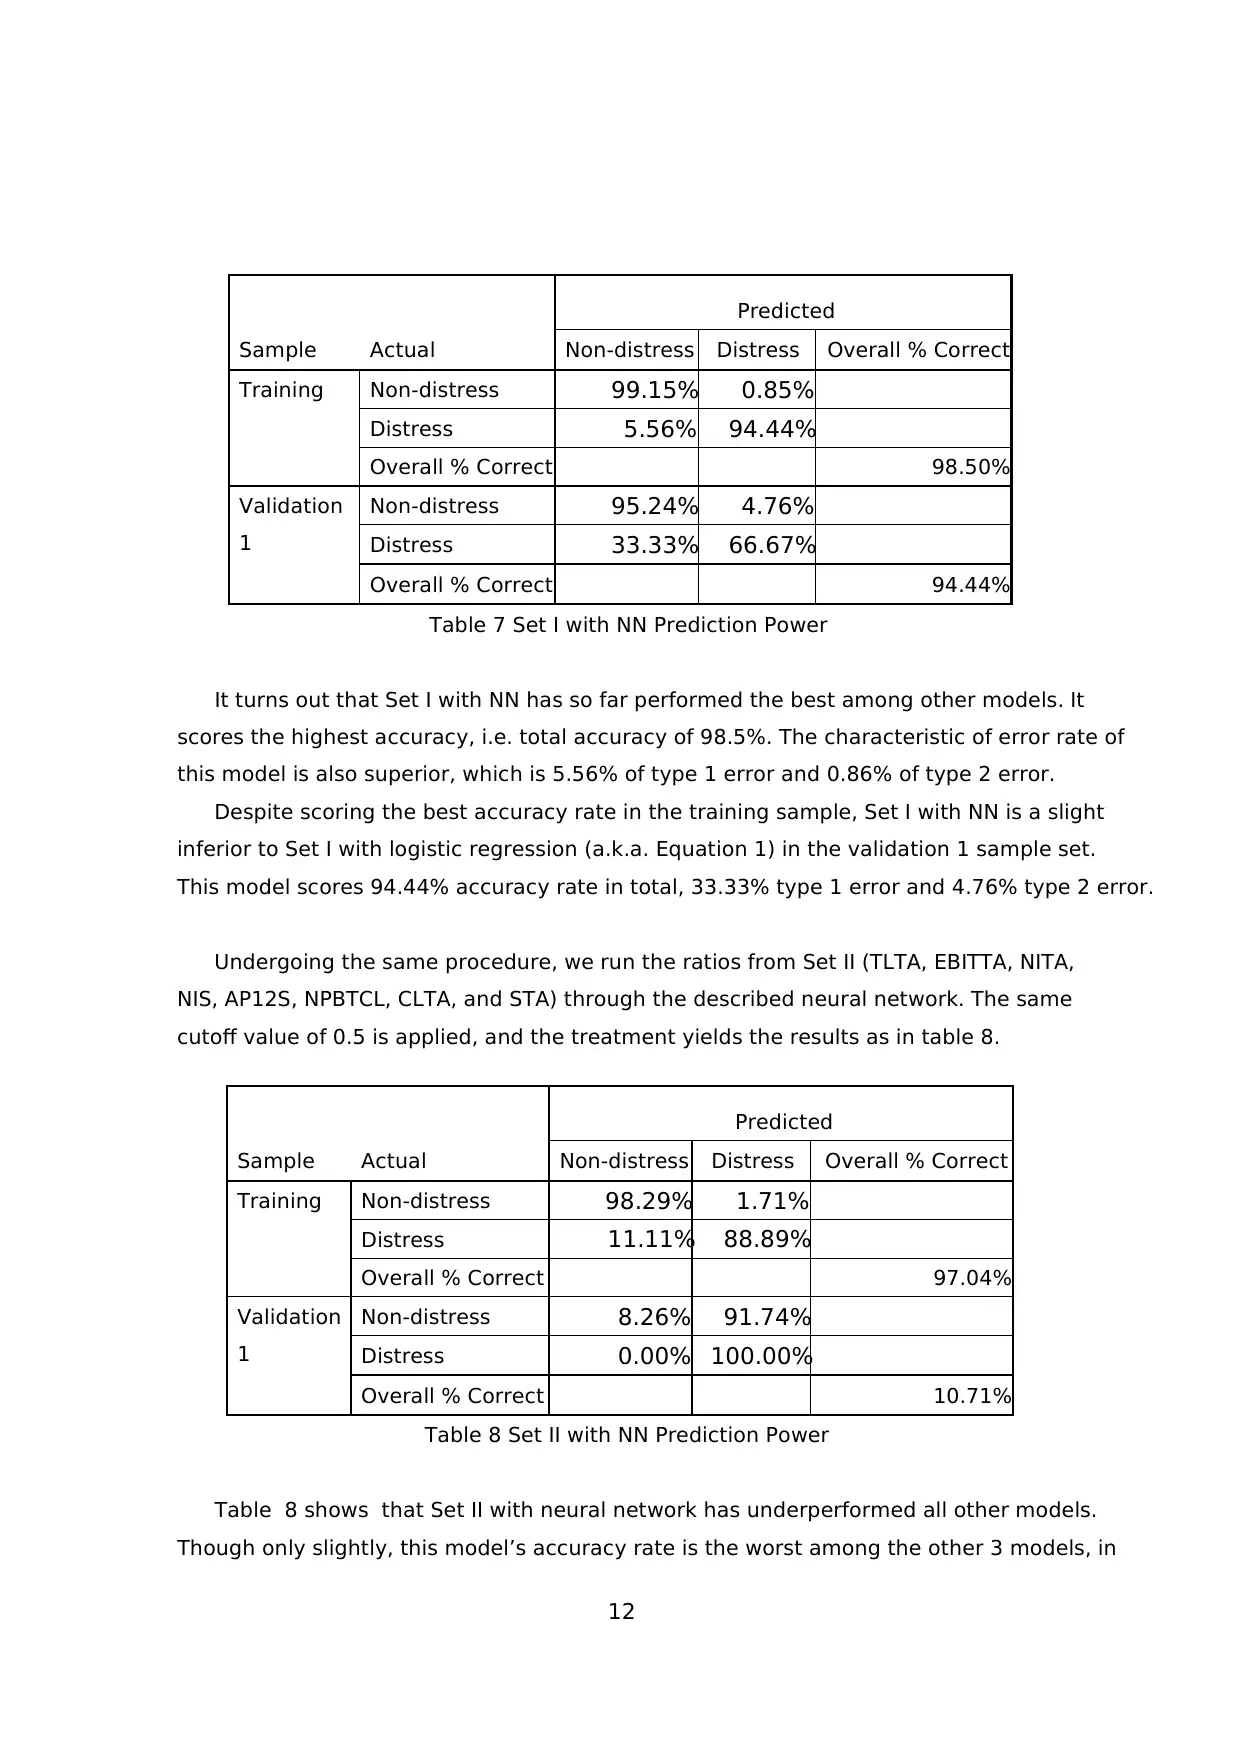
Table 7 Set I with NN Prediction Power
It turns out that Set I with NN has so far performed the best among other models. It
scores the highest accuracy, i.e. total accuracy of 98.5%. The characteristic of error rate of
this model is also superior, which is 5.56% of type 1 error and 0.86% of type 2 error.
Despite scoring the best accuracy rate in the training sample, Set I with NN is a slight
inferior to Set I with logistic regression (a.k.a. Equation 1) in the validation 1 sample set.
This model scores 94.44% accuracy rate in total, 33.33% type 1 error and 4.76% type 2 error.
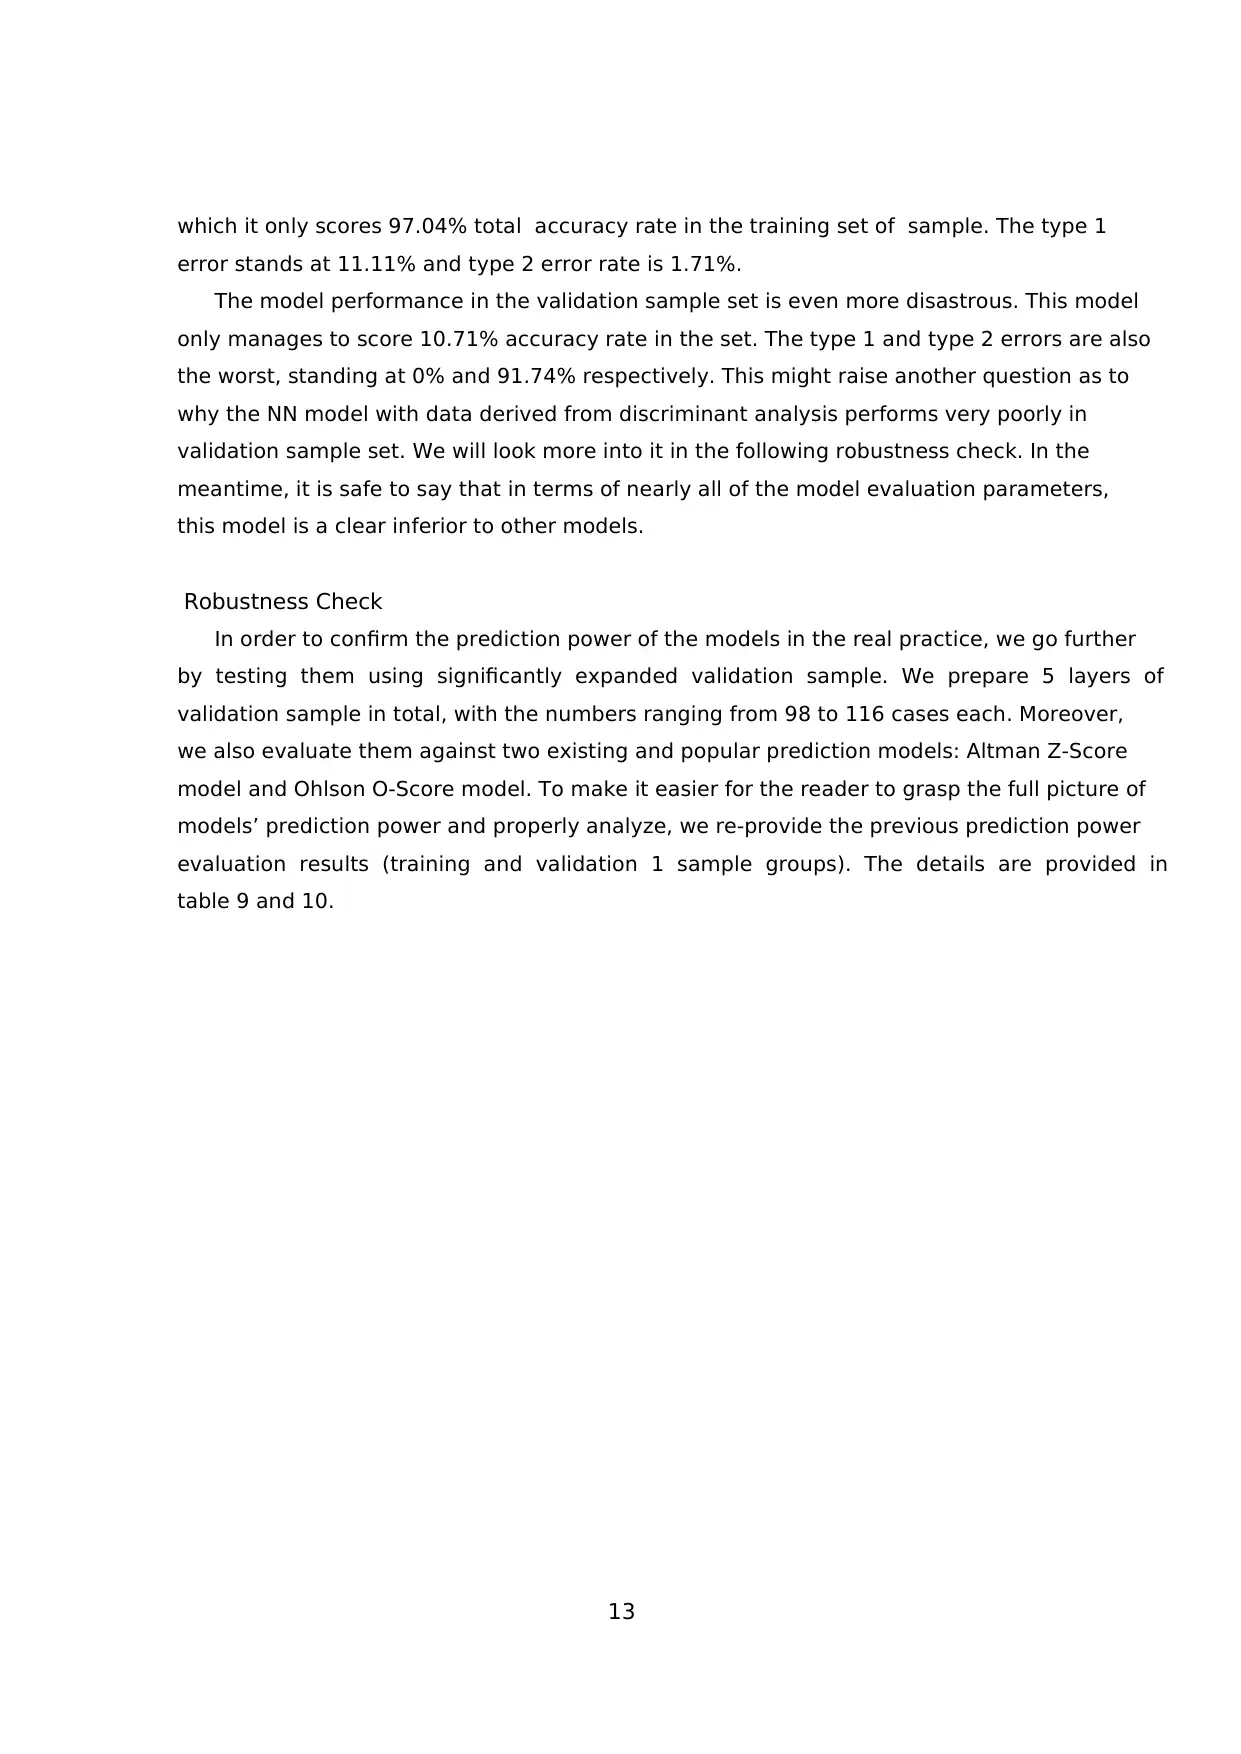
Undergoing the same procedure, we run the ratios from Set II (TLTA, EBITTA, NITA,
NIS, AP12S, NPBTCL, CLTA, and STA) through the described neural network. The same
cutoff value of 0.5 is applied, and the treatment yields the results as in table 8.
Sample Actual
Predicted
Non-distress Distress Overall % Correct
Training Non-distress 98.29% 1.71%
Distress 11.11% 88.89%
Overall % Correct 97.04%
Validation
1
Non-distress 8.26% 91.74%
Distress 0.00% 100.00%
Overall % Correct 10.71%
Table 8 Set II with NN Prediction Power
Table 8 shows that Set II with neural network has underperformed all other models.
Though only slightly, this model’s accuracy rate is the worst among the other 3 models, in
Sample Actual
Predicted
Non-distress Distress Overall % Correct
Training Non-distress 99.15% 0.85%
Distress 5.56% 94.44%
Overall % Correct 98.50%
Validation
1
Non-distress 95.24% 4.76%
Distress 33.33% 66.67%
Overall % Correct 94.44%
Table 7 Set I with NN Prediction Power
It turns out that Set I with NN has so far performed the best among other models. It
scores the highest accuracy, i.e. total accuracy of 98.5%. The characteristic of error rate of
this model is also superior, which is 5.56% of type 1 error and 0.86% of type 2 error.
Despite scoring the best accuracy rate in the training sample, Set I with NN is a slight
inferior to Set I with logistic regression (a.k.a. Equation 1) in the validation 1 sample set.
This model scores 94.44% accuracy rate in total, 33.33% type 1 error and 4.76% type 2 error.
Undergoing the same procedure, we run the ratios from Set II (TLTA, EBITTA, NITA,
NIS, AP12S, NPBTCL, CLTA, and STA) through the described neural network. The same
cutoff value of 0.5 is applied, and the treatment yields the results as in table 8.
Sample Actual
Predicted
Non-distress Distress Overall % Correct
Training Non-distress 98.29% 1.71%
Distress 11.11% 88.89%
Overall % Correct 97.04%
Validation
1
Non-distress 8.26% 91.74%
Distress 0.00% 100.00%
Overall % Correct 10.71%
Table 8 Set II with NN Prediction Power
Table 8 shows that Set II with neural network has underperformed all other models.
Though only slightly, this model’s accuracy rate is the worst among the other 3 models, in
Paraphrase This Document
Need a fresh take? Get an instant paraphrase of this document with our AI Paraphraser
13
which it only scores 97.04% total accuracy rate in the training set of sample. The type 1
error stands at 11.11% and type 2 error rate is 1.71%.
The model performance in the validation sample set is even more disastrous. This model
only manages to score 10.71% accuracy rate in the set. The type 1 and type 2 errors are also
the worst, standing at 0% and 91.74% respectively. This might raise another question as to
why the NN model with data derived from discriminant analysis performs very poorly in
validation sample set. We will look more into it in the following robustness check. In the
meantime, it is safe to say that in terms of nearly all of the model evaluation parameters,
this model is a clear inferior to other models.
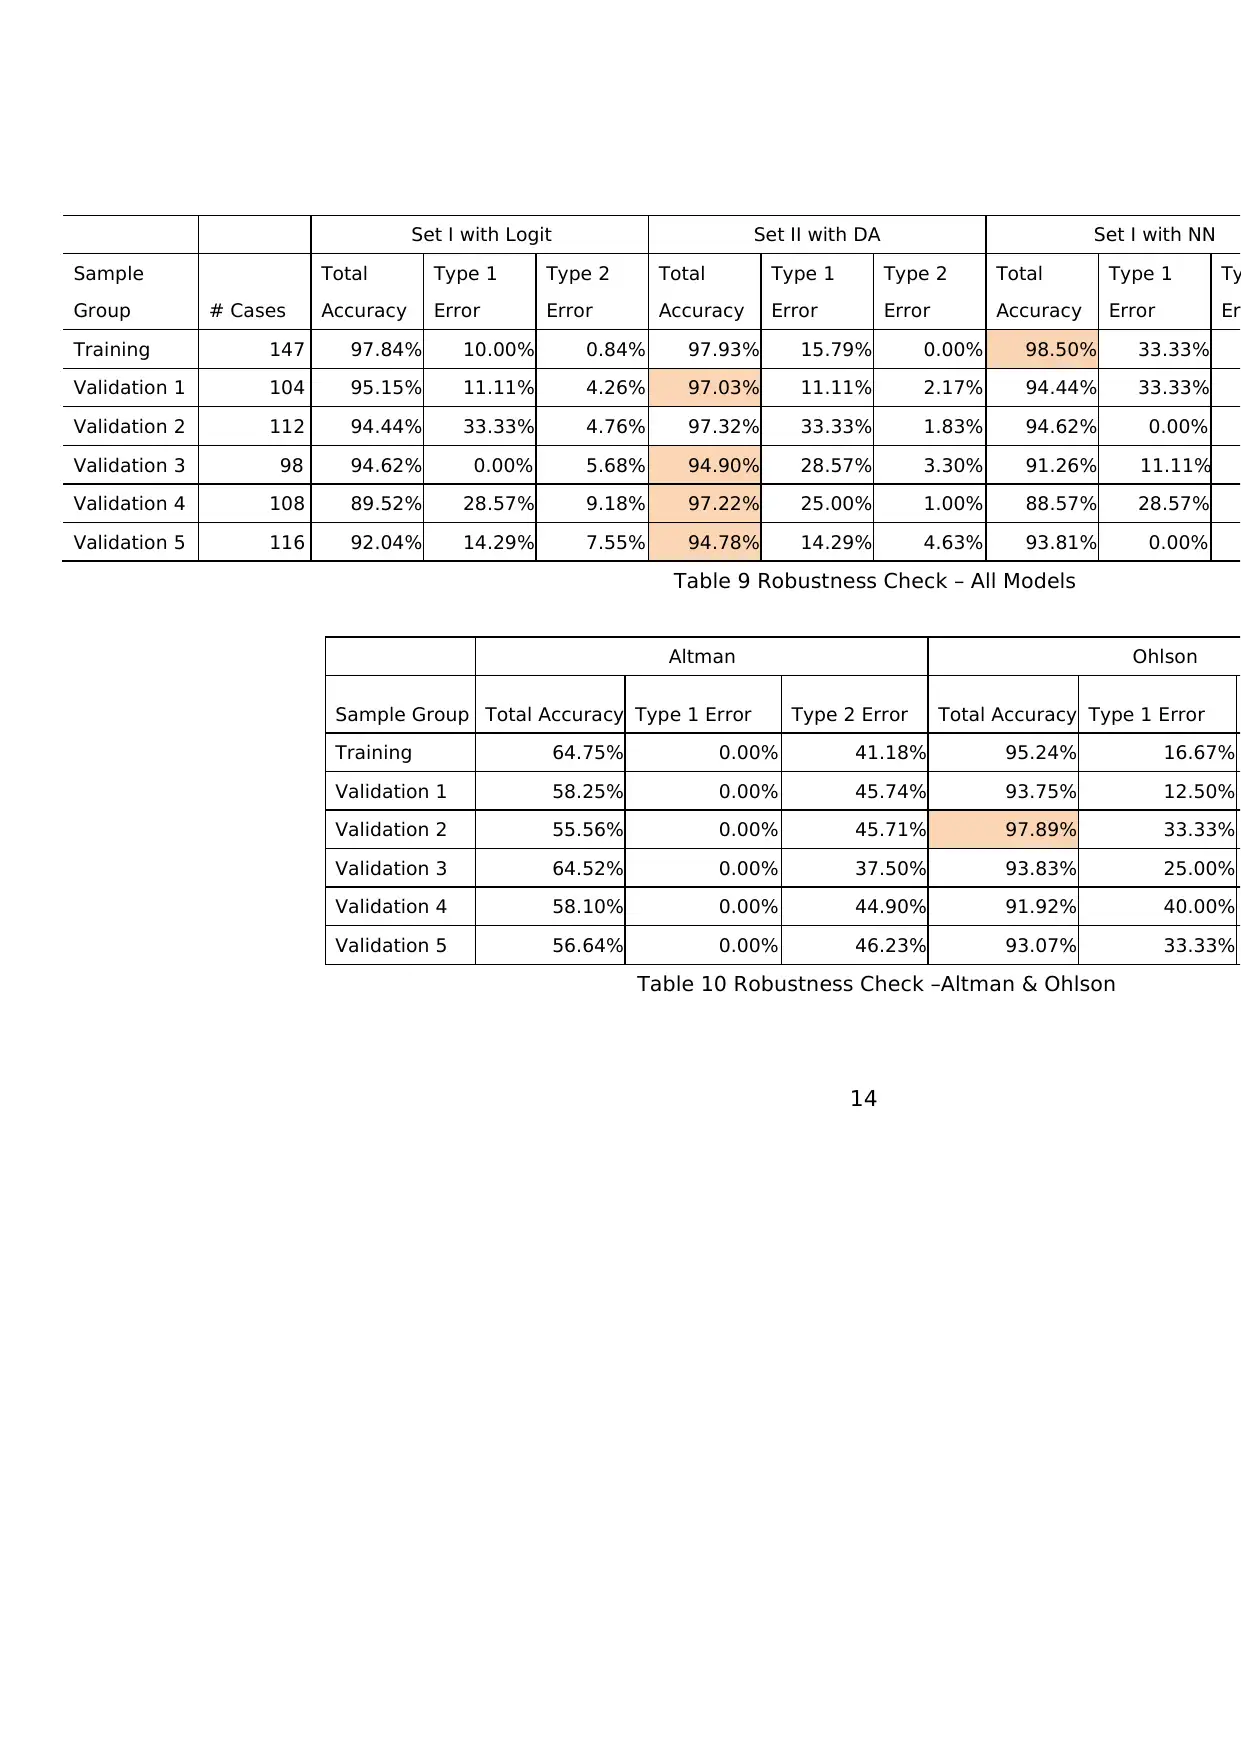
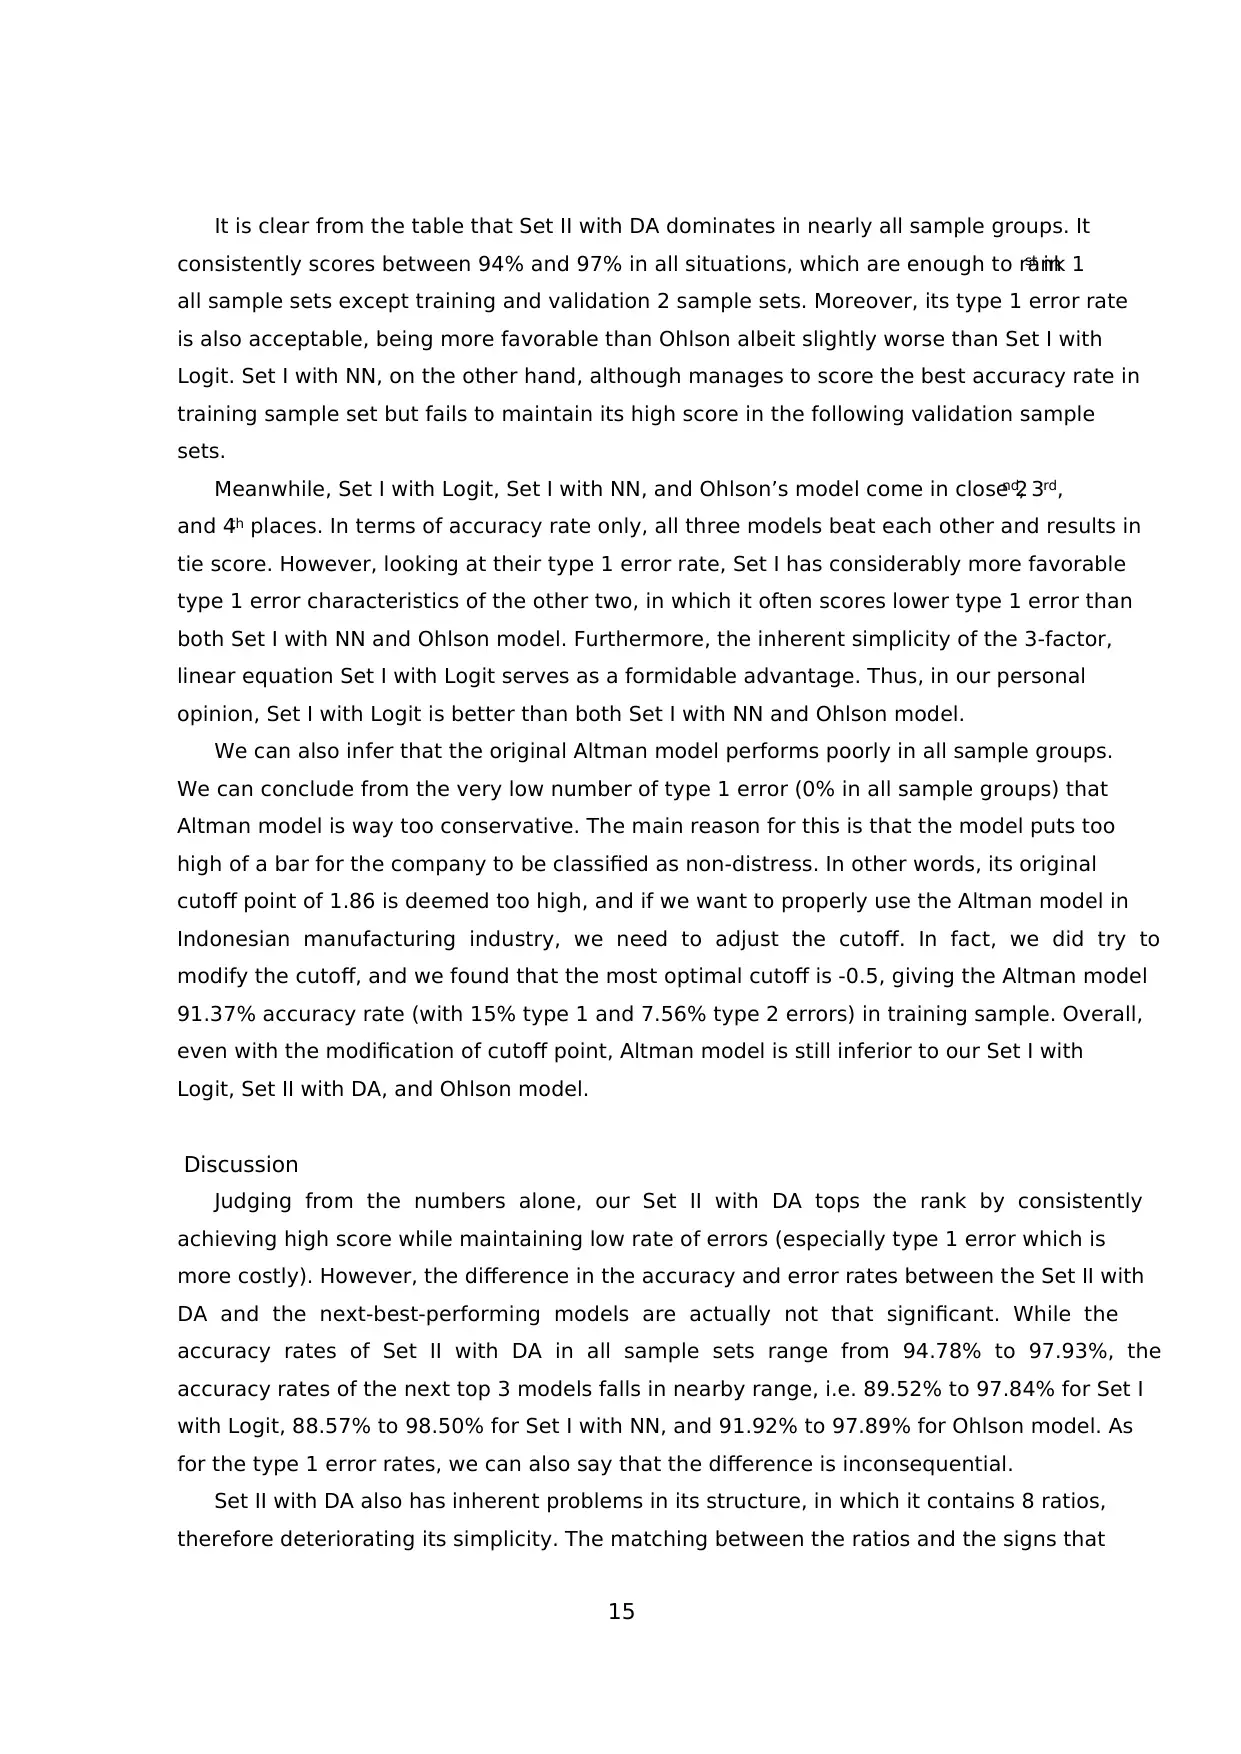
Robustness Check
In order to confirm the prediction power of the models in the real practice, we go further
by testing them using significantly expanded validation sample. We prepare 5 layers of
validation sample in total, with the numbers ranging from 98 to 116 cases each. Moreover,
we also evaluate them against two existing and popular prediction models: Altman Z-Score
model and Ohlson O-Score model. To make it easier for the reader to grasp the full picture of
models’ prediction power and properly analyze, we re-provide the previous prediction power
evaluation results (training and validation 1 sample groups). The details are provided in
table 9 and 10.
which it only scores 97.04% total accuracy rate in the training set of sample. The type 1
error stands at 11.11% and type 2 error rate is 1.71%.
The model performance in the validation sample set is even more disastrous. This model
only manages to score 10.71% accuracy rate in the set. The type 1 and type 2 errors are also
the worst, standing at 0% and 91.74% respectively. This might raise another question as to
why the NN model with data derived from discriminant analysis performs very poorly in
validation sample set. We will look more into it in the following robustness check. In the
meantime, it is safe to say that in terms of nearly all of the model evaluation parameters,
this model is a clear inferior to other models.
Robustness Check
In order to confirm the prediction power of the models in the real practice, we go further
by testing them using significantly expanded validation sample. We prepare 5 layers of
validation sample in total, with the numbers ranging from 98 to 116 cases each. Moreover,
we also evaluate them against two existing and popular prediction models: Altman Z-Score
model and Ohlson O-Score model. To make it easier for the reader to grasp the full picture of
models’ prediction power and properly analyze, we re-provide the previous prediction power
evaluation results (training and validation 1 sample groups). The details are provided in
table 9 and 10.
14
Set I with Logit Set II with DA Set I with NN
Sample
Group # Cases
Total
Accuracy
Type 1
Error
Type 2
Error
Total
Accuracy
Type 1
Error
Type 2
Error
Total
Accuracy
Type 1
Error
Ty
Er
Training 147 97.84% 10.00% 0.84% 97.93% 15.79% 0.00% 98.50% 33.33%
Validation 1 104 95.15% 11.11% 4.26% 97.03% 11.11% 2.17% 94.44% 33.33%
Validation 2 112 94.44% 33.33% 4.76% 97.32% 33.33% 1.83% 94.62% 0.00%
Validation 3 98 94.62% 0.00% 5.68% 94.90% 28.57% 3.30% 91.26% 11.11%
Validation 4 108 89.52% 28.57% 9.18% 97.22% 25.00% 1.00% 88.57% 28.57%
Validation 5 116 92.04% 14.29% 7.55% 94.78% 14.29% 4.63% 93.81% 0.00%
Table 9 Robustness Check – All Models
Altman Ohlson
Sample Group Total Accuracy Type 1 Error Type 2 Error Total Accuracy Type 1 Error
Training 64.75% 0.00% 41.18% 95.24% 16.67%
Validation 1 58.25% 0.00% 45.74% 93.75% 12.50%
Validation 2 55.56% 0.00% 45.71% 97.89% 33.33%
Validation 3 64.52% 0.00% 37.50% 93.83% 25.00%
Validation 4 58.10% 0.00% 44.90% 91.92% 40.00%
Validation 5 56.64% 0.00% 46.23% 93.07% 33.33%
Table 10 Robustness Check –Altman & Ohlson
15
It is clear from the table that Set II with DA dominates in nearly all sample groups. It
consistently scores between 94% and 97% in all situations, which are enough to rank 1st in
all sample sets except training and validation 2 sample sets. Moreover, its type 1 error rate
is also acceptable, being more favorable than Ohlson albeit slightly worse than Set I with
Logit. Set I with NN, on the other hand, although manages to score the best accuracy rate in
training sample set but fails to maintain its high score in the following validation sample
sets.
Meanwhile, Set I with Logit, Set I with NN, and Ohlson’s model come in close 2nd, 3rd,
and 4th places. In terms of accuracy rate only, all three models beat each other and results in
tie score. However, looking at their type 1 error rate, Set I has considerably more favorable
type 1 error characteristics of the other two, in which it often scores lower type 1 error than
both Set I with NN and Ohlson model. Furthermore, the inherent simplicity of the 3-factor,
linear equation Set I with Logit serves as a formidable advantage. Thus, in our personal
opinion, Set I with Logit is better than both Set I with NN and Ohlson model.
We can also infer that the original Altman model performs poorly in all sample groups.
We can conclude from the very low number of type 1 error (0% in all sample groups) that
Altman model is way too conservative. The main reason for this is that the model puts too
high of a bar for the company to be classified as non-distress. In other words, its original
cutoff point of 1.86 is deemed too high, and if we want to properly use the Altman model in
Indonesian manufacturing industry, we need to adjust the cutoff. In fact, we did try to
modify the cutoff, and we found that the most optimal cutoff is -0.5, giving the Altman model
91.37% accuracy rate (with 15% type 1 and 7.56% type 2 errors) in training sample. Overall,
even with the modification of cutoff point, Altman model is still inferior to our Set I with
Logit, Set II with DA, and Ohlson model.
Discussion
Judging from the numbers alone, our Set II with DA tops the rank by consistently
achieving high score while maintaining low rate of errors (especially type 1 error which is
more costly). However, the difference in the accuracy and error rates between the Set II with
DA and the next-best-performing models are actually not that significant. While the
accuracy rates of Set II with DA in all sample sets range from 94.78% to 97.93%, the
accuracy rates of the next top 3 models falls in nearby range, i.e. 89.52% to 97.84% for Set I
with Logit, 88.57% to 98.50% for Set I with NN, and 91.92% to 97.89% for Ohlson model. As
for the type 1 error rates, we can also say that the difference is inconsequential.
Set II with DA also has inherent problems in its structure, in which it contains 8 ratios,
therefore deteriorating its simplicity. The matching between the ratios and the signs that
Secure Best Marks with AI Grader
Need help grading? Try our AI Grader for instant feedback on your assignments.
16
are assigned to them also pose a question, in which we consider the signs are somewhat
lacking the logic. The Set II with DA will classify a company with greater score than 1.742 as
distress, meaning that the higher the score, the more likely the company to be distressed.
Logically speaking, ratios that contain “positive values” such as NITA and RETA should be
given negative signs (so that the bigger NITA is, the less likely the company to be distress);
and vice versa. However, we see in the model that NPBTCL and NITA which have “positive
values” for the company are assigned positive signs, and AP12S which contains “negative
values” is assigned negative sign. This anomaly in the assignment of signs is in line with
what we infer from the descriptive statistics table, in which we argue that this phenomenon
could result from the substandard “betting” habit of some companies which increase their
financial and operating leverage by loading up high level of debts to achieve higher earnings.
This behavior substantially increases the risk in their balance sheet. One example of this is
the huge net income enjoyed by the company Prasidha Aneka Siaga (PSDN) in 2003 while
maintaining 150% level of liabilities to its asset.
Meanwhile, the Set I with Logit has an appropriate structure, with logically agreeable
signs assigned to the ratios. Set I with Logit classifies a company with greater probability
than 0.14 to be distress, thus the higher the probability is, the more likely the company to be
distress. This leads to the rationale that the ratios having “positive value” be assigned
negative signs, and the ratios having “negative values” be assigned positive signs. It turns
out that all the variables in Set I with Logit are “positive value” ratios, and they are properly
assigned with negative signs, thus poses no question to the model structure.
It is also interesting to note the incompatibility between the variables derived from
discriminant analysis procedure with the neural network modeling method. We focus our
attention to the Set II with NN, in which the model scores considerably well with 97.04%
accuracy rate, but then fall from grace by scoring a disastrous series of accuracy rate
between 10.71% to 27.74% afterwards. This leads us to the fact that despite having similar
purpose, the nature of discriminant analysis and logit regression is completely different. As
its name implies, the discriminant analysis aims to “discriminate” a set of data to a couple of
categorical groups, by looking at their characteristics (i.e. the variables). This analysis
attempts to separate the data points using a separation line, rather than to converge them
into a line, such is done by OLS procedure. On the other hand, logit regression is similar to
OLS, in which it tries to converge the data points into a line (rather than separating it)
using characteristics in the independent variables. Unlike OLS, however, logit regression
produce a probability of the data points being into either 1 or 0 lines, not outright numbers
like OLS do. Meanwhile, one of the features of neural network model is that it impounds a
set of probability-finding calculations in its process. That is why it works well with the
17
variables derived from logit regression which was selected by aiming for reaching the best
probability of fitting it into a line.
Thus, by comparing the obvious top 4 models (Set II with DA, Set I with Logit, Set I with
NN, and Ohlson model), we would base our personal preference to Set I with Logit for its
simplicity, valid logic, considerably high accuracy rate, and acceptable error rates.
The superiority of modern-based methods such as neural network that were proven in
previous researches (Tam and Kiang, 1992; Zhang, et. al, 1999; Atiya, 2001; Virag and
Kristof, 2001; Rafiei, et. al, 2011) cannot be reasonably concluded from our result. Despite
the fact that Set I with NN is chosen as the best-performing model in this study, but the
other model of neural network (Set II with NN) unfortunately performs much worse than
the traditional-based models. The reason behind this result may due to the fact that the
neural network used in this research is a very simple version of neural network, without
applying any complicated algorithm to enhance the network performance. It also came into
our mind that our network is clearly outperformed by networks designed and constructed by
commercial ventures such as SPSS. However, due to its simplicity, we have a good faith that
this network (hence the research) can be reproduced relatively easily by future researchers.
5. CONCLUSION
We examine financial ratios of listed manufacturing firms in Indonesian stock exchange
to determine the sets of the most appropriate ratios in order to construct a practical
financial distress prediction model. From the full set of 23 ratios measuring a company’s
liquidity, profitability, leverage, and cash position, we manage to filter out 3 ratios (Working
Capital to Total Assets, Retained Earnings to Total Asset, and Market Value of Equity to
Book Value of Total Liability) from stepwise logit procedure, which we define as Set I and 8
ratios (EBIT to Total Assets, Sales to Total Asset, Net Profit Before Tax to Current Liability,
Total Liabilities to Total Assets, Net Income to Total Assets, Current Liabilities to Total
Assets, Annualized Notes and Accounts Payable divided by Sales, and Net Income to Sales)
from stepwise discriminant analysis which we define as Set II. Based on the analysis on
prediction results, it seems that Set II with Discriminant Analysis possess the highest
prediction power among the other models. However, the difference in prediction power is
only slightly better than Set I with Logit, but with considerably more ratios to make up the
model, hence impairing its practicality. Thus, on the basis of simplicity and logic, we propose
Set I with Logit as the best model to predict financial distress of companies in Indonesian
manufacturing industry. Meanwhile, this study fails to provide any distinctive evidence to
support the argument reached by a number of previous studies that neural network method
outperforms traditional statistical tools in terms of creating prediction models.
18
REFERENCES
Altman, Edward L., Financial Ratios, Discriminant Analysis and the Prediction of Corporate
Bankruptcy. Journal of Finance, pp. 589-609. September 1968.
Asquith, P. R. Gertner, and D. Scharfstein.Anatomy of Financial Distress: An Examination of
Junk-Bond Issuers. The Quarterly Journal of Economics, Vol. 109, No. 3, pp. 625-658. Agustus
1994
Atiya, Amir F. Bankruptcy Prediction for Credit Risk Using Neural Networks: A Survey and New
Results. IEEE Transactions on Neural Networks, Vol. 12, No. 4. July 2001.
Bae, Jae Kwon. Predicting Financial Distress of the South Korean Manufacturing Industries. Expert
Systems with Applications. Vol. 39, pp. 9159-9165. 2012.
Beaver , W. H.,Financial Ratios and Predictors of Failure. Empirical Research in Accounting: Selected
Studies, Supplement to Journal of Accounting Research, 4, pp. 71-111. 1966
Brahmana, Rayendra. Identifying Financial Distress Condition in Indonesia Manufacture Industry.
Birmingham Business School, Birmingham: 2005.
Draper, N. R., and Smith, Harry.Applied Regression Analysis second edition. John Wiley & Sons:
1981.
Fulmer, John G. Jr., Moon, James E., Gavin, Thomas A., Erwin, Michael J., A Bankruptcy
Classification Model For Small Firms. Journal of Commercial Bank Lending, pp. 25-37. July
1984.
Hofer, C. W., Turnaround Strategies. Journal of Business Strategy, 1, pp. 19-31. 1980
Huberty, C. J., Olejnik, Stephen. Applied MANOVA and Discriminant Analysis second edition. John
Wiley & Sons: 2006.
Keasey, Kevin, et. Al.The Costs of SME’s Financial Distress across Europe. Leeds University. 2009.
Khajanchi, Amit. Artificial Neural Network: The Next Intelligence. Technology Commercialization
Alliance, University of Southern California. 2002.
Lau, Amy Ling-Hing. A Five-State Financial Distress Prediction Model. Journal of Accounting
Research, Vol. 25, No. 1. 1987
Luciana. Analisis Rasio Keuangan untuk MemprediksiKondisi Financial Distress Perusahaan
Manufaktur yang Terdaftar di Bursa Efek Jakarta. Jurnal Akuntansi dan Auditing Indonesia,
Vol. 7, No. 2. 2003.
Luciana. Prediksi Kondisi Financial Distress Perusahaan Go Public Dengan Menggunakan Analisis
Multinomial Logit. Jurnal Ekonomi dan Bisnis, Vol. XII. 2006.
Odom, M. and Sharda, R.A Neural Network Model for Bankruptcy Prediction. Proceedings of the
International Joint Conference on Neural Networks, pp. II-163-II-168. June 1990.
Ohlson, J. Financial ratios and the probabilistic prediction of bankruptcy. Journal of Accounting
Research, Vol. 18, No. 1, pp. 109-131. 1980.
Paraphrase This Document
Need a fresh take? Get an instant paraphrase of this document with our AI Paraphraser
19
Rafiei, F. M., Manzari, S.M., Bostanian, S.Financial Health Prediction Models Using Artificial Neural
Networks, Genetic Algorithm and Multivariate Discriminant Analysis: Iranian Evidence.
Expert Systems with Applications, vol. 38, p.10210-10217. 2011.
Ross, Stephen, et al.Corporate Finance Fundamentals. New York: McGraw-Hill. 2008.
Shirata, C. Y. Financial Ratios as Predictors of Bankruptcy in Japan: An Empirical Research. Tsukuba
College of Technology. 1998
Shirata, C. Y. Predictors of Bankruptcy after Bubble Economy in Japan: What can You Learn from
Japan Case?The 15th Asia-Pacific Conference on International Accounting Issues. November
2003.
Shumway, Tyler. Forecasting Bankruptcy More Accurately: A Simple Hazard Model. The Journal of
Business, Vol. 74, No. 1. January 2001.
Springate, Gordon L.V.Predicting the Possibility of Failure in a Canadian Firm. M.B.A. Research
Project, Simon Fraser University, January 1978.
Sung, T. K., Chang, N., Lee, G.Dynamics of Modeling in Data Mining: Interpretive Approach to
Bankruptcy Prediction. Journal of Management Information Systems, Vol. 16 No. 1. Summer
1999.
Tam, K. Y., Kiang, M. Y.Managerial Applications of Neural Networks: The Case of Bank Failure
Predictions. Management Science, Vol. 38, No. 7, p. 926-947. July 1992.
Thevnin, Charles. A Comparative Examination of Bankruptcy Prediction: Altman MDA Study versus
Luther ANN study: A Test of Predictive Strength betweenThe Two Techniques. Nova
Southeastern University. 2003.
Virag, M. and Kristof, T. Neural Networks in Bankruptcy Prediction – A Comparative Study on the
Basis of the First Hungarian Bankruptcy Model. Acta Oeconomica, Vol. 55 (4) p. 403-425. 2005
Whitaker, Richard. The Early Stages of Financial Distress. Journal of Economics and Finance, Vol. 23,
p.123-133. Summer 1999.
Zhang, G., Hu, M. Y., Patuwo, B. E., Indro, D. I.Artificial Neural Networks in Bankruptcy Prediction:
General Framework and Cross-validation Analysis. European Journal of Operational Research,
vol. 116, p. 16-32. 1999.
Zmijewski, Mark. Predicting Corporate Bankruptcy: An Empirical Comparison of the Extant Financial
Distress Models. Working paper, SUNY at Buffalo: 1983.
Zu’amah, Surroh.Perbandingan Ketepatan Klasifikasi Model Prediksi Kepailitan Berbasis Akrual
dan Berbasis Aliran Kas. SNA VIII. 2005
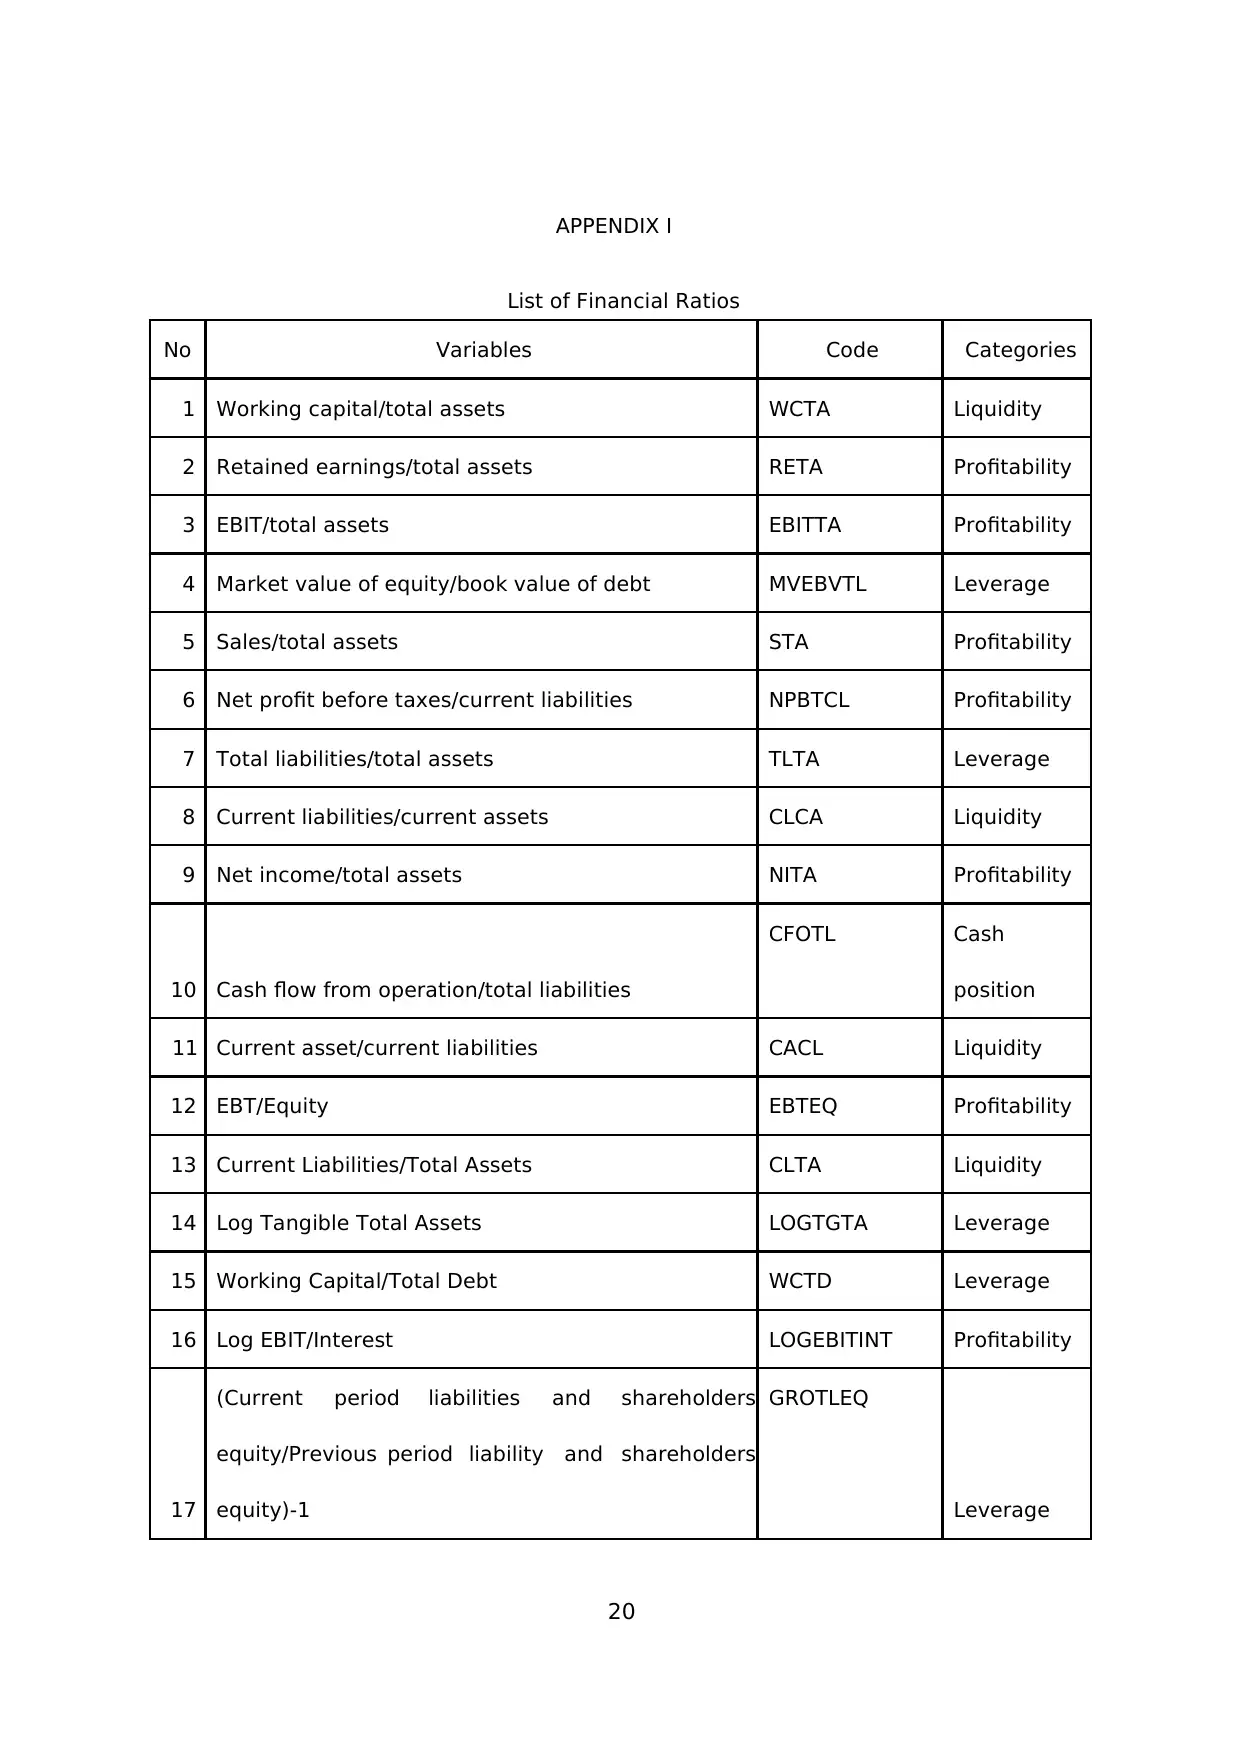
20
APPENDIX I
List of Financial Ratios
No Variables Code Categories
1 Working capital/total assets WCTA Liquidity
2 Retained earnings/total assets RETA Profitability
3 EBIT/total assets EBITTA Profitability
4 Market value of equity/book value of debt MVEBVTL Leverage
5 Sales/total assets STA Profitability
6 Net profit before taxes/current liabilities NPBTCL Profitability
7 Total liabilities/total assets TLTA Leverage
8 Current liabilities/current assets CLCA Liquidity
9 Net income/total assets NITA Profitability
10 Cash flow from operation/total liabilities
CFOTL Cash
position
11 Current asset/current liabilities CACL Liquidity
12 EBT/Equity EBTEQ Profitability
13 Current Liabilities/Total Assets CLTA Liquidity
14 Log Tangible Total Assets LOGTGTA Leverage
15 Working Capital/Total Debt WCTD Leverage
16 Log EBIT/Interest LOGEBITINT Profitability
17
(Current period liabilities and shareholders
equity/Previous period liability and shareholders
equity)-1
GROTLEQ
Leverage
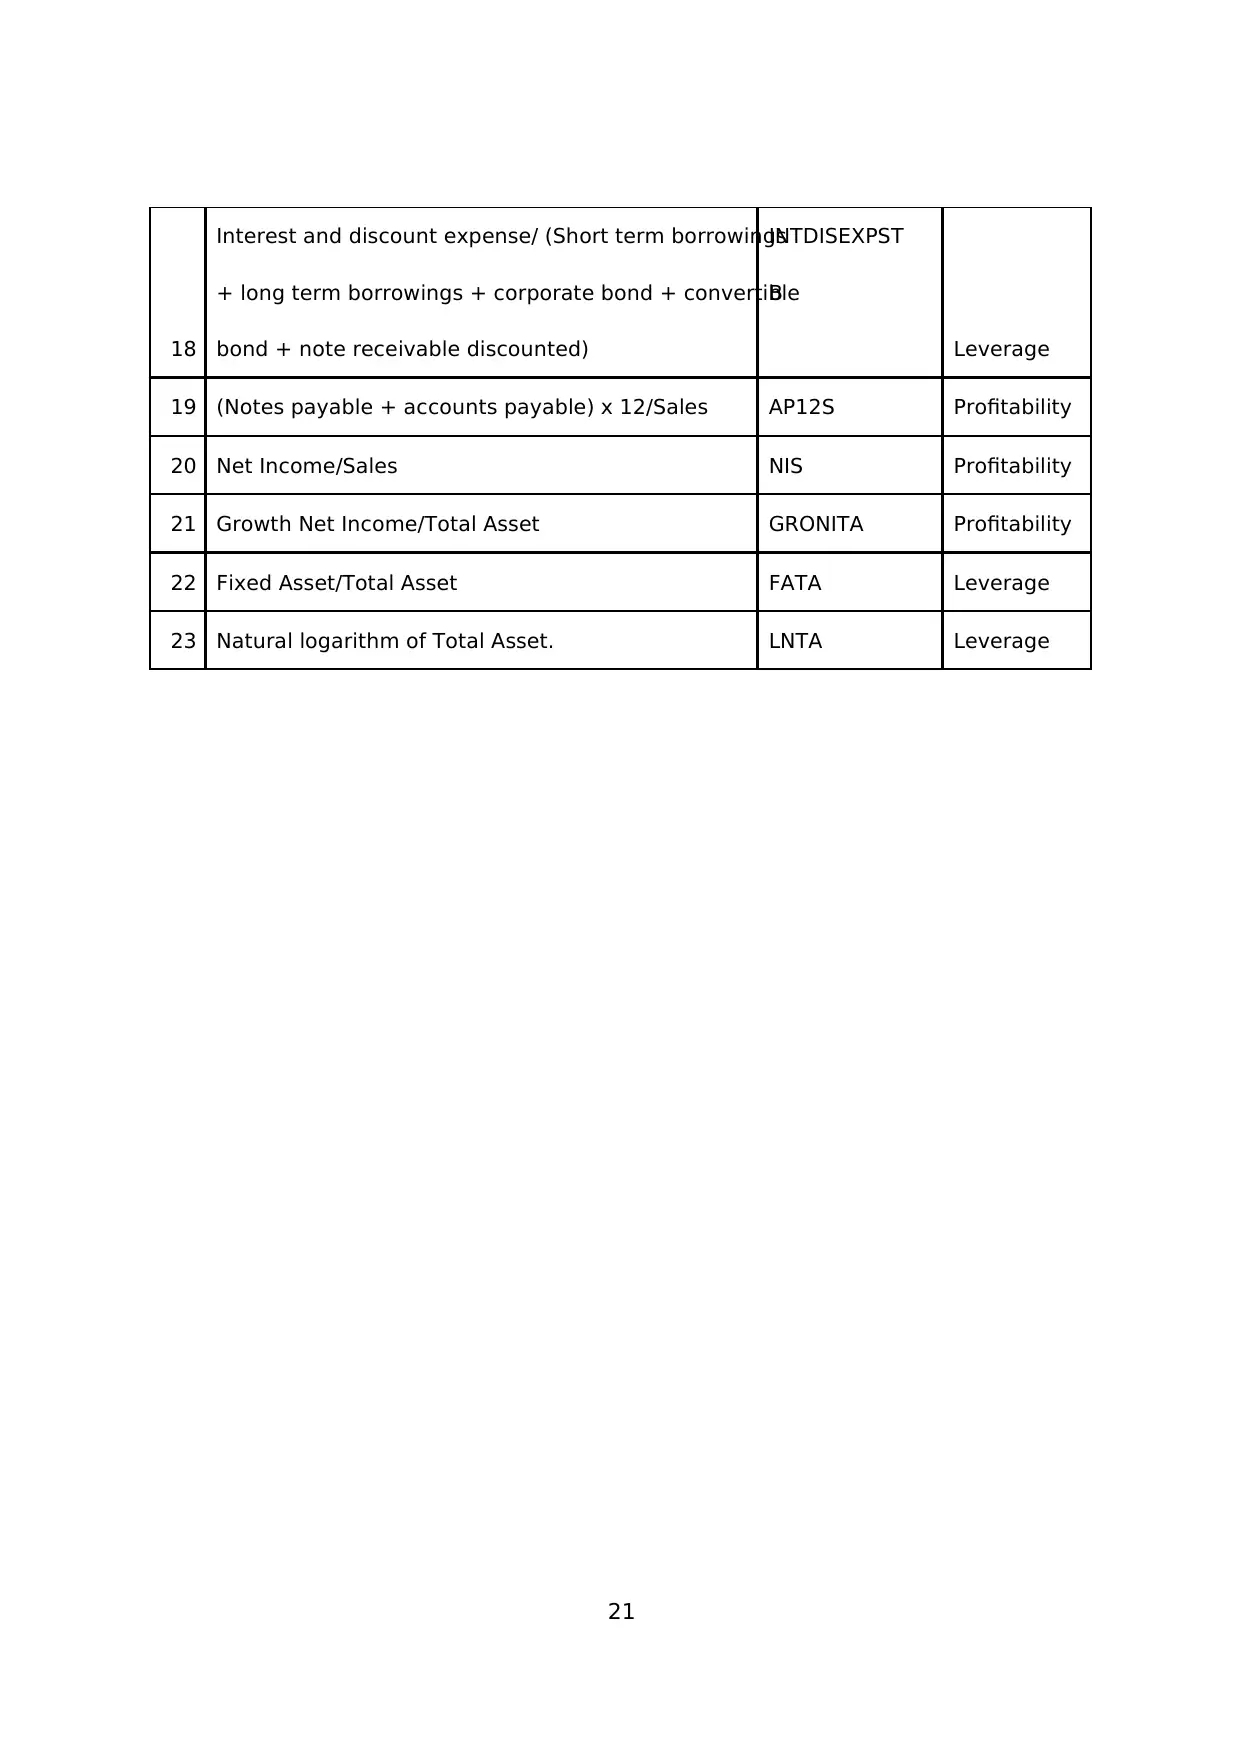
21
18
Interest and discount expense/ (Short term borrowings
+ long term borrowings + corporate bond + convertible
bond + note receivable discounted)
INTDISEXPST
B
Leverage
19 (Notes payable + accounts payable) x 12/Sales AP12S Profitability
20 Net Income/Sales NIS Profitability
21 Growth Net Income/Total Asset GRONITA Profitability
22 Fixed Asset/Total Asset FATA Leverage
23 Natural logarithm of Total Asset. LNTA Leverage
1 out of 22


Your All-in-One AI-Powered Toolkit for Academic Success.
+13062052269
info@desklib.com
Available 24*7 on WhatsApp / Email
![[object Object]](/_next/static/media/star-bottom.7253800d.svg)
Unlock your academic potential
© 2024 | Zucol Services PVT LTD | All rights reserved.