Data Analysis Report: Factors Affecting Mersey Cruise Sales Decline
VerifiedAdded on 2020/06/05
|12
|1447
|787
Report
AI Summary
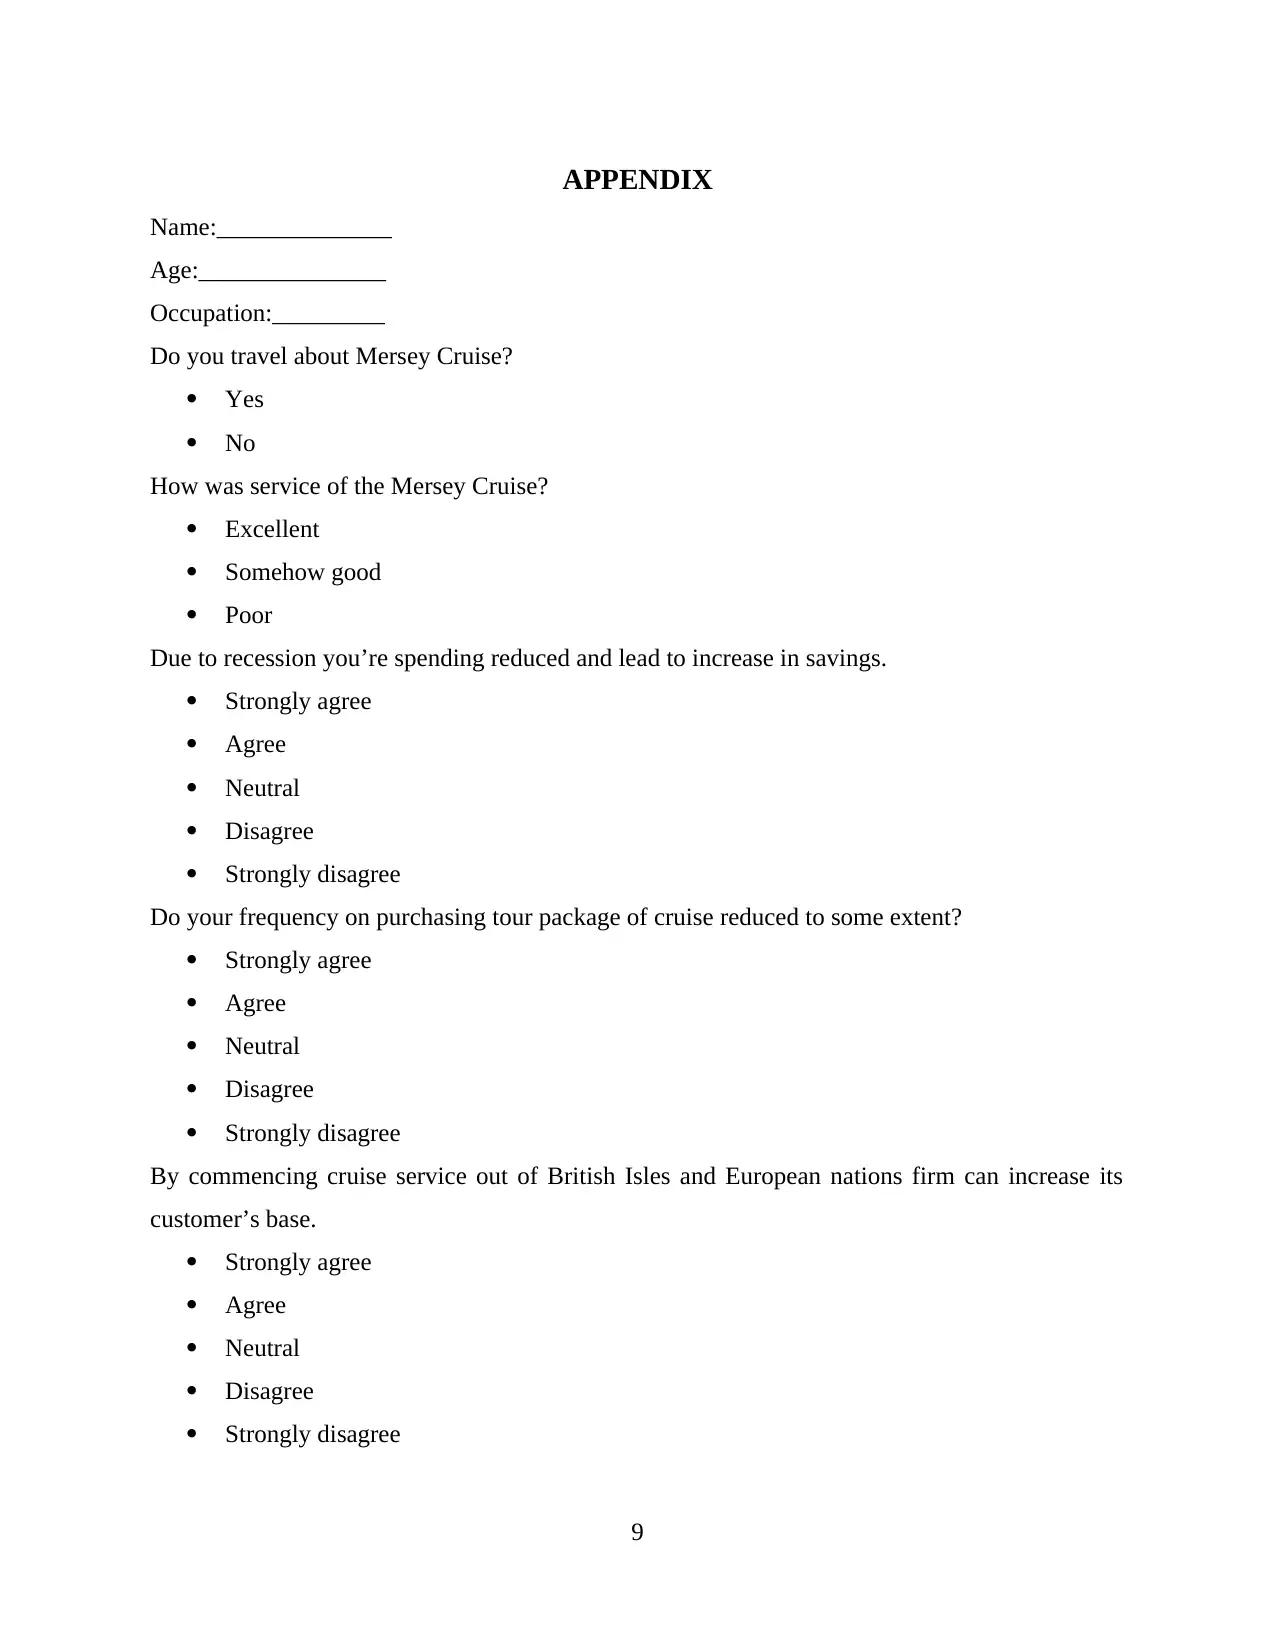
This report presents a comprehensive data analysis of the Mersey Cruise, focusing on factors contributing to sales decline. It begins with an introduction outlining the research process, including sample size determination and data analysis techniques. The report then differentiates between qualitative and quantitative research methods, highlighting their respective merits and demerits. The objective of the research is to identify reasons for the decline in Mersey Cruise sales, addressing specific research questions related to recession impacts and customer preferences. Qualitative data analysis is conducted through thematic analysis of survey responses, while quantitative analysis employs statistical tools like regression to assess relationships between variables. The results of both analyses are presented, followed by a discussion of the findings. The conclusion emphasizes the importance of systematic research methodologies and the use of both qualitative and quantitative methods for in-depth data analysis. The report includes references and an appendix with the survey questionnaire.

DATA ANALYSIS
Paraphrase This Document
Need a fresh take? Get an instant paraphrase of this document with our AI Paraphraser

TABLE OF CONTENTS
DATA ANALYSIS.........................................................................................................................1
INTRODUCTION...........................................................................................................................1
Analysis...........................................................................................................................................1
Difference between quantitative and qualitative research...........................................................1
Objective of research...................................................................................................................2
Research questions.......................................................................................................................2
Qualitative data analysis..............................................................................................................2
Discussion........................................................................................................................................6
Quantitative analysis....................................................................................................................6
Discussion on quantitative data analysis.....................................................................................7
CONCLUSION................................................................................................................................7
APPENDIX......................................................................................................................................8

INTRODUCTION
Carrying a research is a very tough task and in this regard some of steps must be
followed. Under this first of all appropriate sample size must be determine and then it must be
ensured that sample units have broad knowledge of research topic. Thereafter, thematic and
quantitative analysis of data must be done to arrive at specific conclusion. All these things are
done in the report that is given below.
Analysis
Difference between quantitative and qualitative research
There is a difference between qualitative and quantitative research. This is because in the
qualitative research thematic analysis is done. Under this data that is collected by distributing
questionnaire is analyzed by computing frequency of the various elements of the specific scale
that is related to the specific question (Creswell, 2013). Plotting of the summed values is done to
identify what sort of customers are agree or disagree with the specific fact. On other hand,
another approach of data analysis is use of tools like SPSS under which association between
multiple variables is identified on different fronts. Thus, it can be said that there is big difference
between qualitative and quantitative research. In qualitative research within variable analysis is
done but in quantitative approach between variables analysis is done (Polit and Beck, 2010). This
is the only difference between qualitative and quantitative research.
Qualitative data
Merits
Easy to do qualitative data analysis as anyone can do such kind of analysis because for
same technical knowledge is not required (Bernard, 2011).
Give overview of the perception that respondents have in respect to specific situation or
scenario.
Demerits
Major demerit of mentioned method of data analysis is that it does not reveal relationship
among variables. Hence, extensive research cannot be done by using relevant method.
Quantitative data
Merits
Relationship can be identified among variables in terms of cause and effect relationship.
1
⊘ This is a preview!⊘
Do you want full access?
Subscribe today to unlock all pages.

Trusted by 1+ million students worldwide

Demerits
Application of tasks is a technical work and everyone can not apply such method in
proper manner on data (Wyse, S,E, 2011).
Objective of research
To identify reasons due to which sales of the Mersey Cruise decline.
Research questions
Due to recession do people start saving more money?
Do in past time period people preference for Cruise vacation reduced?
Qualitative data analysis
Do you travel through Mersey Cruise?
Yes 20
No 10
Figure 1Respondents response on question “Their travel on Mersey Cruise”
How was service of the Mersey Cruise?
Excellent 5
Somehow
good 6
Poor 9
2
Paraphrase This Document
Need a fresh take? Get an instant paraphrase of this document with our AI Paraphraser

Figure 2Respondents response on question of service quality of the firm
Due to recession you’re spending reduced and lead to increase in savings.
Strongly agree 6
Agree 8
Somewhat agree 2
Disagree 2
Strongly disagree 2
Figure 3People response on question “Due to recession you’re spending reduced and lead to
increase in savings”
Do your frequency on purchasing tour package of cruise reduced to some extent?
Strongly agree 7
Agree 8
Somewhat agree 3
3

Disagree 1
Strongly disagree 1
Figure 4People response on question" Do your frequency on purchasing tour package of cruise
reduced to some extent”
By commencing cruise service out of British Isles and European nations firm can increase its
customer’s base.
Strongly agree 4
Agree 5
Somewhat agree 3
Disagree 3
Strongly disagree 5
4
⊘ This is a preview!⊘
Do you want full access?
Subscribe today to unlock all pages.

Trusted by 1+ million students worldwide

Figure 5People response on question" By commencing cruise service out of British Isles and
European nations firm can increase its customer’s base”
Quantitative analysis
H0: There is no significant difference between mean value of people increasing saving rate and
frequency of purchase of cruise package.
H1: There is significant difference between mean value of people increasing saving rate and
frequency of purchase of cruise package.
5
Paraphrase This Document
Need a fresh take? Get an instant paraphrase of this document with our AI Paraphraser

Figure 6Regression analysis
Interpretation
There are 4 respondents that are strongly agree, 5 are agree, 3 are somewhat agree
followed by 3 are disagree and 5 are strongly disagree from same statement. It can be said that
firm must expand its service to new areas.
Discussion
Quantitative analysis
Do you travel through Mersey Cruise?
Results are clearly indicating that 20 respondents know about Mersey Cruise and 10 does not
know. Thus, it can be said that brand is popular.
6

How was service of the Mersey Cruise?
5 respondent’s state excellent, 6 are somehow good and 9 state that firm service quality fall in
poor category. Mixed response is received from respondents.
Due to recession you’re spending reduced and lead to increase in savings.
Results are reflecting that there are 8 respondents that are agree and 6 are strongly agree
followed by 2 respondents are somewhat agree, disagree and strongly disagree on same
statement. Thus, it can be said that due to recession spending of people reduced.
Do your frequency on purchasing tour package of cruise reduced to some extent?
Results are indicating that there are 7 respondents that strongly agree, 8 are agree, 3 are
somewhat agree and 1 is disagree and strongly disagree on same statement. Hence, it can be said
that due to lack of savings people spend less on cruise packages.
By commencing cruise service out of British Isles and European nations firm can increase its
customer’s base.
There are 4 respondents that are strongly agree, 5 are agree, 3 are somewhat agree followed by 3
are disagree and 5 are strongly disagree from same statement. It can be said that firm must
expand its service to new areas.
Discussion on quantitative data analysis
Results are indicating that p value is 0.06>0.05, multiple R is 0.12 and R square is 0.014
which means that there is no significant difference between mean value of dependent and
independent variable and there is low correlation among them.
CONCLUSION
Survey should always be carried by taking appropriate sample of people that have strong
knowledge of relevant area. Questionnaire must be designed in systematic way and in this regard
first of all objectives must be frame and then on that basis questions must be formed. Same must
be analyzed to arrive at specific conclusion by using both qualitative and quantitative methods.
By using both in-depth data can be analyzed.
7
⊘ This is a preview!⊘
Do you want full access?
Subscribe today to unlock all pages.

Trusted by 1+ million students worldwide

REFERENCES
Books and journals
Creswell, J.W., 2013. Research design: Qualitative, quantitative, and mixed methods
approaches. Sage publications.
Bernard, H.R., 2011. Research methods in anthropology: Qualitative and quantitative
approaches. Rowman Altamira.
Polit, D.F. and Beck, C.T., 2010. Generalization in quantitative and qualitative research: Myths
and strategies. International journal of nursing studies. 47(11). pp.1451-1458.
Online
Wyse, S,E, 2011. [Online].What is the Difference between Qualitative Research and
Quantitative Research?. Available through :< https://www.snapsurveys.com/blog/what-is-
the-difference-between-qualitative-research-and-quantitative-research/>. [Accessed on 26th
June 2016].
8
Paraphrase This Document
Need a fresh take? Get an instant paraphrase of this document with our AI Paraphraser

APPENDIX
Name:______________
Age:_______________
Occupation:_________
Do you travel about Mersey Cruise?
Yes
No
How was service of the Mersey Cruise?
Excellent
Somehow good
Poor
Due to recession you’re spending reduced and lead to increase in savings.
Strongly agree
Agree
Neutral
Disagree
Strongly disagree
Do your frequency on purchasing tour package of cruise reduced to some extent?
Strongly agree
Agree
Neutral
Disagree
Strongly disagree
By commencing cruise service out of British Isles and European nations firm can increase its
customer’s base.
Strongly agree
Agree
Neutral
Disagree
Strongly disagree
9

10
⊘ This is a preview!⊘
Do you want full access?
Subscribe today to unlock all pages.

Trusted by 1+ million students worldwide
1 out of 12
Related Documents

Your All-in-One AI-Powered Toolkit for Academic Success.
+13062052269
info@desklib.com
Available 24*7 on WhatsApp / Email
Unlock your academic potential
Copyright © 2020–2025 A2Z Services. All Rights Reserved. Developed and managed by ZUCOL.