Role of Cholesterol in Heart Disease PDF
VerifiedAdded on 2021/10/01
|8
|1568
|195
AI Summary
Contribute Materials
Your contribution can guide someone’s learning journey. Share your
documents today.
Diseases caused by high cholesterol
Introduction
In this study we analyzed a medical data to check the impact of cholesterol on different diseases
in human beings. You could be at an elevated risk of having other medical problems if you have
high cholesterol. The narrowing of your blood vessels is related to this risk. Coronary heart
disease, stroke, peripheral arterial disease, type 2 diabetes, and high blood pressure are all
diseases linked to high cholesterol.
What disease can be caused by high cholesterol?
Coronary heart disease
Coronary heart disease is the primary factor associated with elevated cholesterol (CHD). Your
blood cholesterol level has a big effect on your risk of heart disease. Cholesterol that is too
strong builds up on the insides of your arteries. Atherosclerosis is the product of this
accumulation over time. As a result of this disorder, arteries narrow, and the narrowed blood
vessels limit blood flow.
Peripheral arterial disease
High cholesterol has also been related to peripheral arterial disease (PAD), which is a category of
diseases that affect blood vessels outside of the heart and brain. Fatty deposits develop along
artery walls in PAD, obstructing blood flow, especially in the arteries leading to the legs and
feet. Kidney arteries are also susceptible to damage.
Type 2 diabetes
Since diabetes can affect various cholesterol levels, type 2 diabetes is another disease linked to
high cholesterol. Even if blood sugar regulation is fine, people with diabetes have higher
triglycerides, lower HDL, and often higher low-density lipoprotein (LDL) (LDL).
Atherosclerosis is more likely to develop as a result of this.
High blood pressure
Hypertension (high blood pressure) and high cholesterol are also related. As cholesterol plaque
and calcium build up in the arteries, the heart has to work even harder to pump blood into them
(atherosclerosis). As a result, blood pressure increases to dangerously high levels.
Secure Best Marks with AI Grader
Need help grading? Try our AI Grader for instant feedback on your assignments.
Research Questions
To access the impact of Cholesterol on above mention diseases we make the following
hypothesis.
H1 :There is no association between diabaties∧cholesterol level .
H2 :There is no association between blood preure∧cholesterol level .
H3 :Thereis no association between smoking∧cholesterol level .
H4 :There is no associationbetween angina∧cholesterol level .
Statistical Analysis:
To check the association between all these variables we used chi square test. Ans also perform
logistic regression to check the impact of age, cholesterol, blood pressure, angina and smoking
on diabetes.
Chi- square test
Chi square test is used to check the independence of two variables are to check the association
between two variables.
Results
1.
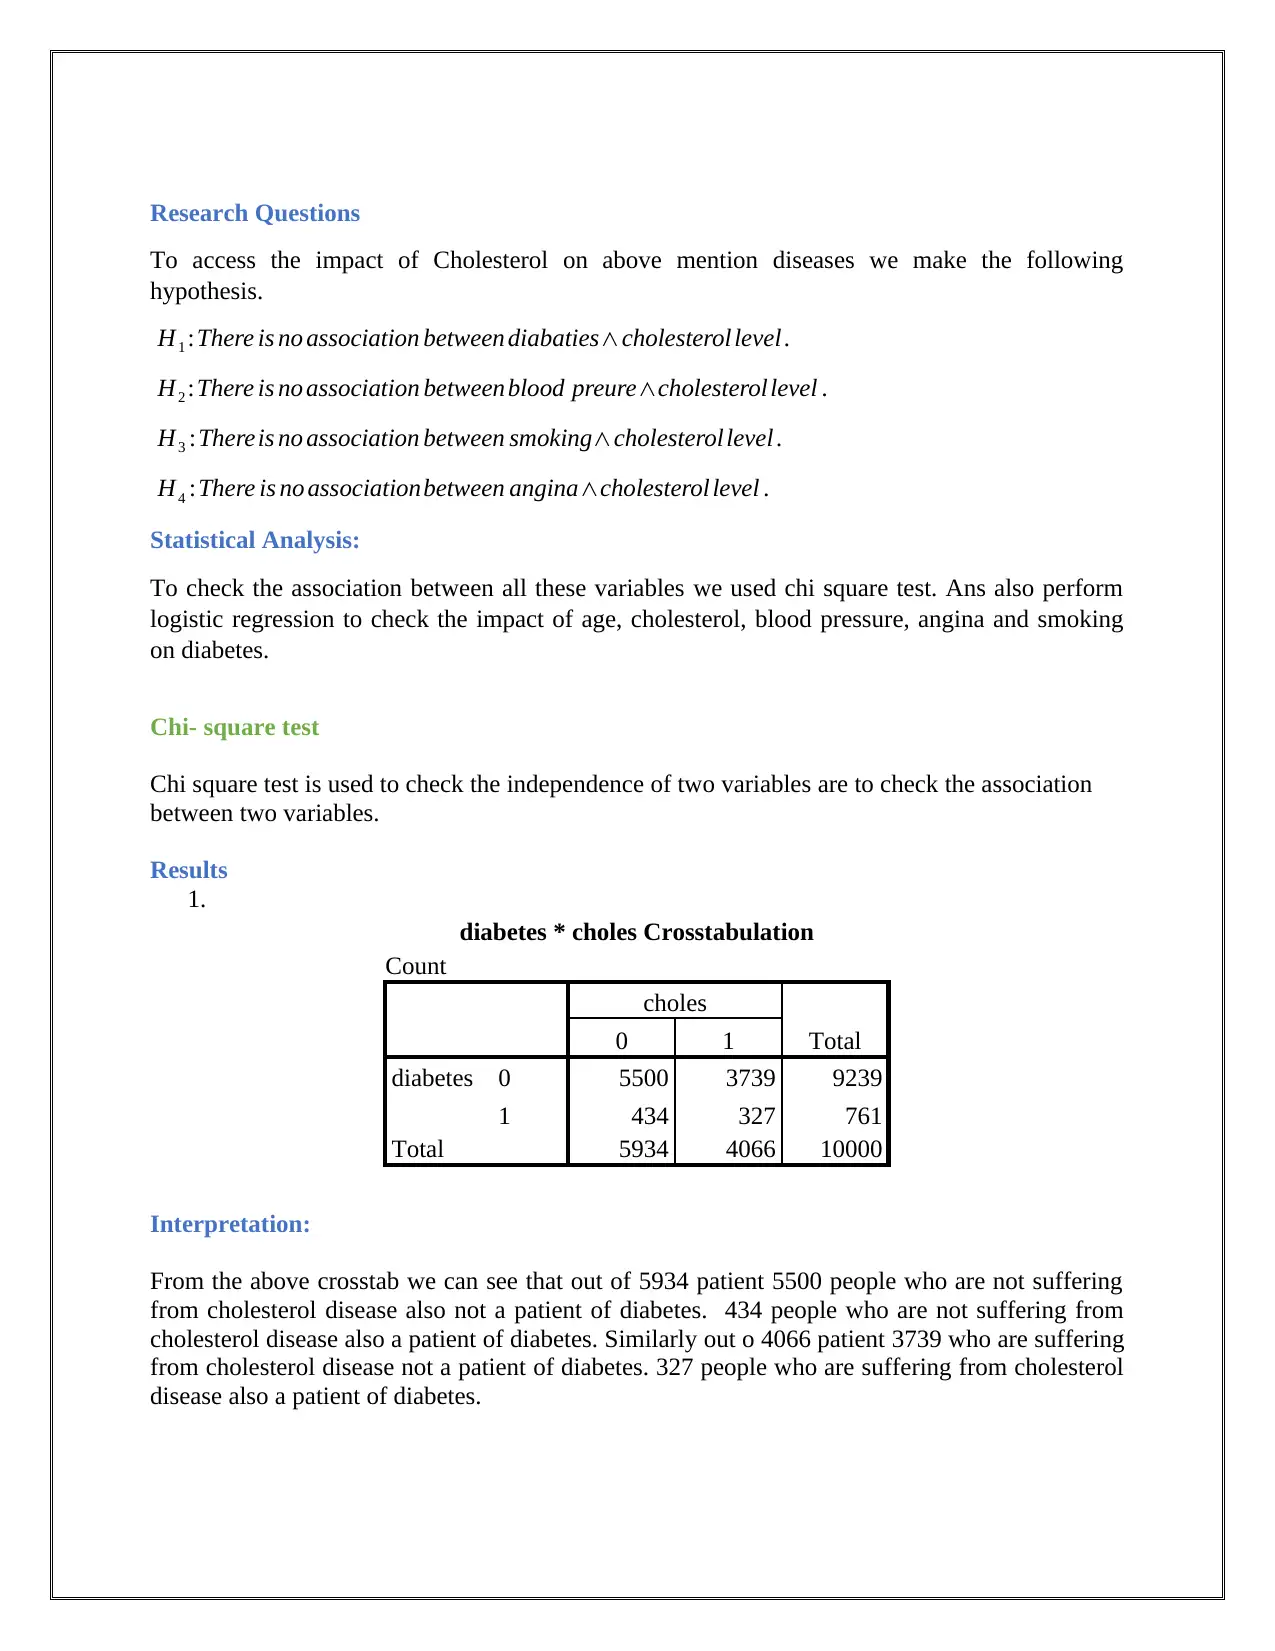
diabetes * choles Crosstabulation
Count
choles
Total0 1
diabetes 0 5500 3739 9239
1 434 327 761
Total 5934 4066 10000
Interpretation:
From the above crosstab we can see that out of 5934 patient 5500 people who are not suffering
from cholesterol disease also not a patient of diabetes. 434 people who are not suffering from
cholesterol disease also a patient of diabetes. Similarly out o 4066 patient 3739 who are suffering
from cholesterol disease not a patient of diabetes. 327 people who are suffering from cholesterol
disease also a patient of diabetes.
To access the impact of Cholesterol on above mention diseases we make the following
hypothesis.
H1 :There is no association between diabaties∧cholesterol level .
H2 :There is no association between blood preure∧cholesterol level .
H3 :Thereis no association between smoking∧cholesterol level .
H4 :There is no associationbetween angina∧cholesterol level .
Statistical Analysis:
To check the association between all these variables we used chi square test. Ans also perform
logistic regression to check the impact of age, cholesterol, blood pressure, angina and smoking
on diabetes.
Chi- square test
Chi square test is used to check the independence of two variables are to check the association
between two variables.
Results
1.
diabetes * choles Crosstabulation
Count
choles
Total0 1
diabetes 0 5500 3739 9239
1 434 327 761
Total 5934 4066 10000
Interpretation:
From the above crosstab we can see that out of 5934 patient 5500 people who are not suffering
from cholesterol disease also not a patient of diabetes. 434 people who are not suffering from
cholesterol disease also a patient of diabetes. Similarly out o 4066 patient 3739 who are suffering
from cholesterol disease not a patient of diabetes. 327 people who are suffering from cholesterol
disease also a patient of diabetes.
Chi-Square Tests
Value df
Asymp. Sig.
(2-sided)
Exact Sig. (2-
sided)
Exact Sig. (1-
sided)
Pearson Chi-Square 1.821a 1 .177
Continuity Correctionb 1.719 1 .190
Likelihood Ratio 1.812 1 .178
Fisher's Exact Test .179 .095
Linear-by-Linear
Association 1.821 1 .177
N of Valid Cases 10000
a. 0 cells (0.0%) have expected count less than 5. The minimum expected count is 309.42.
b. Computed only for a 2x2 table
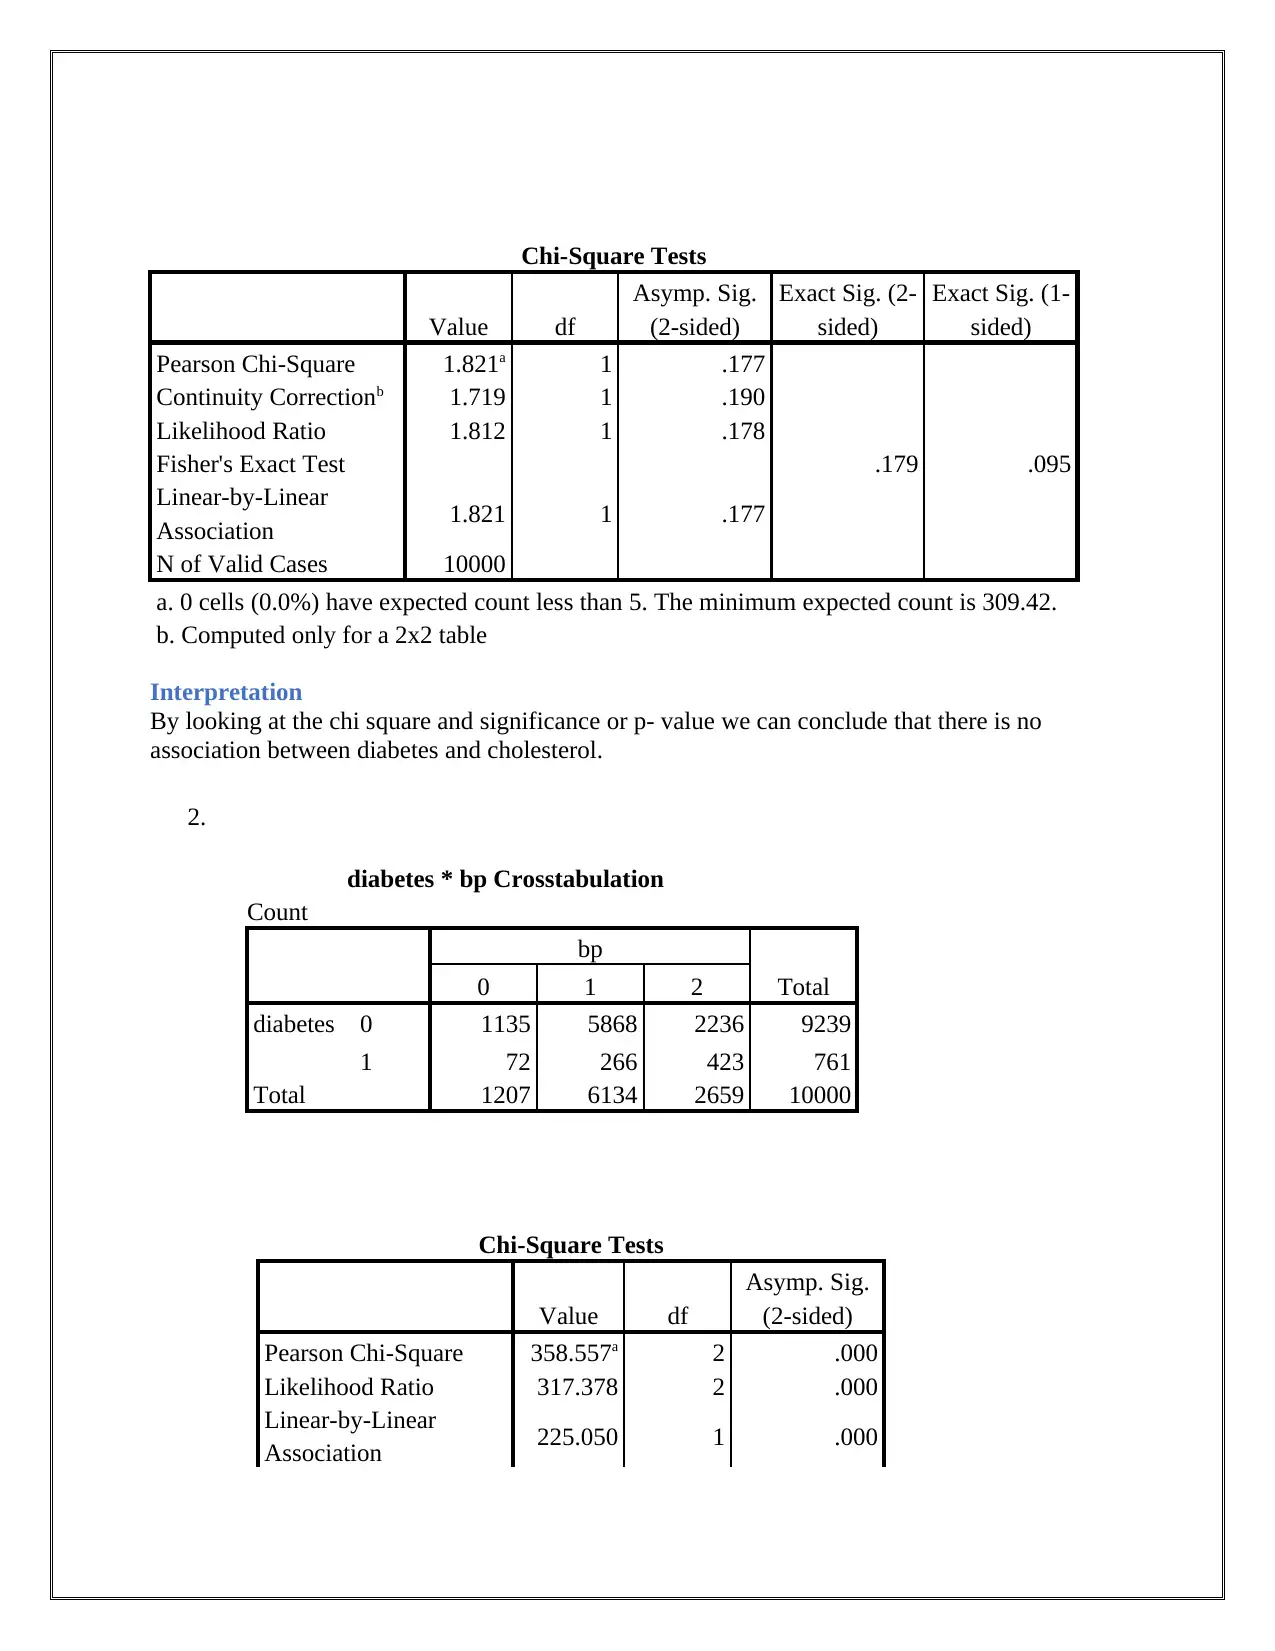
Interpretation
By looking at the chi square and significance or p- value we can conclude that there is no
association between diabetes and cholesterol.
2.
diabetes * bp Crosstabulation
Count
bp
Total0 1 2
diabetes 0 1135 5868 2236 9239
1 72 266 423 761
Total 1207 6134 2659 10000
Chi-Square Tests
Value df
Asymp. Sig.
(2-sided)
Pearson Chi-Square 358.557a 2 .000
Likelihood Ratio 317.378 2 .000
Linear-by-Linear
Association 225.050 1 .000
Value df
Asymp. Sig.
(2-sided)
Exact Sig. (2-
sided)
Exact Sig. (1-
sided)
Pearson Chi-Square 1.821a 1 .177
Continuity Correctionb 1.719 1 .190
Likelihood Ratio 1.812 1 .178
Fisher's Exact Test .179 .095
Linear-by-Linear
Association 1.821 1 .177
N of Valid Cases 10000
a. 0 cells (0.0%) have expected count less than 5. The minimum expected count is 309.42.
b. Computed only for a 2x2 table
Interpretation
By looking at the chi square and significance or p- value we can conclude that there is no
association between diabetes and cholesterol.
2.
diabetes * bp Crosstabulation
Count
bp
Total0 1 2
diabetes 0 1135 5868 2236 9239
1 72 266 423 761
Total 1207 6134 2659 10000
Chi-Square Tests
Value df
Asymp. Sig.
(2-sided)
Pearson Chi-Square 358.557a 2 .000
Likelihood Ratio 317.378 2 .000
Linear-by-Linear
Association 225.050 1 .000
N of Valid Cases 10000
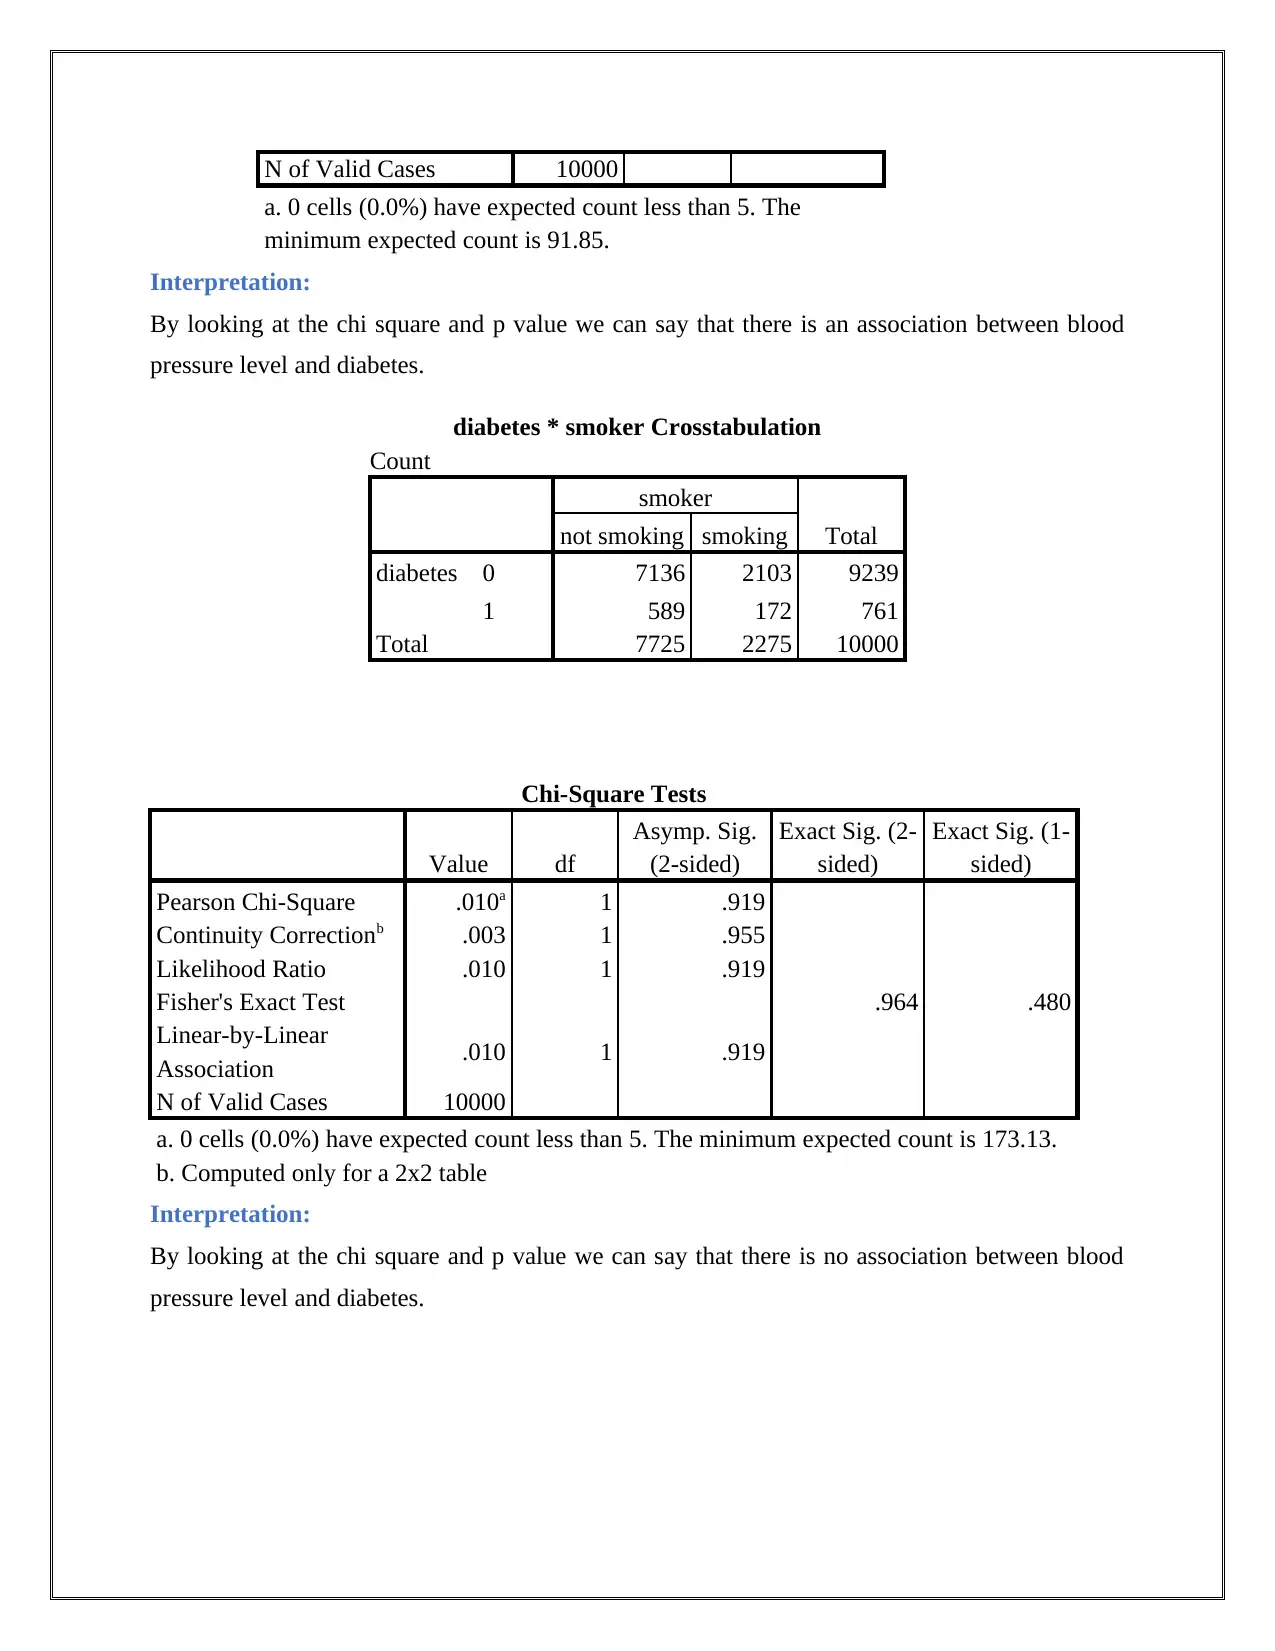
a. 0 cells (0.0%) have expected count less than 5. The
minimum expected count is 91.85.
Interpretation:
By looking at the chi square and p value we can say that there is an association between blood
pressure level and diabetes.
diabetes * smoker Crosstabulation
Count
smoker
Totalnot smoking smoking
diabetes 0 7136 2103 9239
1 589 172 761
Total 7725 2275 10000
Chi-Square Tests
Value df
Asymp. Sig.
(2-sided)
Exact Sig. (2-
sided)
Exact Sig. (1-
sided)
Pearson Chi-Square .010a 1 .919
Continuity Correctionb .003 1 .955
Likelihood Ratio .010 1 .919
Fisher's Exact Test .964 .480
Linear-by-Linear
Association .010 1 .919
N of Valid Cases 10000
a. 0 cells (0.0%) have expected count less than 5. The minimum expected count is 173.13.
b. Computed only for a 2x2 table
Interpretation:
By looking at the chi square and p value we can say that there is no association between blood
pressure level and diabetes.
Secure Best Marks with AI Grader
Need help grading? Try our AI Grader for instant feedback on your assignments.
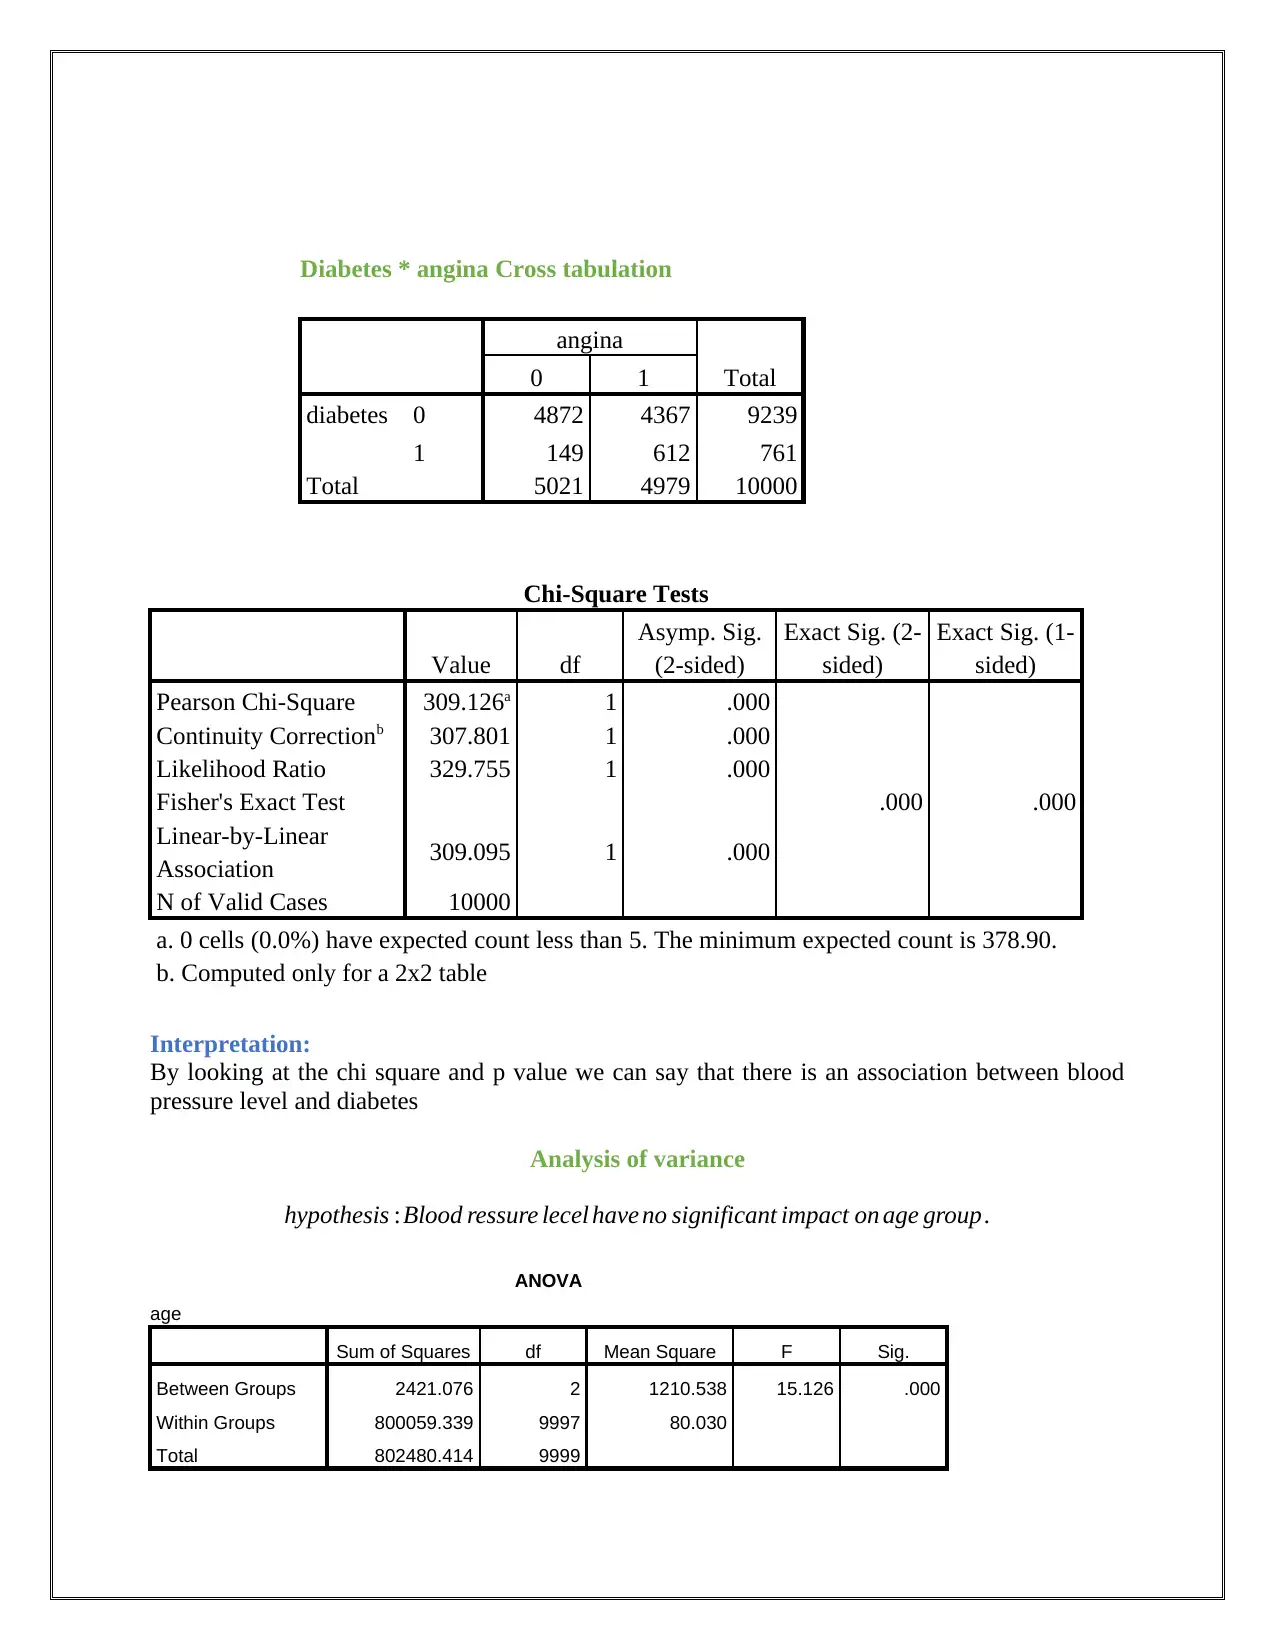
Diabetes * angina Cross tabulation
angina
Total0 1
diabetes 0 4872 4367 9239
1 149 612 761
Total 5021 4979 10000
Chi-Square Tests
Value df
Asymp. Sig.
(2-sided)
Exact Sig. (2-
sided)
Exact Sig. (1-
sided)
Pearson Chi-Square 309.126a 1 .000
Continuity Correctionb 307.801 1 .000
Likelihood Ratio 329.755 1 .000
Fisher's Exact Test .000 .000
Linear-by-Linear
Association 309.095 1 .000
N of Valid Cases 10000
a. 0 cells (0.0%) have expected count less than 5. The minimum expected count is 378.90.
b. Computed only for a 2x2 table
Interpretation:
By looking at the chi square and p value we can say that there is an association between blood
pressure level and diabetes
Analysis of variance
hypothesis :Blood ressure lecel have no significant impact on age group .
ANOVA
age
Sum of Squares df Mean Square F Sig.
Between Groups 2421.076 2 1210.538 15.126 .000
Within Groups 800059.339 9997 80.030
Total 802480.414 9999
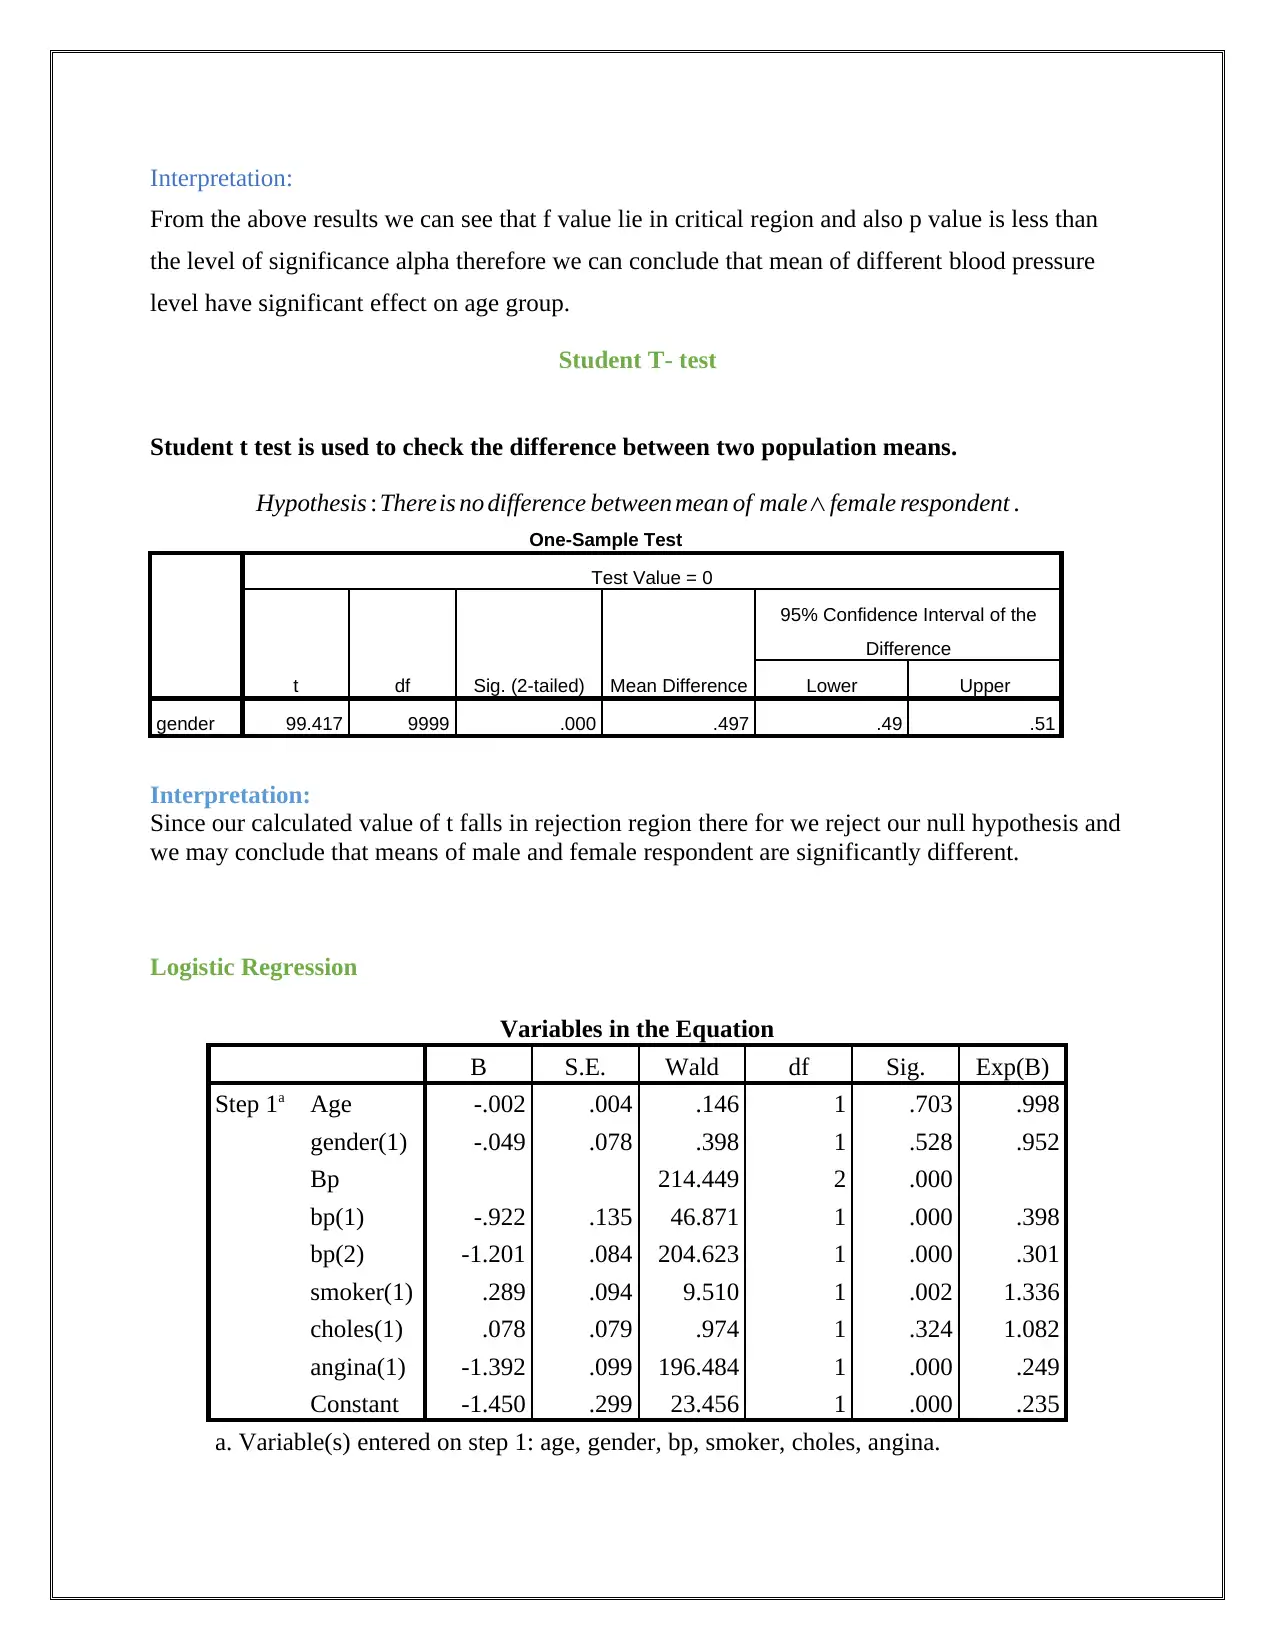
Interpretation:
From the above results we can see that f value lie in critical region and also p value is less than
the level of significance alpha therefore we can conclude that mean of different blood pressure
level have significant effect on age group.
Student T- test
Student t test is used to check the difference between two population means.
Hypothesis :Thereis no difference between mean of male∧female respondent .
One-Sample Test
Test Value = 0
t df Sig. (2-tailed) Mean Difference
95% Confidence Interval of the
Difference
Lower Upper
gender 99.417 9999 .000 .497 .49 .51
Interpretation:
Since our calculated value of t falls in rejection region there for we reject our null hypothesis and
we may conclude that means of male and female respondent are significantly different.
Logistic Regression
Variables in the Equation
B S.E. Wald df Sig. Exp(B)
Step 1a Age -.002 .004 .146 1 .703 .998
gender(1) -.049 .078 .398 1 .528 .952
Bp 214.449 2 .000
bp(1) -.922 .135 46.871 1 .000 .398
bp(2) -1.201 .084 204.623 1 .000 .301
smoker(1) .289 .094 9.510 1 .002 1.336
choles(1) .078 .079 .974 1 .324 1.082
angina(1) -1.392 .099 196.484 1 .000 .249
Constant -1.450 .299 23.456 1 .000 .235
a. Variable(s) entered on step 1: age, gender, bp, smoker, choles, angina.

Interpretation:
From the above table by looking at the odds of age from B columns, we can see that age variable
have negative relationship with diabetes. Also gender be level 1 and 2 and angina have negative
relationship with diabetes. From the B or odds column we can see that by increasing one unit in
age variable we expect a 0.02 unit’s decrease in log odds of patient having diabetes. Similarly In
gender level male as compare to female we expect 0.049 unit decrease in diabetes. Bp level 1
and 2 also have negative relation ship with diabetes. Smoking and cholesterol variable have
positive relationship with diabetes. And angina have negative impact on diabetes. . From the
significant column we can see that p- value for age gender and cholesterol are greater than the
level of significance alpha therefore we can say that these variables have insignificant effect on
diabetes . Angina smoking and be level have significant impact on response diabetes.
Conclusion
By looking at the above results we can conclude that age and gender and cholesterol have no
impact on diabetic. Although cholesterol have positive impact but not significant impact on
diabetes. Angina smoking and be level have significant impact on response diabetes.
Further Recommendation
For the analysis of medical dataset instead of using chi square or logistic regression analysis we
can also use survival analysis which is based on Kaplan Mayer and hazard ratio. Now a days
very popular in medical studies.
Paraphrase This Document
Need a fresh take? Get an instant paraphrase of this document with our AI Paraphraser

References
Egen, B. M. (2014). Blood Pressure and Cholesterol Control in Hypertensive
Hypercholesterolemic Patients: NHANES 1988–2010.
Egen, B. M. (2014). Blood Pressure and Cholesterol Control in Hypertensive
Hypercholesterolemic Patients: NHANES 1988–2010.
1 out of 8
Related Documents


Your All-in-One AI-Powered Toolkit for Academic Success.
+13062052269
info@desklib.com
Available 24*7 on WhatsApp / Email
![[object Object]](/_next/static/media/star-bottom.7253800d.svg)
Unlock your academic potential
© 2024 | Zucol Services PVT LTD | All rights reserved.